

A type I IFN-Flt3 ligand axis augments plasmacytoid dendritic cell development from common lymphoid progenitors
- PMID: 24145513
- PMCID: PMC3832917
- DOI: 10.1084/jem.20130536
A type I IFN-Flt3 ligand axis augments plasmacytoid dendritic cell development from common lymphoid progenitors
Abstract
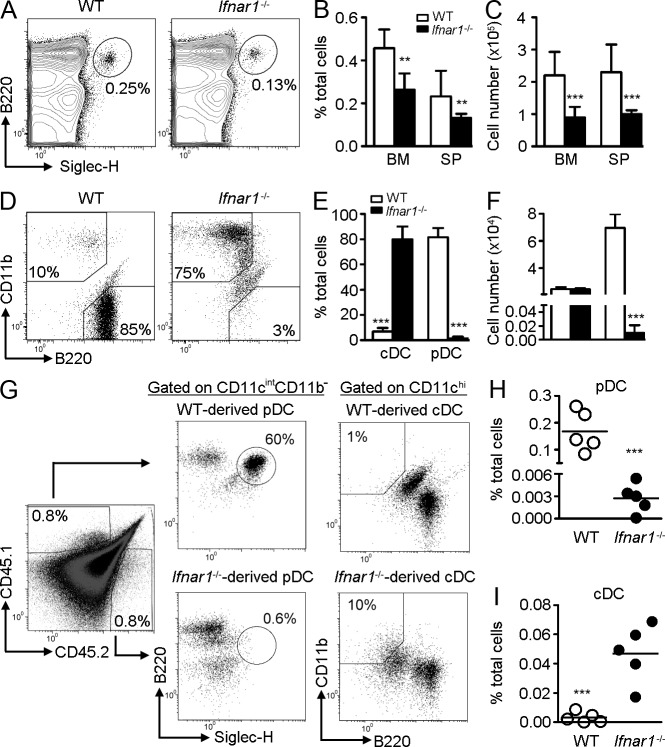
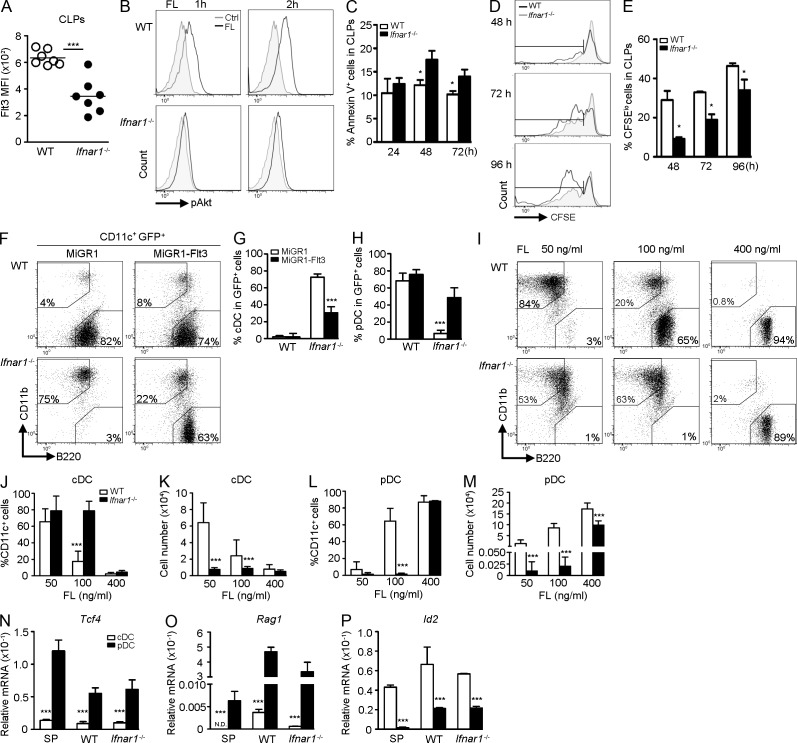
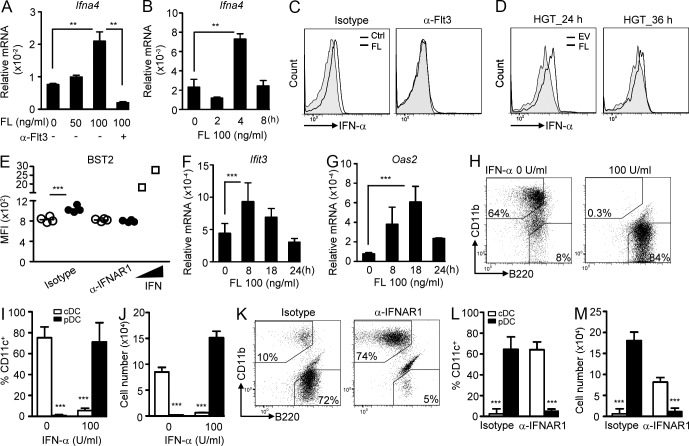
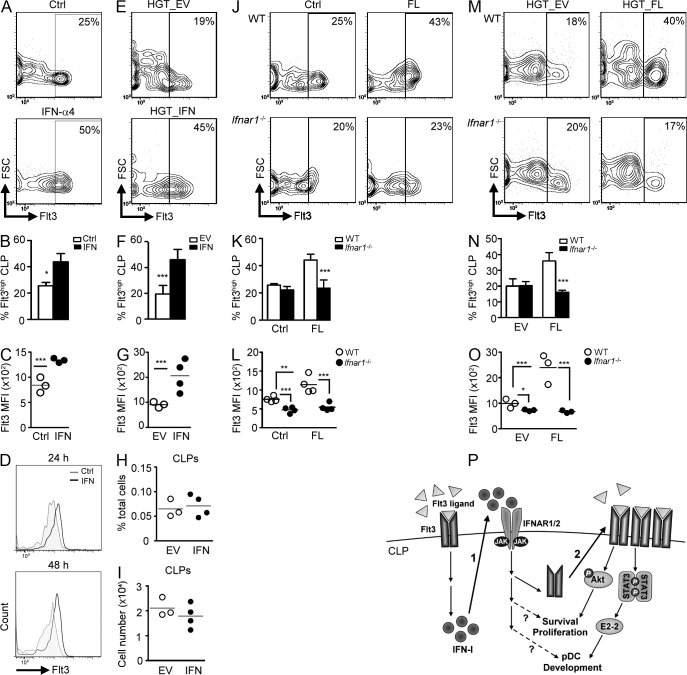
During infections and inflammation, plasmacytoid dendritic cells (pDCs) are the most potent type I interferon (IFN-I)-producing cells. However, the developmental origin of pDCs and the signals dictating pDC generation remain incompletely understood. Here, we report a synergistic role for IFN-I and Flt3 ligand (FL) in pDC development from common lymphoid progenitors (CLPs). Both conventional DCs (cDCs) and pDCs were generated from CLPs in response to FL, whereas pDC generation required higher concentrations of FL and concurrent IFN-I signaling. An absence of IFN-I receptor, impairment of IFN-I signaling, or neutralization of IFN-I significantly impeded pDC development from CLPs. Furthermore, FL induced IFN-I expression in CLPs, which in turn induced Flt3 up-regulation that facilitated survival and proliferation of CLPs, as well as their differentiation into pDCs. Collectively, these results define a critical role for the FL/IFN-I/Flt3 axis in pDC differentiation from CLPs.
Figures
Similar articles
-
What Makes a pDC: Recent Advances in Understanding Plasmacytoid DC Development and Heterogeneity.Front Immunol. 2019 May 29;10:1222. doi: 10.3389/fimmu.2019.01222. eCollection 2019. Front Immunol. 2019. PMID: 31191558 Free PMC article. Review.
-
Efficient Generation of Plasmacytoid Dendritic Cell from Common Lymphoid Progenitors by Flt3 Ligand.PLoS One. 2015 Aug 11;10(8):e0135217. doi: 10.1371/journal.pone.0135217. eCollection 2015. PLoS One. 2015. PMID: 26263178 Free PMC article.
-
The developmental program of human dendritic cells is operated independently of conventional myeloid and lymphoid pathways.Blood. 2007 Nov 15;110(10):3591-660. doi: 10.1182/blood-2007-02-071613. Epub 2007 Jul 30. Blood. 2007. PMID: 17664352 Free PMC article.
-
Lymphoid origin of intrinsically activated plasmacytoid dendritic cells in mice.Elife. 2024 Sep 13;13:RP96394. doi: 10.7554/eLife.96394. Elife. 2024. PMID: 39269281 Free PMC article.
-
Flt3 in regulation of type I interferon-producing cell and dendritic cell development.Ann N Y Acad Sci. 2007 Jun;1106:253-61. doi: 10.1196/annals.1392.015. Epub 2007 Mar 14. Ann N Y Acad Sci. 2007. PMID: 17360795 Review.
Cited by
-
Clinically applicable CD34+-derived blood dendritic cell subsets exhibit key subset-specific features and potently boost anti-tumor T and NK cell responses.Cancer Immunol Immunother. 2021 Nov;70(11):3167-3181. doi: 10.1007/s00262-021-02899-3. Epub 2021 Apr 1. Cancer Immunol Immunother. 2021. PMID: 33796917 Free PMC article.
-
What Makes a pDC: Recent Advances in Understanding Plasmacytoid DC Development and Heterogeneity.Front Immunol. 2019 May 29;10:1222. doi: 10.3389/fimmu.2019.01222. eCollection 2019. Front Immunol. 2019. PMID: 31191558 Free PMC article. Review.
-
A negative feedback loop of transcription factors specifies alternative dendritic cell chromatin States.Mol Cell. 2014 Dec 18;56(6):749-62. doi: 10.1016/j.molcel.2014.10.014. Epub 2014 Nov 20. Mol Cell. 2014. PMID: 25453760 Free PMC article.
-
Single-cell profiling of microenvironment components by spatial localization in pancreatic ductal adenocarcinoma.Theranostics. 2022 Jun 27;12(11):4980-4992. doi: 10.7150/thno.73222. eCollection 2022. Theranostics. 2022. PMID: 35836806 Free PMC article.
-
Coxsackievirus cloverleaf RNA containing a 5' triphosphate triggers an antiviral response via RIG-I activation.PLoS One. 2014 Apr 23;9(4):e95927. doi: 10.1371/journal.pone.0095927. eCollection 2014. PLoS One. 2014. PMID: 24759703 Free PMC article.
References
-
- Dalod M., Salazar-Mather T.P., Malmgaard L., Lewis C., Asselin-Paturel C., Brière F., Trinchieri G., Biron C.A. 2002. Interferon alpha/beta and interleukin 12 responses to viral infections: pathways regulating dendritic cell cytokine expression in vivo. J. Exp. Med. 195:517–528 10.1084/jem.20011672 - DOI - PMC - PubMed
Publication types
MeSH terms
Substances
LinkOut - more resources
Full Text Sources
Other Literature Sources
Molecular Biology Databases
Miscellaneous
