. 2013 Nov 18;210(12):2539-52.
doi: 10.1084/jem.20131274. Epub 2013 Oct 21.

SIRPα polymorphisms, but not the prion protein, control phagocytosis of apoptotic cells

Affiliations

SIRPα polymorphisms, but not the prion protein, control phagocytosis of apoptotic cells

Mario Nuvolone et al. J Exp Med. .

Abstract

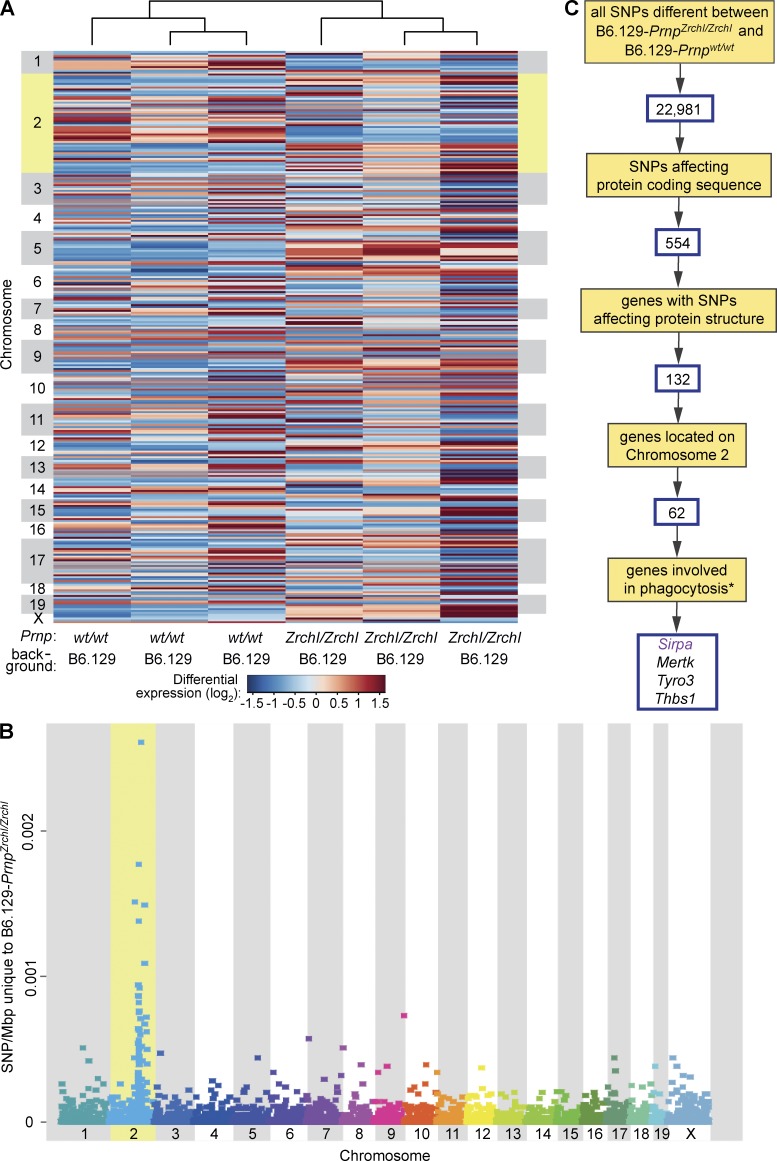
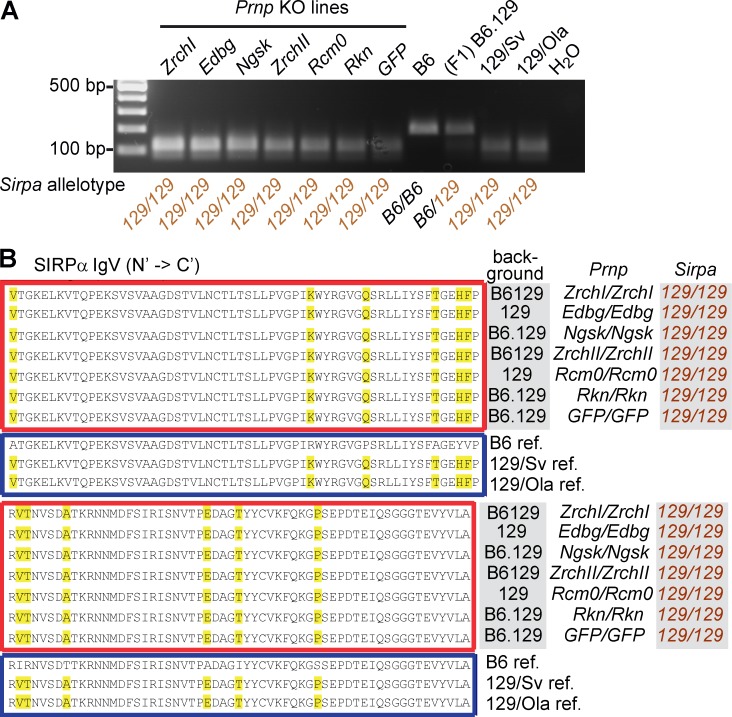
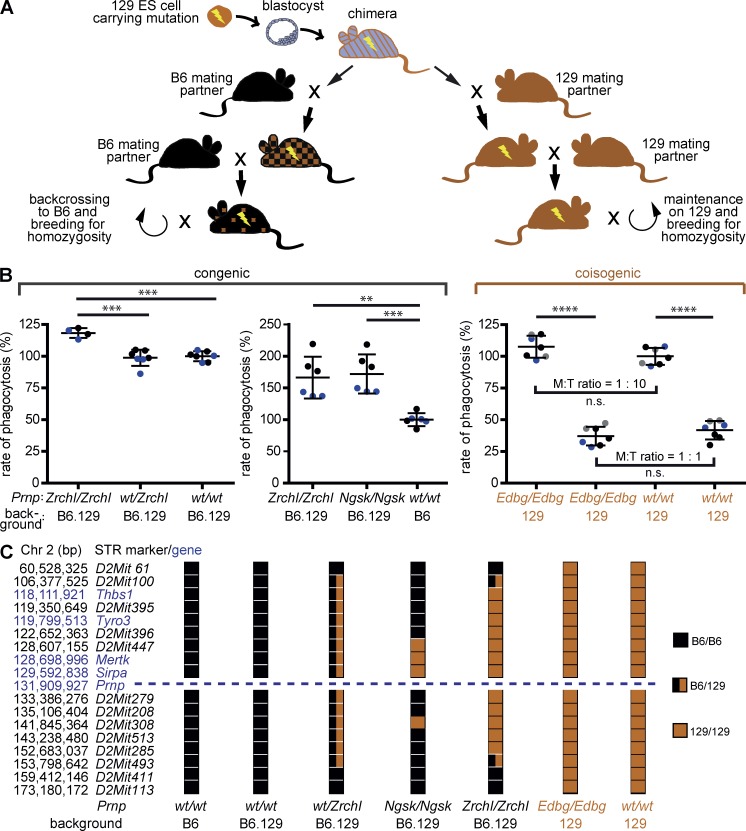
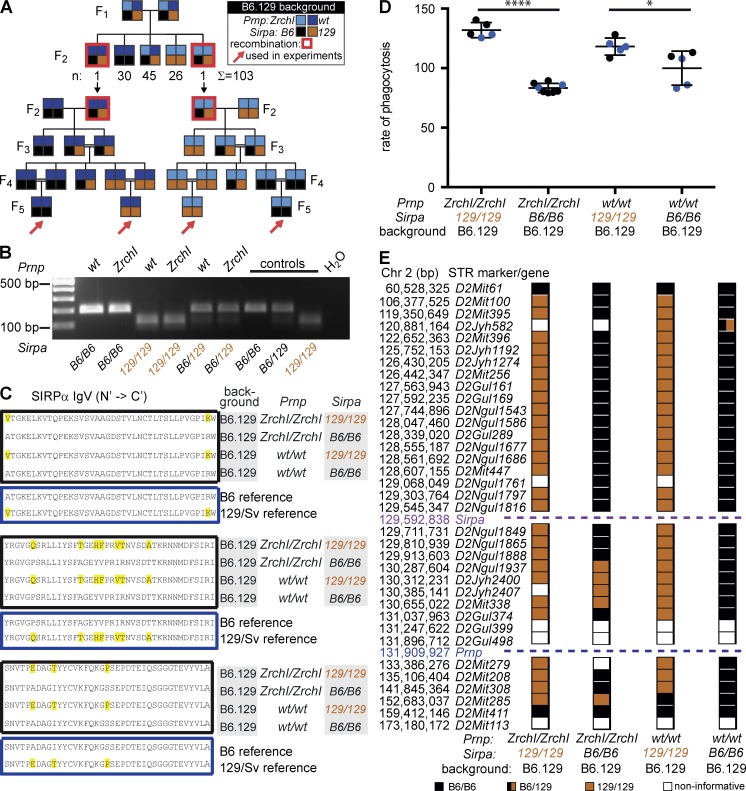
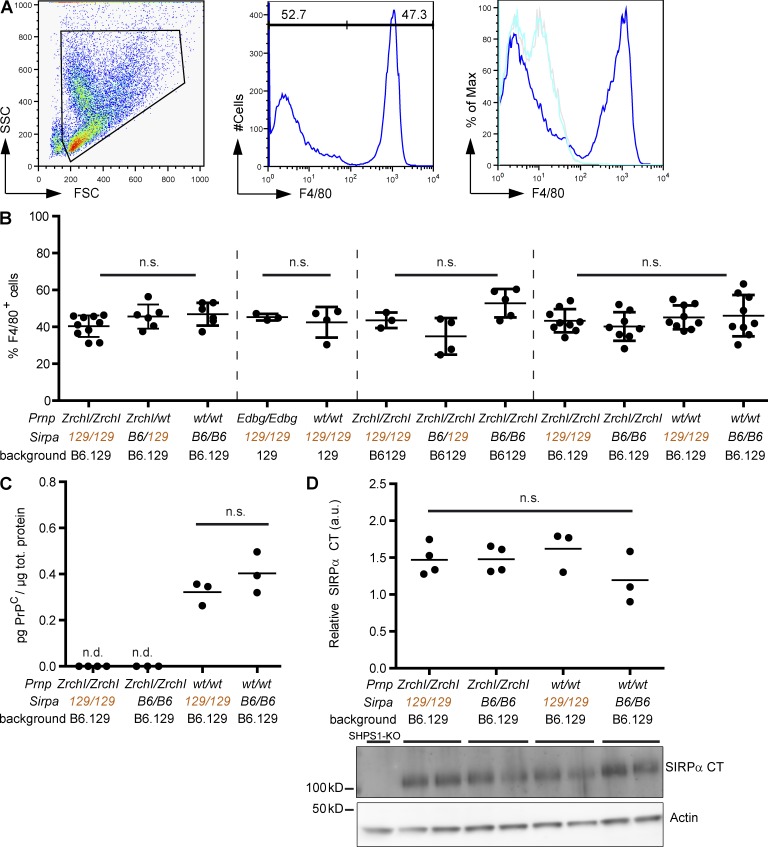
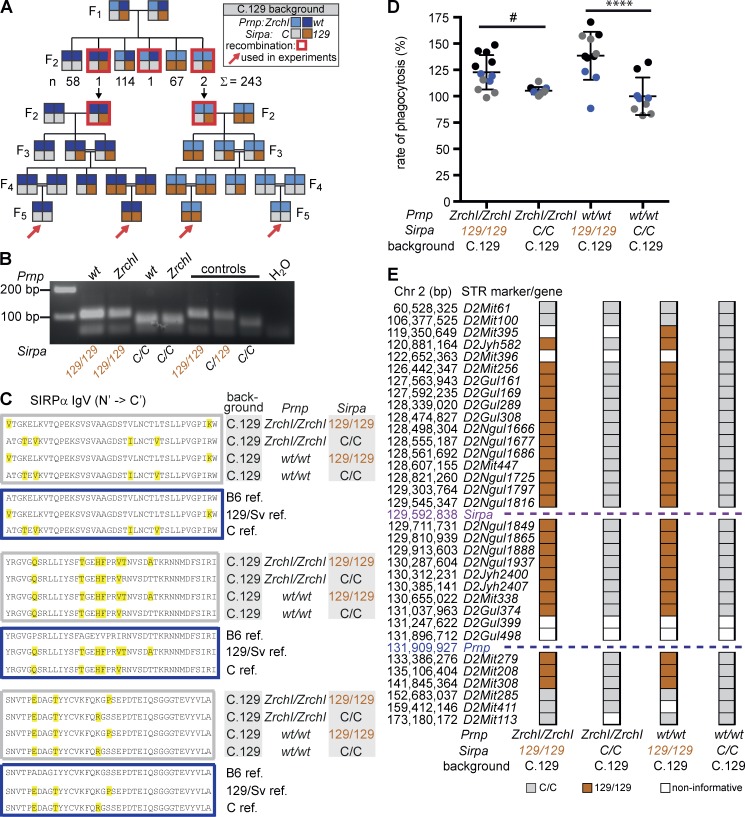
Prnp(-/-) mice lack the prion protein PrP(C) and are resistant to prion infections, but variable phenotypes have been reported in Prnp(-/-) mice and the physiological function of PrP(C) remains poorly understood. Here we examined a cell-autonomous phenotype, inhibition of macrophage phagocytosis of apoptotic cells, previously reported in Prnp(-/-) mice. Using formal genetic, genomic, and immunological analyses, we found that the regulation of phagocytosis previously ascribed to PrP(C) is instead controlled by a linked locus encoding the signal regulatory protein α (Sirpa). These findings indicate that control of phagocytosis was previously misattributed to the prion protein and illustrate the requirement for stringent approaches to eliminate confounding effects of flanking genes in studies modeling human disease in gene-targeted mice. The plethora of seemingly unrelated functions attributed to PrP(C) suggests that additional phenotypes reported in Prnp(-/-) mice may actually relate to Sirpa or other genetic confounders.


Figures

Figure 1.
Figure 1.
RNA sequencing identifies macrophage-expressed genes potentially controlling phagocytosis in PrnpZrchI/ZrchI versus Prnpwt/wt mice. (A) mRNA heat map highlighting 305 differentially expressed genes between B6.129-PrnpZrchI/ZrchI and B6.129-Prnpwt/wt (pMΦs, three mice per group), ordered by chromosomal location (vertical) and unsupervised hierarchical clustering (horizontal). Chr 2 (in yellow) contains significantly more differentially expressed genes (P = 0.0011, based on Z score > 44 and corrected for chromosome size). Individual genes are listed in Table S1. (B) Physical distribution of SNPs unique to the B6.129-PrnpZrchI/ZrchI pMΦ transcriptome clustered on Chr 2 (in yellow; two-tailed Student’s t test, P = 0.019) at 128–156 Mbp. (C) Filtering strategy to prioritize genes controlling phagocytosis in PrnpZrchI/ZrchI versus Prnpwt/wt mice. Sequential filters were applied to a total of 22,981 SNPs differing between the B6.129-PrnpZrchI/ZrchI and B6.129-Prnpwt/wt pMΦ transcriptomes. SNPs affecting protein coding sequence included nonsynonymous SNPs and insertions/deletions. The asterisk indicates phenotypic definition based on gene ontology annotations and PubMed searches. Sirpa, Mertk, Thbs1, and Tyro3 display nonsynonymous SNPs between B6.129-PrnpZrchI/ZrchI and B6.129-Prnpwt/wt mice, reside on Chr 2, and are involved in phagocytosis. However, only Sirpa (purple) is known to display polymorphisms that modulate phagocytosis.
Figure 2.
Figure 2.
Sirpa allelotype of the Prnp−/− lines analyzed in this study. (A) RFLP analysis of Sirpa allelotypes. The Sirpa129 allele segregates with the Prnp allele in Prnp−/− mouse lines stemming from seven independent targeting events (see Table 1). The 8th through 11th lanes show respective reference strain DNA. (B) The red box indicates protein sequence alignment of mouse SIRPα Ig-like variable domain (IgV) confirming the 129 Sirpa allelotype in each one of the seven Prnp−/− lines shown in A. The blue box indicates SIRPα protein reference sequences for the B6, 129/Sv, and 129/Ola strains. Polymorphisms are highlighted in yellow. For each group one mouse was analyzed.
Figure 3.
Figure 3.
Ablation of Prnp is not sufficient to enhance phagocytosis of apoptotic cells. (A) Generation of B6.129 congenic (left) and 129 co-isogenic (right) Prnp−/− lines. In B6.129 congenic mice, residual 129 genomic material derived from the ES cell (brown) is inevitably present, particularly in the region flanking the targeted locus. (B, left) pMΦs from congenic B6.129-PrnpZrchI/ZrchI mice showed higher phagocytic activity than those from B6.129-Prnpwt/wt (set as 100%) and B6.129-Prnpwt/ZrchI littermates. Blue, black, and gray (here and henceforth) indicate data from independent experiments. (middle) B6.129-PrnpZrchI/ZrchI and B6.129-PrnpNgsk/Ngsk BMDMs showed higher phagocytic activity than B6-Prnpwt/wt macrophages (set as 100%). (right) The phagocytic activity of 129-PrnpEdbg/Edbg and 129-Prnpwt/wt macrophages was similar, even when two different macrophage/thymocyte (M:T) ratios were used (1:10 and 1:1; one-way ANOVA, Bonferroni’s multiple comparisons test). Mean 129-Prnpwt/wt phagocytic rate at 1:10 M:T ratio was set as 100%. n.s., not significant; **, P < 0.005; ***, P < 0.001; ****, P < 0.0001. Error bars indicate SD. (C) STR analysis of Chr 2. Name and physical position of each STR marker (colored boxes) are indicated on the left. B6.129-PrnpZrchI/ZrchI and B6.129-PrnpNgsk/NgskI mice contained 129-derived genetic material flanking Prnp, whereas the markers flanking Prnp in 129-PrnpEdbg/Edbg and 129-Prnpwt/wt mice were identical. Data show representative mice of at least three animals analyzed per group.
Figure 4.
Figure 4.
SirpaB6 allele segregates with enhanced inhibition of phagocytosis in the absence of Prnp. (A) Breeding scheme applied to generate B6129-PrnpZrchI/ZrchI mice containing SirpaB6 and Sirpa129 alleles. B6129-PrnpZrchI/ZrchI SirpaB6/B6 tga20tg/tg mice (F0) were backcrossed to B6129-PrnpZrchI/ZrchI Sirpa129/129 mice for two generations to produce B6129-PrnpZrchI/ZrchI littermates, with all combinations of SirpaB6 and Sirpa129 alleles (F3) used to assess phagocytic activity as in C. (B) RFLP analysis of Sirpa allelotypes (B6 vs. 129). Surprisingly, tga20 mice (first through third lanes) displayed combinations of SirpaB6 and Sirpa129 alleles. The fourth through sixth lanes show B6129-PrnpZrchI/ZrchI mice labeled in A (red arrows). Controls are reference DNA. All animals entering the study were analyzed. (C) Phagocytic hyperactivity of B6129-PrnpZrchI/ZrchI pMΦs was associated with the Sirpa129/129 allelotype. Data from three independent experiments (blue, black, and gray) normalized against mean B6129-PrnpZrchI/ZrchISirpaB6/B6 phagocytic rates. One-way ANOVA, Bonferroni’s multiple comparisons test: *, P < 0.05; ***, P < 0.001. Error bars indicate SD. (D) STR analysis documenting the boundaries of B6 versus 129-derived genome in Chr 2 of B6129-PrnpZrchI/ZrchI with different combinations of Sirpa alleles (B6 vs. 129). Name and position of each STR marker (colored box) on Chr 2 are indicated on the left. Data show representative mice of at least three animals analyzed per group.
Figure 5.
Figure 5.
Hyperphagocytosis is associated with the Sirpa129/129 allelotype but not with Prnp gene dosage. (A) Breeding scheme to generate recombinant congenic B6.129 mice with different combinations of Prnp (WT and ZrchI) and Sirpa (B6 and 129) alleles. B6.129-Prnpwt/ZrchI mice (F1) were intercrossed, and F2 offspring were screened for meiotic recombination between Prnp and Sirpa. 103 F2 mice with different combinations of Prnp genotypes and Sirpa allelotypes were obtained. Two mice (red frames) were found to carry the recombinant haplotype, Prnpwt-Sirpa129 and PrnpZrchI-SirpaB6 and were interbred to generate B6.129-PrnpZrchI/ZrchI and B6.129-Prnpwt/wt mice homozygous for SirpaB6 or Sirpa129 alleles. (B) RFLP analysis to discriminate between Sirpa129 and SirpaB6. B6.129-Prnpwt/wt (first, third, and fifth lanes) and B6.129-PrnpZrchI/ZrchI (second, fourth, and sixth lanes) mice with different combinations of Sirpa129 and SirpaB6 alleles. Controls are reference DNA. All animals entering the study were analyzed. (C) Protein sequence variants (yellow) in SIRPα Ig-like variable domain (IgV). Homozygous recombinant congenic B6.129 mice displayed four combinations of Prnp-Sirpa haplotypes (black boxes). Blue boxes show SIRPα sequence of reference B6 and 129/Sv strains. For each group one mouse was analyzed. (D) Sirpa129/129, but not Prnp−/−, was associated with hyperphagocytosis in pMΦs from congenic B6.129 mice. Data are from two independent experiments (blue and black); phagocytosis rates were normalized against B6.129 Prnpwt/wt SirpaB6/B6. One-way ANOVA, Bonferroni’s multiple comparisons post-test: *, P < 0.05; ****, P < 0.0001. Error bars indicate SD. (E) Recombination breakpoints between Prnp and Sirpa in congenic B6.129 mice. For each STR marker (colored box), name and position on Chr 2 are indicated on the left. Data show representative mice of at least three animals analyzed per group.
Figure 6.
Figure 6.
Sirpa allelotype does not influence pMΦ abundance or PrPC and SIRPα expression. (A) Peritoneal lavages were gated for nucleated cells (left), and the percentage of F4/80+ cells was assessed (middle panel, right peak). (right) Overlay of histograms of F4/80 (dark blue), isotype antibody (light blue), and unstained peritoneal cells (gray) confirming the specificity of the staining. (B) Percentage of F4/80+ macrophages in peritoneal lavage cells of experimental mice. The dotted lines delineate individual experiments in which groups of mice (n = 3–10 for each haplotype) were analyzed. Error bars indicate SD. (C) PrPC ELISA analysis of pMΦ lysates showed no difference (n.s.) in PrPC levels between B6.129-Prnpwt/wt mice with different Sirpa allelotypes. Two-tailed unpaired Student’s t test: P = 0.241; n = 3–4 for each haplotype. n.d., not detectable. (D) Unchanged expression of the SIRPα cytoplasmic tail (CT) in cultured pMΦ lysates as quantified to actin levels. SHPS-1 KO macrophage lysates lacking the cytosolic tail of SIRPα were used as negative control. One-way ANOVA: n.s., not significant; P = 0.27; n = 3–4 for each haplotype. Horizontal bars indicate mean.
Figure 7.
Figure 7.
Phagocytic activity level is associated with Sirpa129/129 allelotype but not with Prnp gene dosage also in C.129 congenic mice. (A) Breeding scheme to generate recombinant congenic C.129 mice with different combinations of Prnp (WT and ZrchI) and Sirpa (C and 129) alleles. C.129-Prnpwt/ZrchI mice (F1) were intercrossed, and the occurrence of meiotic recombination between Prnp and Sirpa was assessed in the F2 offspring. 243 F2 mice with different combinations of Prnp genotypes and Sirpa allelotypes were obtained. Four mice (red frames) were found to carry a recombinant haplotype, and selected ones were bred to generate C.129-PrnpZrchI/ZrchI and C.129-Prnpwt/wt mice homozygous for SirpaC or Sirpa129 alleles. (B) RFLP analysis used to discriminate Sirpa129 from SirpaC alleles. C.129-Prnpwt/wt (first, third, and fifth lanes) and C.129-PrnpZrchI/ZrchI (second, fourth, and sixth lanes) mice with different combinations of Sirpa129 and SirpaC alleles. Controls are reference DNA. All animals entering the study were analyzed. (C) Protein sequence alignment of mouse SIRPα Ig-like variable domain (IgV) illustrates recombinant congenic C.129 mice with different combinations of Prnp and Sirpa129 versus SirpaC (gray border). Blue boxes are SIRPα protein reference sequences for the B6, 129/Sv, and C strains (yellow: polymorphisms). For each group one mouse was analyzed. (D) Sirpa129/129 allelotype, but not the absence of Prnp, was associated with hyperphagocytosis of BMDMs in congenic C.129 mice. Data are from three independent experiments (blue, black, and gray). Mean phagocytosis rates of C.129 PrnpZrchI/ZrchI SirpaB6/B6 were set as 100%. One-way ANOVA, Bonferroni’s multiple comparison post-test: #, P = 0.075; ****, P < 0.0001. Error bars indicate SD. (E) STR analysis documents the result of trans-allelic meiotic recombination between Prnp and Sirpa. Blue dashed line indicates the location of Prnp and Sirpa. For each STR marker (colored box), name and position on Chr 2 are indicated on the left. Data show representative mice of at least three animals analyzed per group.

Similar articles

Cited by

References

    1. Aguzzi A., Calella A.M. 2009. Prions: protein aggregation and infectious diseases. Physiol. Rev. 89:1105–1152 10.1152/physrev.00006.2009 - DOI - PubMed
    1. Balducci C., Beeg M., Stravalaci M., Bastone A., Sclip A., Biasini E., Tapella L., Colombo L., Manzoni C., Borsello T., et al. 2010. Synthetic amyloid-beta oligomers impair long-term memory independently of cellular prion protein. Proc. Natl. Acad. Sci. USA. 107:2295–2300 10.1073/pnas.0911829107 - DOI - PMC - PubMed
    1. Barclay A.N., Brown M.H. 2006. The SIRP family of receptors and immune regulation. Nat. Rev. Immunol. 6:457–464 10.1038/nri1859 - DOI - PubMed
    1. Bremer J., Baumann F., Tiberi C., Wessig C., Fischer H., Schwarz P., Steele A.D., Toyka K.V., Nave K.A., Weis J., Aguzzi A. 2010. Axonal prion protein is required for peripheral myelin maintenance. Nat. Neurosci. 13:310–318 10.1038/nn.2483 - DOI - PubMed
    1. Büeler H.R., Fischer M., Lang Y., Bluethmann H., Lipp H.P., DeArmond S.J., Prusiner S.B., Aguet M., Weissmann C. 1992. Normal development and behaviour of mice lacking the neuronal cell-surface PrP protein. Nature. 356:577–582 10.1038/356577a0 - DOI - PubMed

Publication types

MeSH terms