. 2014 Feb;28(2):627-43.
doi: 10.1096/fj.13-237792. Epub 2013 Oct 21.

Effects of prostaglandin E2 on p53 mRNA transcription and p53 mutagenesis during T-cell-independent human B-cell clonal expansion

Affiliations

Effects of prostaglandin E2 on p53 mRNA transcription and p53 mutagenesis during T-cell-independent human B-cell clonal expansion

Shabirul Haque et al. FASEB J. 2014 Feb.

Abstract

Within T-cell-dependent germinal centers, p53 gene transcription is repressed by Bcl-6 and is thus less vulnerable to mutation. Malignant lymphomas within inflamed extranodal sites exhibit a relatively high incidence of p53 mutations. The latter might originate from normal B-cell clones manifesting activation-induced cytosine deaminase (AID) and up-regulated p53 following T-cell-independent (TI) stimulation. We here examine p53 gene transcription in such TI clones, with a focus on modulatory effects of prostaglandin E2 (PGE2), and evaluate progeny for p53 mutations. Resting IgM(+)IgD(+)CD27(-) B cells from human tonsils were labeled with CFSE and stimulated in vitro with complement-coated antigen surrogate, IL-4, and BAFF ± exogenous PGE2 (50 nM) or an analog specific for the EP2 PGE2 receptor. We use flow cytometry to measure p53 and AID protein within variably divided blasts, qRT-PCR of p53 mRNA from cultures with or without actinomycin D to monitor mRNA transcription/stability, and single-cell p53 RT-PCR/sequencing to assess progeny for p53 mutations. We report that EP2 signaling triggers increased p53 gene transcriptional activity in AID(+) cycling blasts (P<0.01). Progeny exhibit p53 mutations at a frequency (8.5 × 10(-4)) greater than the baseline error rate (<0.8 × 10(-4)). We conclude that, devoid of the repressive influences of Bcl-6, dividing B lymphoblasts in inflamed tissues should display heightened p53 transcription and increased risk of p53 mutagenesis.

Keywords: B lymphocyte; TP53; eicosanoid; inflammation; lymphoma.


Figures

Figure 1.
Figure 1.
p53 protein is maximally up-regulated at earlier divisions than is AID protein. p53 and AID were simultaneously evaluated in CFSE-labeled B-cell cultures proliferating in response to BCR:CD21-L, IL-4, and BAFF. A) Representative experiment in which CFSE-labeled cells were stained intracellularly for AID or p53 on d 4.5 after activation. Top panel: gating of CFSE-labeled cells for divisions. Bottom panel: PE fluorescence within division-gated cells stained for AID or p53 (dark lines) or respective isotype control (dotted lines). B) Pooled data from 6 experiments in which p53 and AID were simultaneously evaluated. Top panel: data are expressed as ratio mean fluorescence intensity (RMFI) = ratio of the MFI of p53 or AID stained cells vs. MFI of control stained cells. Bottom panel: RMFI values from each experiment were computed as percentage of the maximal RMFI observed within all assessed divisions.
Figure 2.
Figure 2.
B cells replicating in response to BCR:CD21-L, IL-4, and BAFF exhibit elevated levels of p53 mRNA. A) Semiquantitative RT-PCR analysis of p53 mRNA levels in resting B cells and activated d 4 cultures stimulated with BCR:CD21-L, IL-4, and BAFF. Values represent ratios of densitometric intensity in the p53 and β-actin bands B) qPCR assessment of p53 mRNA in resting B cells vs. d 4 blasts. ΔCt values for p53 were obtained by comparisons with β-actin. Values for fold difference (Δ) were obtained by comparing ΔCt values in activated cultures with the ΔCt values of B cells prior to activation. P value shows that the differences between Δ values in resting vs. activated cells in a total of 4 replicate experiments were of borderline significance, using a 2-tailed paired Student's t test. C) Undivided blasts and divided blasts within activated cultures were sorted on the basis of CFSE fluorescence. Left panel: representative experiment. Right panel: results for p53-specific q-RT-PCR of isolated RNA. Divided blasts express significantly more p53 mRNA than do undivided blasts within the same cultures (P=0.006; 2-tailed, paired Student's t test).
Figure 3.
Figure 3.
PGE2 augments p53 mRNA expression during TI clonal expansion. A) B-cell cultures activated with BCR:CD21-L, IL-4, and BAFF were pulsed with exogenous PGE2 (50 nM) or ethanol vehicle alone on d 4; mRNA was isolated at varying periods after the pulse. qPCR of cDNA was used to measure the levels of p53 mRNA in PGE2-pulsed and control cultures. Values for fold difference (Δ) were obtained by comparing ΔCt values in PGE2-pulsed cultures with the respective ΔCt values in vehicle-pulsed cultures at the same time point. Dotted line represents a value of Δ = 1 for each of the vehicle control cultures. Results are the mean ± se Δ fold difference in 3 separate experiments, where P represents significance of differences between Δ values in PGE2-pulsed vs. vehicle-pulsed cultures. B) Pooled results from a total of 6 experiments which evaluated p53 mRNA levels in cultures activated as in A with/without an 8 h pulse of PGE2 on d 4. C) Day 4 activated cultures of CFSE-labeled cells with or without pulse of exogenous PGE2 8 h earlier were harvested and sorted on the basis of their division status: undivided vs. divided (3–4 divisions). qPCR of cDNA with p53 and β-actin probes was used to monitor p53 mRNA levels, as in Fig. 2. Values for Δ in each sorted population were obtained by comparing ΔCt values in cells from PGE2-pulsed vs. unpulsed cultures. P values show that a pulse with PGE2 significantly augments p53 mRNA levels in the divided blasts (P=0.007) without affecting p53 levels in the undivided cells (P=0.51; 2-tailed, paired Student's t test).
Figure 4.
Figure 4.
Selective agonist for EP2, a PGE2 receptor up-regulated during division, promotes heightened p53 mRNA. A) EP2 receptor expression is preferentially elevated with replicating B lymphoblasts in cultures activated by BCR:CD21-L, IL-4, and BAFF. Expression of each of 4 PGE2 receptors on B cells was assessed with receptor-specific Abs, as described elsewhere (35). EP receptor density expressed as PE fluorescence; division number revealed by CFSE fluorescence. B) p53 mRNA-up-regulating effects of an EP2 receptor-specific agonist, butaprost. Levels of p53 mRNA in activated cultures exposed on d 4 to butaprost (or ethanol vehicle) were assessed at varying intervals after the pulse. qPCR fold Δ values from experiments with a common harvest interval following the pulse were pooled and expressed as means ± se. P values indicate that the level of p53 mRNA in butaprost-pulsed cultures is significantly different from that in control-pulsed cultures. C) Dose response of the p53 mRNA-up-regulating effects of butaprost (single experiment with all doses tested).
Figure 5.
Figure 5.
Inhibition of RNA polymerase down-regulates baseline p53 mRNA and blocks PGE2-promoted increases in p53 mRNA. B cells were activated with BCR:CD21-L, IL-4 and BAFF. After d 4 of culture, 1 set of replicate cultures received a pulse with 5 μM actinomycin D (42), while another set received vehicle alone. After a period of 15 min, a subset of each of the above were subsequently pulsed with PGE2 (50 nM) or vehicle alone and cultured for an additional 8 h. Cultures were harvested, RNA was isolated, cDNA was prepared, and levels of p53 transcript were assessed by qPCR. Mean ± se fold Δ values are shown as in Fig. 2, for a total of 4 experiments.
Figure 6.
Figure 6.
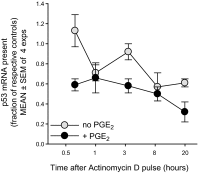
PGE2-promoted rise in p53 mRNA is not explained by PGE2-induced mRNA stabilization. In order to assess whether p53 mRNA stability was affected by a pulse of exogenous PGE2, sets of replicate cultures were pulsed with PGE2 (50 nM) or vehicle alone. After 8 h of additional culture (for peak PGE2-induced elevation in p53 mRNA; Fig. 3), a series of replicates within each of the above subsets received actinomycin C (5 μM) or DMSO vehicle. RNA was isolated at varying time points after the actinomycin D or DMSO (0.5, 1, 3, 8, and 20 h). q-PCR of cDNA measured p53 transcript levels in each culture, expressed as a fraction of that present in the respective PGE2-untreated or PGE2-treated cultures with DMSO vehicle (means±se of 4 experiments). Dotted line represents the normalized level of transcript present in cultures with or without PGE2 but without actinomycin D. Data were statistically analyzed (see Materials and Methods) to compare mean fold change of p53 mRNA between PGE2-pulsed and nonpulsed cultures to their respective controls across time after actinomycin D. There was no significant interaction between time and presence of PGE2 (P<0.72), indicating that the slope of p53 mRNA expression after actinomycin D (mRNA decay) was not significantly different with or without PGE2. Nevertheless, when the interaction term was removed from the model, the main effects of cell type and time were significant. Cells without PGE2 supplement had a significantly greater p53 mRNA, relative to their controls, as compared to those pulsed with PGE2 (P<0.0001). Overall, p53 mRNA expression decreased over time for all cells relative to controls (P<0.0002). Taken together, these experiments show that the elevated p53 mRNA levels in PGE2-prepulsed cultures do not reflect diminished degradation of the p53 transcript.
Figure 7.
Figure 7.
Single-cell RT-PCR shows that PGE2 augments the frequency of cells with detectable p53 mRNA. A) Single-cell RT-PCR was performed with sorted CFSE-labeled lymphoblasts (representing 3–4 divisions) from d 5 activated cultures (or d 6 for 1 experiment) with or without exogenous PGE2 (50 nM) on d 2 and 4. Shown are amplicons of β-actin and p53 from a total of 56 single cells analyzed from cultures with or without PGE2 supplement. While most wells with a single sorted cell were positive for β-actin mRNA, notably fewer were positive for p53 mRNA. B) Data from 6 separate experiments, each evaluating the frequency of p53 mRNA+ cells, as above. Below each set of bars, representing frequency of p53+ single cells within the sorted dividing population in cultures with or without PGE2, are the absolute values for number of p53 mRNA+ cells per total cells analyzed. (Note that in experiments T613, T612, T587, and T597, all cultures received a Z-VAD pulse on d 3.5 following activation; experiments T602 and T606 did not). C) Summarized data from the pooled experiments in B were subjected to statistical evaluation using a 2 × 2 contingency table and Fisher's exact test. The difference in frequency of p53 mRNA+ cells within sampled individual cells of cultures exposed/not exposed to exogenous PGE2 was highly significant (2-sided P<0.0001).
Figure 8.
Figure 8.
Divided progeny from PGE2-pulsed cultures manifested higher pH2AX staining (indicative of DNA double-strand breaks) when cultures were treated with pan-caspase inhibitor, Z-VAD. CFSE-labeled B cells were activated in 96-well plates (105 cells/200 μl), and activated cultures received PGE2 (50 nM), as indicated, on d 2 and 4 and 40 μM Z-VAD (or DMSO vehicle) on d 4. On d 5, cultures were harvested, fixed, and stained intracellularly with PE-anti-pH2AX (or PE-IgG control). PE MFI was determined for cells whose light scatter and CFSE fluorescence represented the viable, divided subset prior to fixation. A) Numbers represent the RMFI (ratio of pH2AX MFI/MFI IgG control MFI). B) Bars represent the ratio of the RMFI in PGE2-supplemented cultures/RMFI in nonsupplemented cultures of 2 experiments.
Figure 9.
Figure 9.
p53 mutations are present within dividing lymphoblasts of a TI response to BCR:CD21-L, IL-4, and BAFF with or withouth supplementary PGE2. A) p53 amplicons from experiments in Fig. 7 were sequenced (see Materials and Methods). Shown are sequenced segments with identified mutations from 8 distinct cells from 2 donors, as well as the corresponding germline p53 sequence (numerical positions represent residues of germline DNA beginning at the transcriptional start site). Transition mutations are in red; transversion mutations are in green. B) Segments of forward (FOR) and reverse (REV) p53 sequence chromatograms indicating the mutations detected per individual cell. Arrows indicate mutated residues. Asterisks indicate cells in which both the mutation (predominantly expressed) and the original wild-type sequence (minor) were coexpressed. Coexpression was validated by similar results on sequencing in either direction. C) Summarized data showing the percentage of total p53 sequence-positive single cells that expressed 1, 2, or 3 mutations/sequence. D) Normalized data from panel C, showing the percentage of total p53-mutated cells that expressed 1, 2, or 3 mutations/sequence. For both C and D, statistical power is too low to determine significance.

Similar articles

Cited by

References

    1. Lane D. P. (1992) Cancer p53, guardian of the genome. Nature 358, 15–16 - PubMed
    1. Phan R. T., Dalla-Favera R. (2004) The BCL6 proto-oncogene suppresses p53 expression in germinal-centre B cells. Nature 432, 635–639 - PubMed
    1. Huang C., Hatzi K., Melnick A. (2013) Lineage-specific functions of Bcl-6 in immunity and inflammation are mediated by distinct biochemical mechanisms. Nat. Immunol. 14, 380–388 - PMC - PubMed
    1. Bachl J., Carlson C., Gray-Schopfer V., Dessing M., Olsson C. (2001) Increased transcription levels induce higher mutation rates in a hypermutating cell line. J. Immunol. 166, 5051–5057 - PubMed
    1. Wright B. E., Schmidt K. H., Hunt A. T., Lodmell J. S., Minnick M. F., Reschke D. K. (2011) The roles of transcription and genotoxins underlying p53 mutagenesis in vivo. Carcinogenesis 32, 1559–1567 - PMC - PubMed

Publication types

MeSH terms

LinkOut - more resources