. 2013 Oct 22:3:3011.
doi: 10.1038/srep03011.

A functionally conserved Polycomb response element from mouse HoxD complex responds to heterochromatin factors

Affiliations

A functionally conserved Polycomb response element from mouse HoxD complex responds to heterochromatin factors

Dasari Vasanthi et al. Sci Rep. .

Abstract

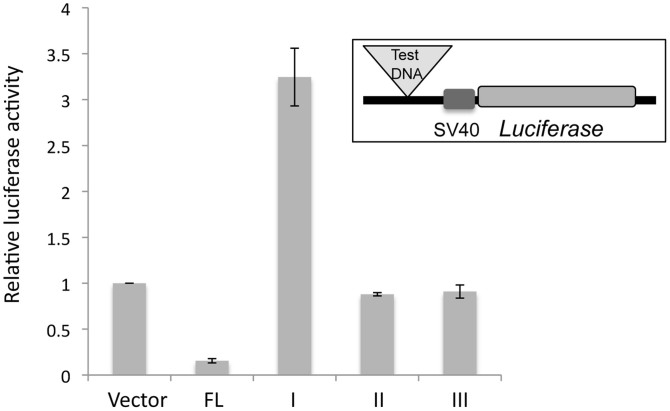
Anterior-posterior body axis in all bilaterians is determined by the Hox gene clusters that are activated in a spatio-temporal order. This expression pattern of Hox genes is established and maintained by regulatory mechanisms that involve higher order chromatin structure and Polycomb group (PcG) and trithorax group (trxG) proteins. We identified earlier a Polycomb response element (PRE) in the mouse HoxD complex that is functionally conserved in flies. We analyzed the molecular and genetic interactions of mouse PRE using Drosophila melanogaster and vertebrate cell culture as the model systems. We demonstrate that the repressive activity of this PRE depends on PcG/trxG genes as well as the heterochromatin components. Our findings indicate that a wide range of factors interact with the HoxD PRE that can contribute to establishing the expression pattern of homeotic genes in the complex early during development and maintain that pattern at subsequent stages.


Figures

Figure 1
Figure 1. Location of mouse repressor element in the mouse HoxD complex and the map of the pCaSpeR vector used in the study.
(A)Snap shot of UCSC genome browser from Evx2 gene to the much upstream region. Location of the repressor element is shown in black which shows that there is no conservation when compared to either Evx2 - Hoxd13 boundary region or to CR1, 2, 3 of HoxD complex. 5 kb repressor element is divided into three over lapping fragments called as I, II and III. The fragment III is near to the Evx2 gene. GA repeat is highlighted with gray bar. (B) All the three fragments and full length fragment were cloned in pCaSpeR construct, upstream region of mini white reporter gene. All the fragments were flanked by loxp sites. After excision with Cre recombinase, vector alone is present with one loxP site intact.
Figure 2
Figure 2. Repressor activity of mouse repressor element after flip out of the element from the transgenic lines.
The eye color of the representative male transgenic lines were shown that were imaged at the same age. The left eye of each box represents the transgene (P) and towards right represents its flip out version of FL, I, II and III fragments (ΔP). The graphs on the right side represents the red pigment value of male flies in homozygous condition of transgenes as well as flip out versions. Error bars represent standard deviation from three independent experiments.
Figure 3
Figure 3. Mouse repressor element represses luciferase activity in NIH3T3.
A) NIH3T3 cells were transected with different constructs that include empty vector and constructs carrying full length fragment and fragment I, II and III. Map of the vector used is shown in the inset. All the transfections were done along with β gal expressing vector. Relative luciferase activity of the mouse fragments is shown on the y axis. Error bars represent standard deviation from three independent experiments.
Figure 4
Figure 4. Effect of PcG/trxG mutations on mouse PRE.
(A) The graphs represent the red pigment values of male flies heterozygous for the transgene as well as the PcG mutations. (B) The graphs represent the red pigment values of male flies heterozygous for the transgene as well as the trxG mutations. The error bars represent standard deviation for three independent values.
Figure 5
Figure 5. Trl functions as an activator on mPRE.
Effect of Trl13c on the fragments were shown in heterozygous condition for the transgene and with Trl13c mutation in homozygous background. The graphs on the right side represent the red pigment values of male flies that were heterozygous for the transgene as well as with Trl13c mutation in homozygous background represented as a and b respectively. The error bars represent standard deviation for three independent values.
Figure 6
Figure 6. Effect of heterochromatin components on mouse PRE.
The male eye color of FL, I, II and III fragments in heterozygous condition was compared with Su(var)2-51, Su(var)3-96, P[Su(var)2-5] and P[Su(var)3-9] that are denoted as a, b, c and d respectively. The representative flies were imaged at the same age. The graphs on the right side represent the red pigment values of male flies heterozygous for the transgene as well as the mutations. The error bars represent standard deviation for three independent values.
Figure 7
Figure 7. Cumulative effect of multiple mutations on mPRE.
A) Heterozygous line of FL fragment represented as (P) is compared with the progeny of the cross (F) Su(var)2-51/Cyo with P3.111/Cyo; Su(var)3-96/TM2 males. Line 3.111, containing full length fragment doesn't show cumulative increase in eye color upon Su(var)2-51 and Su(var)3-96 mutations. The eye color remains same. B) Maternal component of Pc is important for setting up of repression on mPRE. Line 3.111/Cyo;Su(var)3-96/Tb males were crossed to virgins of Pc1/Tb. P/+ Su(var)3-96/Pc1 shows strong increase in eye color compared to P/+;Su(var)3-96/+ or P/+ line. C) Representative image to show cumulative increase in eye color upon two PcG mutations. 3.111/Cyo;Pc1/Tb virgins were crossed to males of Psc1/Cyo, P/Psc1;Pc1/+ eye color is greater than P/Psc1 which in turn is greater than P/+ line.
Figure 8
Figure 8. Binding profiles of PC and GAF and chromatin modifications at transgenic mouse PRE locus.
(A) Binding profiles of PC and GAF are shown as percent input. All the primer pairs are from the region itself. Primer pair a lies in the fragment I, b lies in fragment II and c lies in fragment III. Negative control primer pair (n) is from the endogenous white gene locus. light gray and dark gray and white bars represent GAF and PC occupancy respectively. IgG is indicated as white bar. (B) ChIP experiment with anti H3K27me3, anti H3K9me3 and anti H3K4me2 were shown. White, light gray, dark gray and black bars represent binding of IgG, H3K27me3, H3K9me3 and H3K4me2, respectively. Data are presented as the mean ± s.e.m. and derived from two independent experiments.*P < 0.05 (two-tailed Student's t-test).

References

    1. Lewis E. B. A gene complex controlling segmentation in Drosophila. Nature 276, 565–570 (1978). - PubMed
    1. Krumlauf R. Hox genes in vertebrate development. Cell 78, 191–201, 10.1016/0092-8674(94)90290-9 (1994). - PubMed
    1. Dolle P. & Duboule D. Two gene members of the murine HOX-5 complex show regional and cell-type specific expression in developing limbs and gonads. EMBO J 8, 1507–1515 (1989). - PMC - PubMed
    1. McGinnis W., Levine M. S., Hafen E., Kuroiwa A. & Gehring W. J. A conserved DNA sequence in homoeotic genes of the Drosophila Antennapedia and bithorax complexes. Nature 308, 428–433, 10.1038/308428a0 (1984). - PubMed
    1. McGinnis W., Hart C. P., Gehring W. J. & Ruddle F. H. Molecular cloning and chromosome mapping of a mouse DNA sequence homologous to homeotic genes of Drosophila. Cell 38, 675–680, 10.1016/0092-8674(84)90262-9 (1984). - PubMed

Publication types

MeSH terms