. 2007;122(1):73-117.
doi: 10.1162/qjec.121.1.73.

Disease and Development: Evidence from Hookworm Eradication in the American South

Affiliations

Disease and Development: Evidence from Hookworm Eradication in the American South

Hoyt Bleakley. Q J Econ. 2007.

Abstract

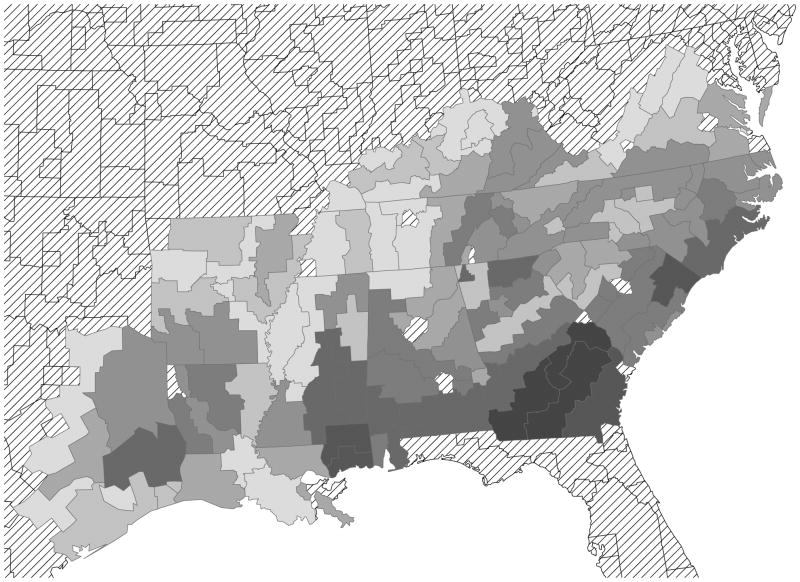
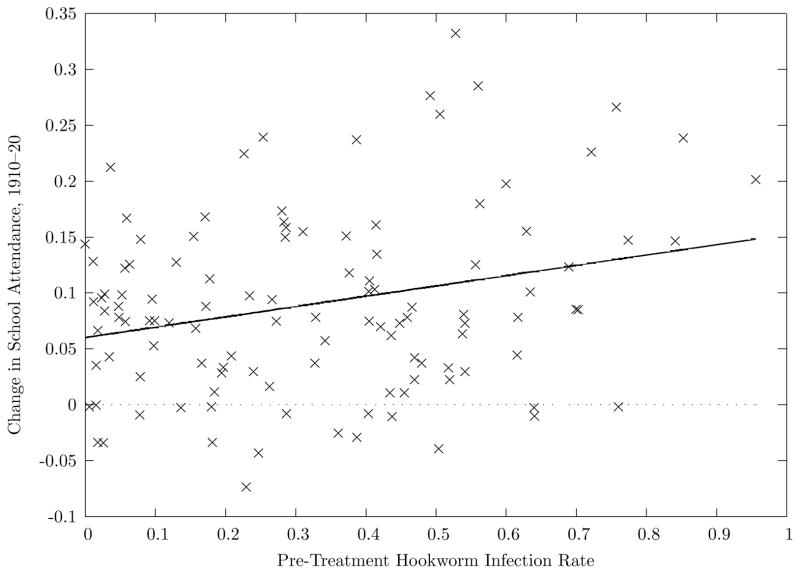
This study evaluates the economic consequences of the successful eradication of hookworm disease from the American South. The hookworm-eradication campaign (c. 1910) began soon after (i) the discovery that a variety of health problems among Southerners could be attributed to the disease and (ii) the donation by John D. Rockefeller of a substantial sum to the effort. The Rockefeller Sanitary Commission (RSC) surveyed infection rates in the affected areas (eleven southern states) and found that an average of forty percent of school-aged children were infected with hookworm. The RSC then sponsored treatment and education campaigns across the region. Follow-up studies indicate that this campaign substantially reduced hookworm disease almost immediately. The sudden introduction of this treatment combines with the cross-area differences in pre-treatment infection rates to form the basis of the identification strategy. Areas with higher levels of hookworm infection prior to the RSC experienced greater increases in school enrollment, attendance, and literacy after the intervention. This result is robust to controlling for a variety of alternative factors, including differential trends across areas, changing crop prices, shifts in certain educational and health policies, and the effect of malaria eradication. No significant contemporaneous results are found for adults, who should have benefited less from the intervention owing to their substantially lower (prior) infection rates. A long-term follow-up of affected cohorts indicates a substantial gain in income that coincided with exposure to hookworm eradication. I also find evidence that eradication increased the return to schooling.

Keywords: American South; Rockefeller Sanitary Commission; hookworm; tropical disease.


Figures

None
Notes: This map displays the rate of hookworm infection among children by county groups across the Southern United States. Darker shades of gray indicate higher infection rates. Diagonal hatching indicates that no data are available for those areas. The infection rates are drawn from various annual reports of the Rockefeller Sanitary Commission, and the map/boundary data are from Earle, Otterstrom and Heppen (1999). The county groups, known as State Economic Areas (SEAs), are described in Bogue (1951).
None
These graphs report additional summary statistics by year of birth for the β̂t reported in Figure V in the subplot labelled “Occupational Income Score; Full controls”.
Figure I
Figure I
Highly Infected Areas Saw Greater Declines in Hookworm Notes: The y axis displays the decrease in hookworm infection post-intervention, as measured by follow-up surveys. The x axis is the pre-treatment hookworm infection rate, as measured by the Rockefeller Sanitary Commission. Panel A displays data at the state level, as reported by Jacocks (1924). Panel B contains data from counties in Alabama, as reported by Havens and Castles (1930). Both resurveys are from the early 1920s. The average number of children examined per county exceeds 450 in both studies.
Figure II
Figure II
Highly Infected Areas Saw Greater Increases in School Attendance Notes: The y axis displays the 1910–20 change in school-attendance rates, based on author’s calculations from the IPUMS microdata. The x axis is the pre-treatment hookworm infection rate, as measured by the Rockefeller Sanitary Commission. The unit of observation is the State Economic Area (SEA), an aggregation that contains on average six counties. The school data are averages from a sample consisting of all native-born white and black children in the IPUMS between the ages of 8 and 16 in the RSC-surveyed geographic units for 1910 and 1920. Each SEA’s change is marked with a × symbol. The solid line plots the fitted values from a bivariate regression (weighted by cell size), which has an 2 of 0.083 and a coefficient (standard error) of Δ school attendance on infection of 0.092 (0.029).
Figure III
Figure III
Hookworm Eradication and School Attendance, 1870–1950 Notes: The y axis plots the year-specific coefficients on the circa 1913 hookworm-infection rate (solid line), plus the 95%-confidence intervals (dashed lines). The x axis is the Census year. The sample consists of all native-born white and black children in the IPUMS between the ages of 8 and 16 in the RSC-surveyed geographic units for 1870, 1880, 1900, 1910, 1920, 1940, and 1950. For each year, the coefficients are estimated in a regression of a school-attendance dummy on pre-intervention hookworm infection and demographic controls. Confidence intervals are constructed using standard errors that are clustered on SEA.
Figure IV
Figure IV
Comparison of Fully Exposed versus Unexposed Cohorts, by State of Birth Notes: The x axis is the state’s hookworm-infection rate, as measured by Kofoid and Tucker (1921). The y axis is the state-level change in the natural log of 1939 wage and salary earnings across cohorts fully exposed and unexposed to the RSC. Unexposed cohorts are those older than age 20 in 1913, while fully exposed cohorts are those born after 1913. The earnings data are averages by state of birth and by cohort and were constructed using a base sample consisting of native-born blacks and whites in the age range [25,60] and in the 1940 IPUMS database. States with cell sizes of less than 20 are excluded from the graph. Each state’s change is marked with a × symbol, except for the states specifically labeled. The mean difference among low-hookworm states (infection< .01) is subtracted from the wage data before plotting. The solid line plots the fitted values from a bivariate regression, which has an 2 of 0.297.
Figure V
Figure V
Cohort-Specific Relationship Between Income and Pre-Eradication Hookworm Notes: These graphics summarize regressions of income proxies on pre-eradication hookworm-infection rates (measured by Kofoid and Tucker, 1921). The y axis for each graphic plots the estimated cohort-specific coefficients on the state-level hookworm measure. The x axis is the cohort’s year of birth. Each cohort’s point estimate is marked with a dot. The dashed lines measure the number of years of potential childhood exposure to the Rockefeller Sanitary Commision’s activities. For the underlying regressions, the dependent variables are constructed from the indicated income proxies (the Duncan Socioeconomic Indicator and the Occupational Income Score). The base sample consists of native-born males in the IPUMS and NAPP datasets between the ages of 25 and 55, inclusive, for the census years 1880–1990, which results in year-of-birth cohorts from 1825 to 1965. The individual income proxies are projected on to dummies for year-of-birth × Census year observed (cohorts can appear up to four times in this design), and the residuals are averaged by year of birth and state of birth. For each year-of-birth cohort, OLS regressions coefficients are estimated on the resulting cross section of states of birth. In the basic specification, this state-of-birth average residual is regressed on to hookworm infection, Lebergott’s measure of 1899 wage levels, and a dummy for the Southern region. The“full controls” specification contains, in addition, the various control variables from Table IX, Panel B.

References

    1. Acemoglu Daron, Angrist Joshua. How Large Are Human-Capital Externalities? Evidence from Compulsory Schooling Laws. In: Bernanke BS, Rogoff K, editors. NBER Macroeconomics Annual. Cambridge, MA: NBER MIT Press; 2000. p. 958.
    1. Acemoglu Daron, Johnson Simon, Robinson James A. The Colonial Origins of Comparative Development: An Empirical Investigation. American Economic Review. 2001;91:1369–401.
    1. Augustine Donald L, Smillie Wilson G. The Relation of the Type of Soils of Alabama to the Distribution of Hookworm Disease. American Journal of Hygiene. 1926;6:36–62.
    1. Barro Robert J, Sala-i-Martin Xavier. Economic Growth. Cambridge, MA: The MIT Press; 1999.
    1. Bleakley C Hoyt. Mimeo. Massachusetts Institute of Technology; May, 2002. Malaria and Human Capital: Evidence from the American South.

References for Data Appendix

    1. Bogue Donald J. State economic areas; a description of the procedure used in making a functional grouping of the counties of the United States. Washington, DC: U.S. Government Printing Office; 1951.
    1. Bowen Albert S. Activities Concerning Mobilization Camps and Ports of Embarkation. IV. Washington, DC: U.S. Government Printing Office; 1928. Prepared under the direction of The Surgeon General, M. W. Ireland.
    1. Department of Education of the State of Alabama. Annual Report. Montgomery, AL: State of Alabama; 1905–1925.
    1. Department of Education of the State of Georgia. . Annual Report. Atlanta, GA: State of Georgia; 1905–1925.
    1. Inter-university Consortium for Political and Social Research. Computer file. Ann Arbor, MI: Inter-university Consortium for Political and Social Research (ICPSR); 1984. [Accessed Sept. 20, 2002]. Historical, Demographic, Economic, and Social Data: the United States, 1790–1970. http://www.icpsr.org/