. 2013;9(10):e1003886.
doi: 10.1371/journal.pgen.1003886. Epub 2013 Oct 17.

Hsp70-Hsp40 chaperone complex functions in controlling polarized growth by repressing Hsf1-driven heat stress-associated transcription

Affiliations

Hsp70-Hsp40 chaperone complex functions in controlling polarized growth by repressing Hsf1-driven heat stress-associated transcription

Aleksandar Vjestica et al. PLoS Genet. 2013.

Abstract

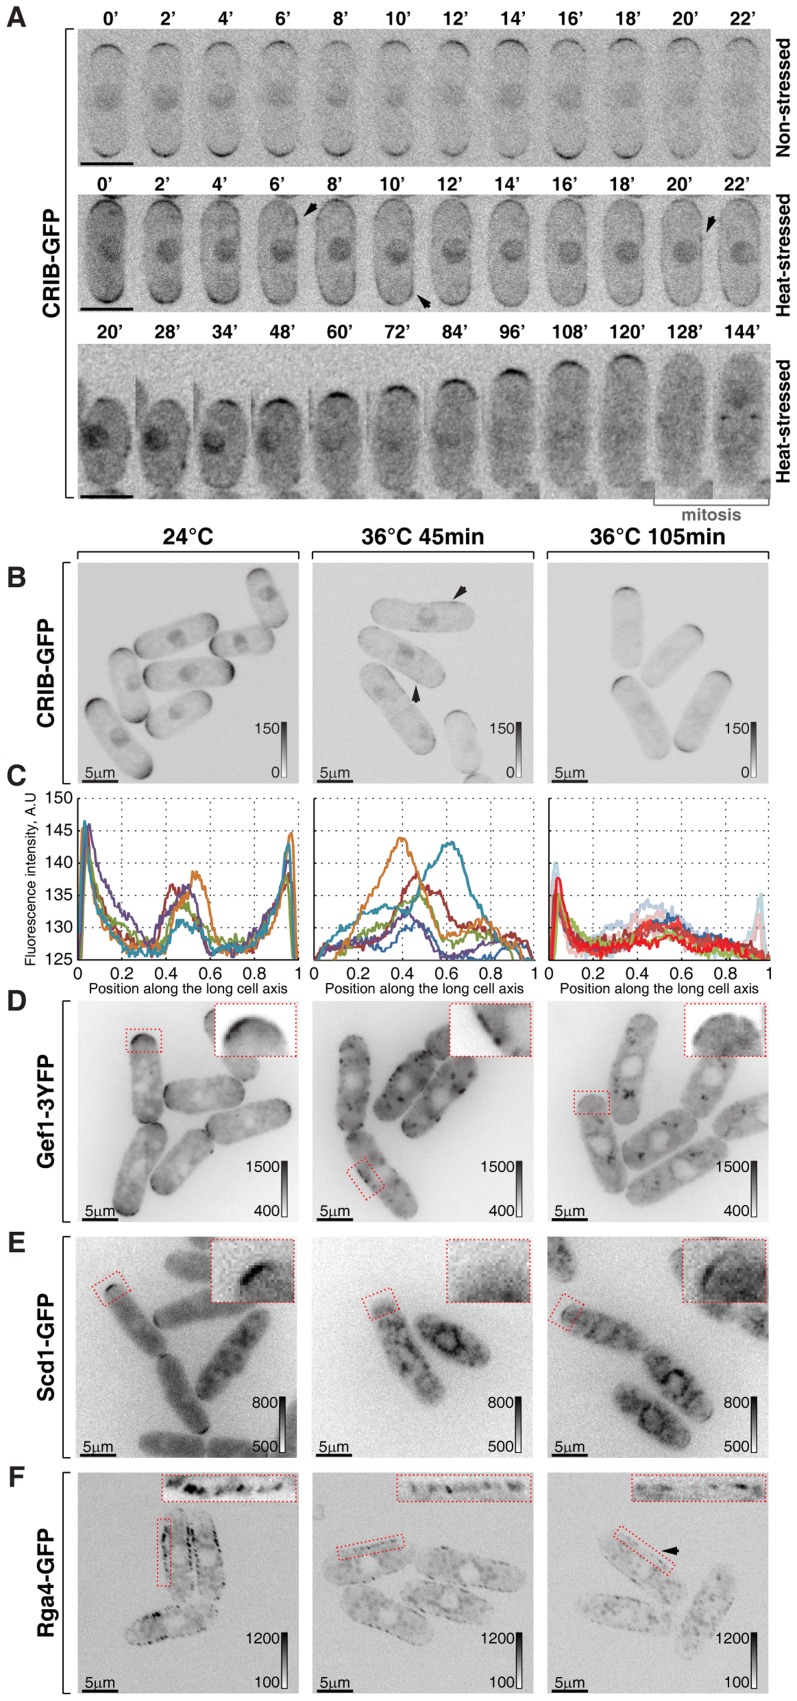
How the molecular mechanisms of stress response are integrated at the cellular level remains obscure. Here we show that the cellular polarity machinery in the fission yeast Schizosaccharomyces pombe undergoes dynamic adaptation to thermal stress resulting in a period of decreased Cdc42 activity and altered, monopolar growth. Cells where the heat stress-associated transcription was genetically upregulated exhibit similar growth patterning in the absence of temperature insults. We identify the Ssa2-Mas5/Hsp70-Hsp40 chaperone complex as repressor of the heat shock transcription factor Hsf1. Cells lacking this chaperone activity constitutively activate the heat-stress-associated transcriptional program. Interestingly, they also exhibit intermittent monopolar growth within a physiological temperature range and are unable to adapt to heat stress. We propose that by negatively regulating the heat stress-associated transcription, the Ssa2-Mas5 chaperone system could optimize cellular growth under different temperature regiments.


Conflict of interest statement

The authors have declared that no competing interests exist.

Figures

Figure 1
Figure 1. Heat-stress induces transient longitudinal growth arrest succeeded by monopolar growth.
(A) Schematic of fission yeast cell cycle and (B) key regulators of cell growth and polarity. (C) Shown are single z-plane epifluorescence micrographs of FITC-Lectin stained cells grown at indicated temperatures and imaged immediately (left panel), 60 min (middle panels) and 150 min upon dye washout (right panels). (D) Quantification of longitudinal cell growth of cells represented in (C). Presented are box plots with standard deviation for cells grown at 24°C (gray) or shifted to 36°C (blue) for indicated time points; n>25 per sample per time point, p-values derived by Welch's test. (E) Cell width in cells grown at 24°C (gray) or shifted to 36°C for 60 min (blue). (F) Percentage of monopolar late G2 phase cells in a cell suspensions treated as described in (C), n>250 per sample. (G–J) Shown are whole cell maximum intensity z-projections of confocal micrographs of log-phase wild type cells expressing indicated fluorophore tagged marker proteins grown at 24°C (left panels) or shifted to 36°C for 45 min (middle panels) or 105 min (right panels). The arrows point out localization of the marker proteins to lateral cell cortex. Inset represents a zoom-in of the indicated region. Image contrast is reported using corresponding gray wedges. Scale bars, 5 µm.
Figure 2
Figure 2. Cortical association of GTP-bound Cdc42 and its GEFs and GAP is modulated by temperature.
(A) Single z-plane spinning disk confocal microscopy time-lapse images of CRIB-GFP expressing wild type cells grown at room temperature (top panel) or shifted to 36°C for the indicated period of time (middle and bottom panels). Spreading of CRIB-GFP signal immediately following heat stress (middle panel) is indicated by arrowheads. A heat-stressed cell shown in the bottom panel repolarizes CRIB-GFP to one cell tip and eventually enters mitosis. (B) Shown are whole cell maximum intensity z-projections of scanning confocal micrographs of log-phase wild type cells expressing CRIB-GFP grown at 24°C (left panels) or shifted to 36°C for 45 min (middle panels) or 105 min (right panels). The arrows point out localization of the marker protein to lateral cell cortex. (C) Quantification of CRIB-GFP intensities along the long cell axis in log-phase wild type cells grown under indicated temperature regiments. Individual lines correspond to individual cells. Low opacity lines refer to heat-stressed cells from the subpopulation exhibiting bipolar CRIB-GFP localization after 105 min at 36°C. (D–F) Shown are single z-plane micrographs of log-phase wild type cells expressing indicated fluorophore-tagged Cdc42 regulators grown at 24°C (left panels) or shifted to 36°C for 45 min (middle panels) or 105 min (right panels). The insets represent zoomed-in and re-contrasted main image segments outlined in red dotted line. Image contrast is reported using corresponding gray wedges. Scale bars, 5 µm.
Figure 3
Figure 3. Hsf1-mediated transcription regulates growth patterning in fission yeast.
(A) GFP reporter expression is driven by hsp104 promoter in cells where Hsf1 ORF is under the control of either wild type or nmt1 promoter grown to log phase in minimal medium without thiamine. Shown are pseudocolored average intensity whole cell z-projections of epifluorescence image stacks. Image contrast is reported using corresponding color wedges. (B) Single z-plane images of calcofluor stained wild type and cells with Hsf1 over-expression driven by nmt1 promoter induced for 20 hours by removal of thiamine. Arrowheads point to birth-scars; the new-cell-end length was determined as a distance from the birth-scar to the proximal cell tip. (C) New-cell-end length as a function of cell length for wild type (gray) and cells over-expressing Hsf1 from the thiamine responsive nmt1 promoter (magenta). Dots represent individual late G2 phase cells and lines represent linear regressions for cells analyzed (n>30). p-values were obtained through ANCOVA analysis. (D) Shown are whole cell maximum intensity z-projections of scanning confocal micrographs of nmt1::hsf1 cells expressing CRIB-GFP and grown in the presence (left panel) or absence (right panel) of thiamine. (E) Quantification of CRIB-GFP intensities along the long cell axis in log-phase cells grown under conditions described in (D). Gray wedges report image contrasting. Scale bars, 5 µm.
Figure 4
Figure 4. Screening for chaperone mutant cells with elevated levels of heat stress-associated transcription.
(A) Fission yeast strains lacking indicated non-essential nucleocytoplasmic Hsp40 proteins were streaked out onto YES plates containing phloxine B and grown at 24°C or 36°C. Arrowheads points to the strain lacking DnaJ chaperone Mas5. (B) Survival rate upon extreme heat-shock (50°C for 15 min) of wild type cells (WT), wild type cells pre-exposed to mild heat stress (WT*) and cells lacking individual SSA subfamily chaperones or indicated non-essential nucleocytoplasmic Hsp40 proteins. The inset outlines the screening strategy used to identify strains with elevated levels of heat-stress associated transcription: cells were grown to log-phase at 24°C and aliquots were either allowed to continue growth at 24°C (gray line) or shifted to 50°C for 15 min (green line). An additional sample of wild type cells was shifted to 36°C for 45 min before being transferred to 50°C for 15 min (purple line). Number of colony forming units was measured for each sample and used to calculate survival rates. (C) Dilution spotting assay of wild type cells (WT), wild type cells pre-exposed to mild heat-stress (WT*) and cells lacking Mas5 or Ssa2 grown at 24°C (left panels) and exposed to 50°C for 15 min prior to plating (right panels). (D) Lysates prepared from cells with indicated genotypes were incubated with anti-myc antibodies and subsequently with beads coupled to Protein-G. Proteins that remained associated with the beads after multiple buffer washes were resolved by SDS-PAGE and prepared for Western Blotting with anti-myc and anti-GFP antibodies. (E) Pseudocolored average z-projection epifluorescence images of the GFP under the regulation of hsp104 regulatory elements in wild type, ssa1Δ, ssa2Δ and mas5Δ cells grown in indicated conditions. Image contrast is reported using corresponding color wedges. Scale bars, 5 µm. Top right panel histogram quantifies the fluorescence signal in indicated strains.
Figure 5
Figure 5. Cells with impaired Ssa2p•Mas5 complex have decreased cortical Cdc42 activity and exhibit monopolar intermittent growth pattern.
(A) Single z-plane images of calcofluor stained log-phase cells with indicated genotypes. Arrows point to birth-scars. (B) New-cell-end length as a function of cell length for cells with indicated genotypes. Points represent individual cells, lines represent the linear regression of a sample and p-values were obtained through ANCOVA. (C) Kymographs of bright-field microscopy time-lapse analyses of cells with the indicated genetic backgrounds grown in a perfusion chamber at room temperature. Arrowheads point to growth pauses characteristic to ssa2Δ and mas5Δ cells. (D) Shown are whole cell maximum intensity z-projections of scanning confocal micrographs of log-phase cells with indicated genotypes expressing CRIB-GFP, arrowheads point to cell tips lacking Cdc42 activity. (E) Quantification of CRIB-GFP intensities along the long cell axis in log-phase wild type (left panel), mas5Δ (middle panel) and ssa2Δ cells (right panels). Individual lines correspond to individual cells. (F) Kymographs of single z-plane spinning disk confocal microscopy time-lapse of wild type (left panel), mas5Δ (middle panel) and ssa2Δ cells (right panels) grown at room temperature. Arrows point to intermittent Cdc42 activity bursts associated with longitudinal growth seen in mas5Δ and ssa2Δ cells. (G) Single z-plane images of calcofluor stained log-phase cells with indicated genotypes grown in minimal medium in the presence or absence of thiamine for 30 hours and shifted to YE medium for 7 hours prior to fixation and staining. Arrows point to birth-scars. (H) New-cell-end length as a function of total cell length for cells presented in (G). Points represent individual cells, lines represent the linear regression of a sample and p-values were obtained through ANCOVA. (I) Kymographs of bright-field microscopy time-lapse analyses of cells with the indicated genetic backgrounds grown in a perfusion chamber at room temperature. Blue arrowheads point to growth pauses and a magenta arrowhead indicates onset of bipolar growth. Scale bars, 5 µm.
Figure 6
Figure 6. Cells with impaired function of the Ssa2p•Mas5 chaperone complex exhibit elevated levels of heat-stress associated transcription.
(A) Top panel represents correlation analysis between gene expression profiles of mas5Δ (in blue) or ssa2Δ (in magenta) cells and wild type cells exposed to heat stress. Individual dots represent individual genes. Pearson's correlation coefficients and statistical significance are indicated. Venn diagrams (bottom panel) analyze the overlap in >2-fold differentially regulated genes between mas5Δ (in blue), ssa2Δ (in magenta) cells and heat-stressed wild type cells (in gray). (B) Comparison between gene expression profiles of mas5Δ, ssa2Δ and wild type cells under indicated environmental stresses; gene clustering presented on the left. (C) Expression profiles of genes specifically upregulated by distinct environmental stresses in mas5Δ and ssa2Δ cells and wild type cells under indicated environmental stresses. (D) Analysis of expression of common environmental stress response genes in exponentially growing mas5Δ and ssa2Δ cells, and sty1Δ, atf1Δ and wild type cells under indicated conditions. (E) Left panel shows the comparison between gene expression profiles of wild type heat-stressed cells, mas5Δ, ssa2Δ and cells overexpressing Hsf1, as detected by RNAseq analysis. Venn diagrams (right panel) analyze the overlap in >2-fold differentially regulated genes between mas5Δ (in blue), ssa2Δ (in magenta) cells, heat-stressed wild type cells (in gray) and cells overexpressing Hsf1 (in green).
Figure 7
Figure 7. Repression of Hsf1 expression in mas5Δ cells rescues the growth patterning defects.
(A) Hsp104-GFP expressing wild type and mas5Δ cells where Hsf1 expression was under the regulation of the native or inducible purg1 promoter were grown in minimal medium lacking uracil for 36 hours at 24°C. Shown are pseudocolored epifluorescence images. Image contrast is reported using color wedges. Scale bars, 5 µm. (B) Quantification of GFP fluorescence in cells presented in (A). (C) Single z-plane images of calcofluor stained log-phase cells with indicated genotypes grown as described in (A). Arrowheads point to birth-scars. (D) New-cell-end length as a function of total cell length for cells with indicated genotypes. Points represent individual cells, lines represent the linear regression of a sample and the p-value was obtained through ANCOVA. (E) Kymographs of bright-field microscopy time-lapse analyses of cells with the indicated genetic backgrounds grown in a perfusion chamber at room temperature. Blue arrowheads point to growth pauses and a magenta arrowhead indicates onset of bipolar growth.

References

    1. Richter K, Haslbeck M, Buchner J (2010) The heat shock response: life on the verge of death. Mol Cell 40: 253–266. - PubMed
    1. Ashburner M (1970) Patterns of puffing activity in the salivary gland chromosomes of Drosophila. V. Responses to environmental treatments. Chromosoma 31: 356–376. - PubMed
    1. Ashburner M, Bonner JJ (1979) The induction of gene activity in drosophilia by heat shock. Cell 17: 241–254. - PubMed
    1. Tissieres A, Mitchell HK, Tracy UM (1974) Protein synthesis in salivary glands of Drosophila melanogaster: relation to chromosome puffs. J Mol Biol 84: 389–398. - PubMed
    1. Eisen MB, Spellman PT, Brown PO, Botstein D (1998) Cluster analysis and display of genome-wide expression patterns. Proc Natl Acad Sci U S A 95: 14863–14868. - PMC - PubMed

Publication types

MeSH terms

Associated data