Using molecular markers to characterize productivity in Chinese hamster ovary cell lines
- PMID: 24146795
- PMCID: PMC3798306
- DOI: 10.1371/journal.pone.0075935
Using molecular markers to characterize productivity in Chinese hamster ovary cell lines
Abstract
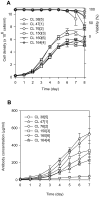
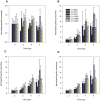
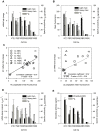
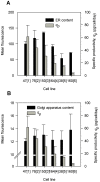
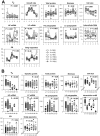
Selection of high producing cell lines to produce maximum product concentration is a challenging and time consuming task for the biopharmaceutical industry. The identification of early markers to predict high productivity will significantly reduce the time required for new cell line development. This study identifies candidate determinants of high productivity by profiling the molecular and morphological characteristics of a panel of six Chinese Hamster Ovary (CHO) stable cell lines with varying recombinant monoclonal antibody productivity levels ranging between 2 and 50 pg/cell/day. We examined the correlation between molecular parameters and specific productivity (qp ) throughout the growth phase of batch cultures. Results were statistically analyzed using Pearson correlation coefficient. Our study revealed that, overall, heavy chain (HC) mRNA had the strongest association with qp followed by light chain (LC) mRNA, HC intracellular polypeptides, and intracellular antibodies. A significant correlation was also obtained between qp and the following molecular markers: growth rate, biomass, endoplasmic reticulum, and LC polypeptides. However, in these cases, the correlation was not observed at all-time points throughout the growth phase. The repeated sampling throughout culture duration had enabled more accurate predictions of productivity in comparison to performing a single-point measurement. Since the correlation varied from day to day during batch cultivation, single-point measurement was of limited use in making a reliable prediction.
Conflict of interest statement
Figures

Similar articles
-
Efficient folding/assembly in Chinese hamster ovary cells is critical for high quality (low aggregate content) of secreted trastuzumab as well as for high production: stepwise multivariate regression analyses.J Biosci Bioeng. 2014 Aug;118(2):223-30. doi: 10.1016/j.jbiosc.2014.01.013. Epub 2014 Mar 11. J Biosci Bioeng. 2014. PMID: 24635945
-
On the optimal ratio of heavy to light chain genes for efficient recombinant antibody production by CHO cells.Biotechnol Prog. 2005 Jan-Feb;21(1):122-33. doi: 10.1021/bp049780w. Biotechnol Prog. 2005. PMID: 15903249
-
Low-concentration staurosporine improves recombinant antibody productivity in Chinese hamster ovary cells without inducing cell death.J Biosci Bioeng. 2020 Nov;130(5):525-532. doi: 10.1016/j.jbiosc.2020.07.005. Epub 2020 Aug 12. J Biosci Bioeng. 2020. PMID: 32800439
-
Cleavage efficient 2A peptides for high level monoclonal antibody expression in CHO cells.MAbs. 2015;7(2):403-12. doi: 10.1080/19420862.2015.1008351. MAbs. 2015. PMID: 25621616 Free PMC article.
-
Sequential screening by ClonePix FL and intracellular staining facilitate isolation of high producer cell lines for monoclonal antibody manufacturing.J Immunol Methods. 2017 Dec;451:100-110. doi: 10.1016/j.jim.2017.08.012. Epub 2017 Sep 8. J Immunol Methods. 2017. PMID: 28890364
Cited by
-
An efficient protein production system via gene amplification on a human artificial chromosome and the chromosome transfer to CHO cells.Sci Rep. 2019 Nov 18;9(1):16954. doi: 10.1038/s41598-019-53116-2. Sci Rep. 2019. PMID: 31740706 Free PMC article.
-
Enhancing antibody folding and secretion by tailoring the Saccharomyces cerevisiae endoplasmic reticulum.Microb Cell Fact. 2016 May 23;15:87. doi: 10.1186/s12934-016-0488-5. Microb Cell Fact. 2016. PMID: 27216259 Free PMC article.
-
Monitoring cell productivity for the production of recombinant proteins by flow cytometry: An effective application using the cold capture assay.Eng Life Sci. 2021 Jan 6;21(5):288-293. doi: 10.1002/elsc.202000049. eCollection 2021 May. Eng Life Sci. 2021. PMID: 33976601 Free PMC article.
-
Screening and selection strategy for the establishment of biosimilar to trastuzumab-expressing CHO-K1 cell lines.AMB Express. 2021 Jan 3;11(1):1. doi: 10.1186/s13568-020-01157-6. AMB Express. 2021. PMID: 33389203 Free PMC article.
-
Compartmentalized Proteomic Profiling Outlines the Crucial Role of the Classical Secretory Pathway during Recombinant Protein Production in Chinese Hamster Ovary Cells.ACS Omega. 2021 May 3;6(19):12439-12458. doi: 10.1021/acsomega.0c06030. eCollection 2021 May 18. ACS Omega. 2021. PMID: 34056395 Free PMC article.
References
-
- Wurm FM (2004) Production of recombinant protein therapeutics in cultivated mammalian cells. Nature Biotechnology 22: 1393–1398. - PubMed
-
- Walsh G (2003) Biopharmaceutical benchmarks 2003. Nat Biotechnol 21: 865–870. - PubMed
-
- Walsh G (2006) Biopharmaceutical benchmarks 2006. Nat Biotechnol 24: 769–776. - PubMed
-
- Kingston RE, Kaufman RJ, Bebbington CR, Rolfe MR (2001) Amplification Using CHO Cell Expression Vectors. Current Protocols in Molecular Biology: John Wiley & Sons, Inc. - PubMed
-
- Kim S, Lee GM (1999) Cytogenetic analysis of chimeric antibody-producing CHO cells in the course of dihydrofolate reductase-mediated gene amplification and their stability in the absence of selective pressure. Biotechnology and Bioengineering 64: 741–749. - PubMed
Publication types
MeSH terms
Substances
LinkOut - more resources
Full Text Sources
Other Literature Sources

