

Analysis of the effects of polymorphism on pollen profilin structural functionality and the generation of conformational, T- and B-cell epitopes
- PMID: 24146818
- PMCID: PMC3798325
- DOI: 10.1371/journal.pone.0076066
Analysis of the effects of polymorphism on pollen profilin structural functionality and the generation of conformational, T- and B-cell epitopes
Erratum in
- PLoS One. 2014;9(1). doi:10.1371/annotation/3008c3af-753f-4085-b85e-5ae0c34a7889
Abstract
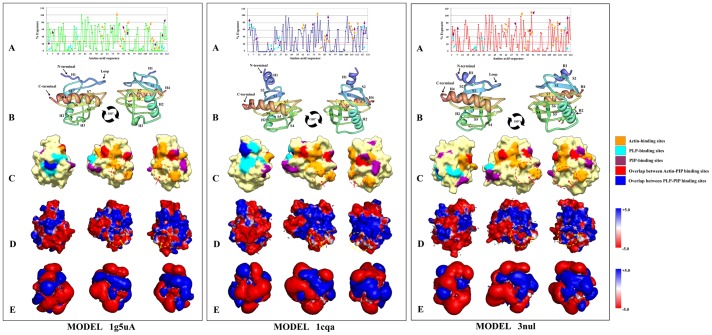
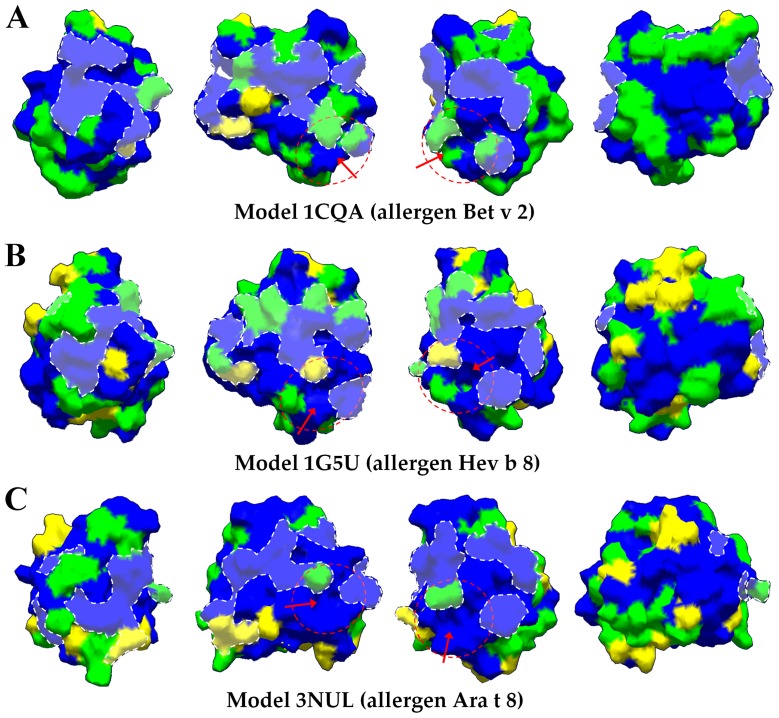
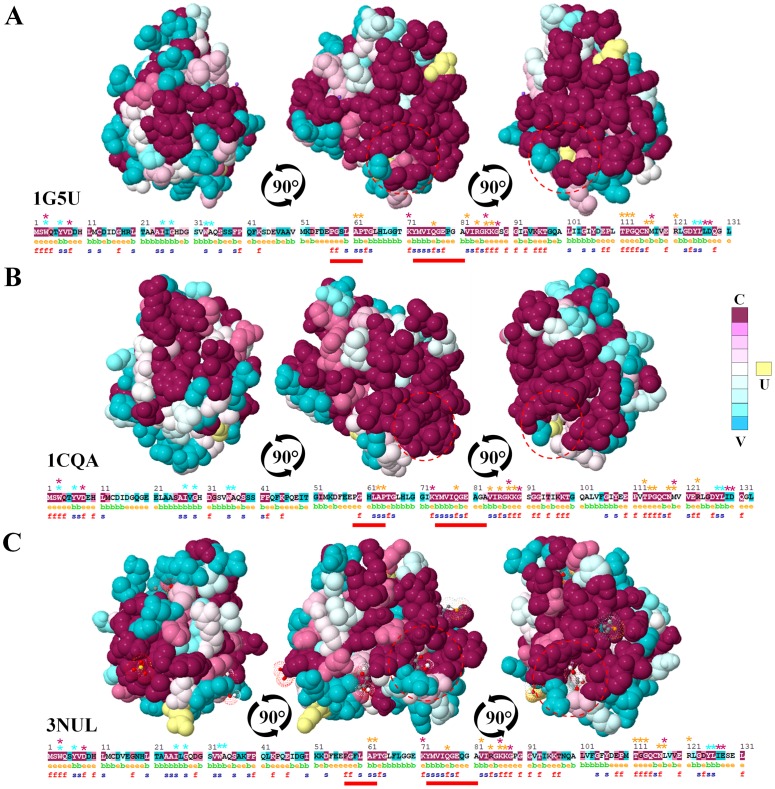
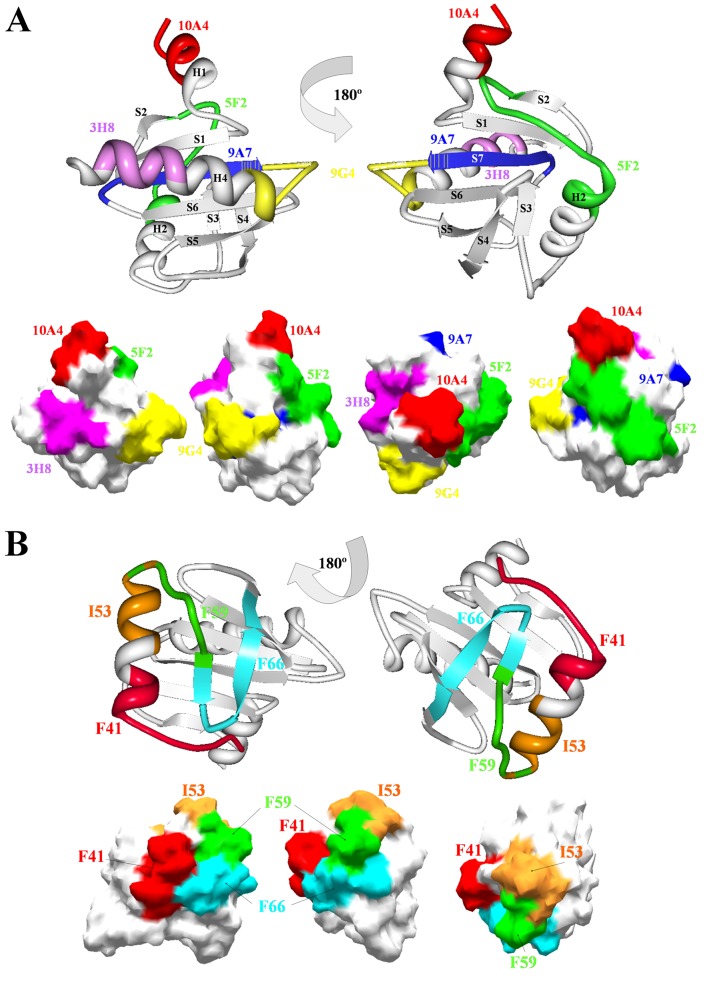
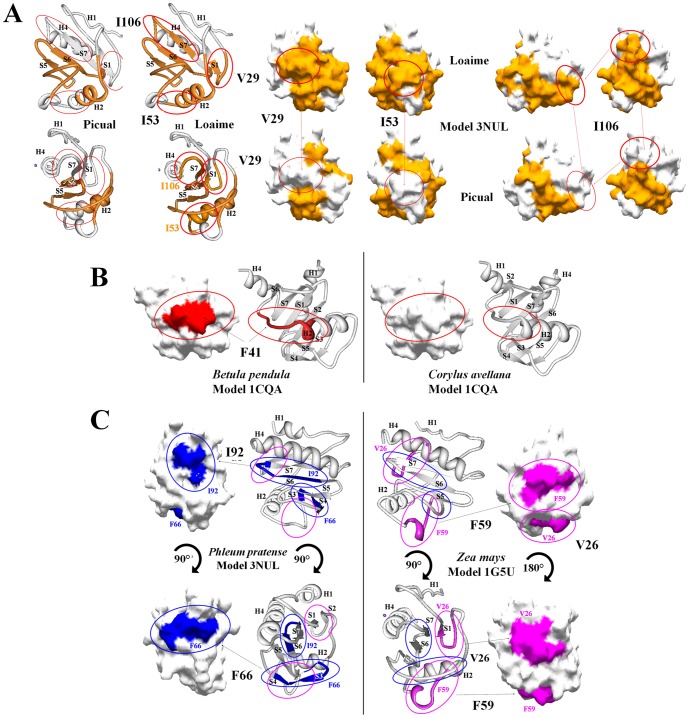
An extensive polymorphism analysis of pollen profilin, a fundamental regulator of the actin cytoskeleton dynamics, has been performed with a major focus in 3D-folding maintenance, changes in the 2-D structural elements, surface residues involved in ligands-profilin interactions and functionality, and the generation of conformational and lineal B- and T-cell epitopes variability. Our results revealed that while the general fold is conserved among profilins, substantial structural differences were found, particularly affecting the special distribution and length of different 2-D structural elements (i.e. cysteine residues), characteristic loops and coils, and numerous micro-heterogeneities present in fundamental residues directly involved in the interacting motifs, and to some extension these residues nearby to the ligand-interacting areas. Differential changes as result of polymorphism might contribute to generate functional variability among the plethora of profilin isoforms present in the olive pollen from different genetic background (olive cultivars), and between plant species, since biochemical interacting properties and binding affinities to natural ligands may be affected, particularly the interactions with different actin isoforms and phosphoinositides lipids species. Furthermore, conspicuous variability in lineal and conformational epitopes was found between profilins belonging to the same olive cultivar, and among different cultivars as direct implication of sequences polymorphism. The variability of the residues taking part of IgE-binding epitopes might be the final responsible of the differences in cross-reactivity among olive pollen cultivars, among pollen and plant-derived food allergens, as well as between distantly related pollen species, leading to a variable range of allergy reactions among atopic patients. Identification and analysis of commonly shared and specific epitopes in profilin isoforms is essential to gain knowledge about the interacting surface of these epitopes, and for a better understanding of immune responses, helping design and development of rational and effective immunotherapy strategies for the treatment of allergy diseases.
Conflict of interest statement
Figures
Similar articles
-
Characterization of IgE epitopes of Cuc m 2, the major melon allergen, and their role in cross-reactivity with pollen profilins.Clin Exp Allergy. 2010 Jan;40(1):174-81. doi: 10.1111/j.1365-2222.2009.03401.x. Clin Exp Allergy. 2010. PMID: 20205701
-
Cross-reactive and species-specific immunoglobulin E epitopes of plant profilins: an experimental and structure-based analysis.Clin Exp Allergy. 2006 Jul;36(7):920-9. doi: 10.1111/j.1365-2222.2006.02521.x. Clin Exp Allergy. 2006. PMID: 16839408
-
Expression, purification, cross-reactivity and homology modeling of peanut profilin.Protein Expr Purif. 2010 Sep;73(1):36-45. doi: 10.1016/j.pep.2010.03.005. Epub 2010 Mar 15. Protein Expr Purif. 2010. PMID: 20230899
-
A structural basis for food allergy: the role of cross-reactivity.Curr Opin Allergy Clin Immunol. 2008 Feb;8(1):82-6. doi: 10.1097/ACI.0b013e3282f4177e. Curr Opin Allergy Clin Immunol. 2008. PMID: 18188023 Review.
-
Profilins: mimickers of allergy or relevant allergens?Int Arch Allergy Immunol. 2011;155(3):191-204. doi: 10.1159/000321178. Epub 2011 Feb 2. Int Arch Allergy Immunol. 2011. PMID: 21293140 Review.
Cited by
-
Structural functionality, catalytic mechanism modeling and molecular allergenicity of phenylcoumaran benzylic ether reductase, an olive pollen (Ole e 12) allergen.J Comput Aided Mol Des. 2013 Oct;27(10):873-95. doi: 10.1007/s10822-013-9686-y. Epub 2013 Oct 24. J Comput Aided Mol Des. 2013. PMID: 24154826
-
T-cell epitope conservation across allergen species is a major determinant of immunogenicity.J Allergy Clin Immunol. 2016 Aug;138(2):571-578.e7. doi: 10.1016/j.jaci.2015.11.034. Epub 2016 Feb 13. J Allergy Clin Immunol. 2016. PMID: 26883464 Free PMC article.
-
Taro raphide-associated proteins: Allergens and crystal growth.Plant Direct. 2022 Sep 2;6(9):e443. doi: 10.1002/pld3.443. eCollection 2022 Sep. Plant Direct. 2022. PMID: 36091877 Free PMC article.
-
Crystal structure of timothy grass allergen Phl p 12.0101 reveals an unusual profilin dimer.Acta Biochim Pol. 2021 Mar 15;68(1):15-22. doi: 10.18388/abp.2020_5587. Acta Biochim Pol. 2021. PMID: 33720678 Free PMC article.
-
Narrow-Leafed Lupin Main Allergen β-Conglutin (Lup an 1) Detection and Quantification Assessment in Natural and Processed Foods.Foods. 2019 Oct 18;8(10):513. doi: 10.3390/foods8100513. Foods. 2019. PMID: 31635336 Free PMC article.
References
-
- Wilke DE, Otto JJ (2003) Profilin functions in cytokinesis, nuclear positioning, and stomatogenesis in Tetrahymena thermophila. J Eukaryot Microbiol 50: 252–262. - PubMed
-
- Schlüter K, Jockusch BM, Rothkegel M (1997) Profilins as regulators of actin dynamics. Biochim Biophys Acta 1359 (2) 97–109. - PubMed
Publication types
MeSH terms
Substances
Associated data
- Actions
- Actions
- Actions
- Actions
- Actions
LinkOut - more resources
Full Text Sources
Other Literature Sources
