. 2013 Oct 16;8(10):e76268.
doi: 10.1371/journal.pone.0076268. eCollection 2013.

Super-resolution imaging of bacteria in a microfluidics device

Affiliations

Super-resolution imaging of bacteria in a microfluidics device

Diego I Cattoni et al. PLoS One. .

Abstract

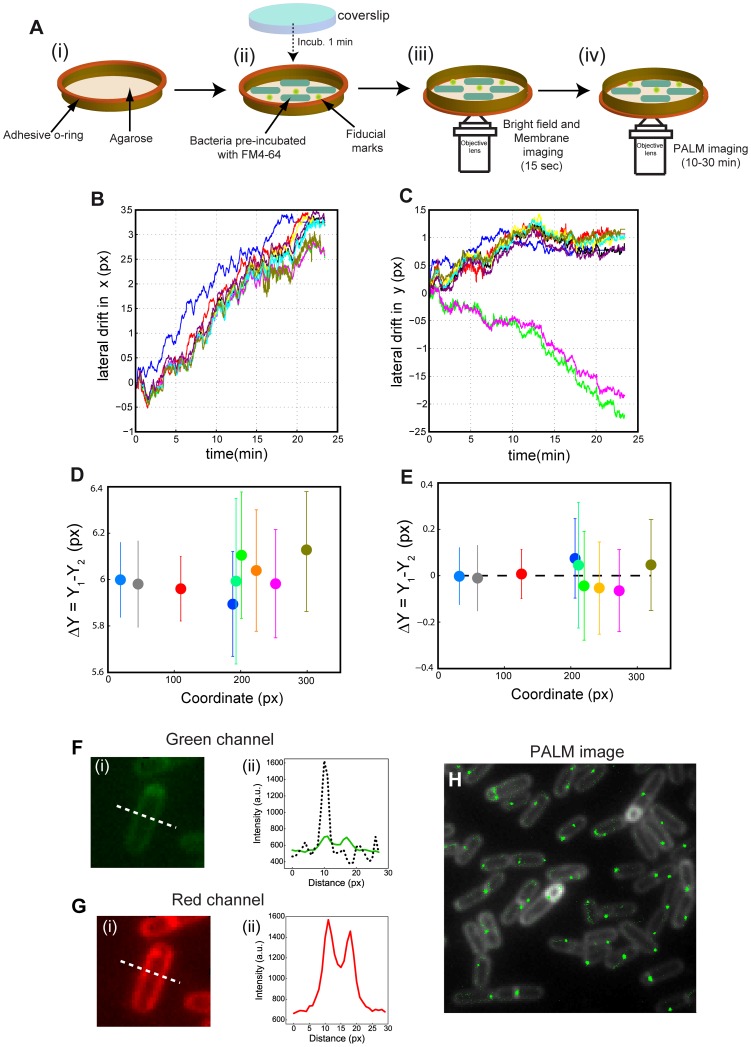
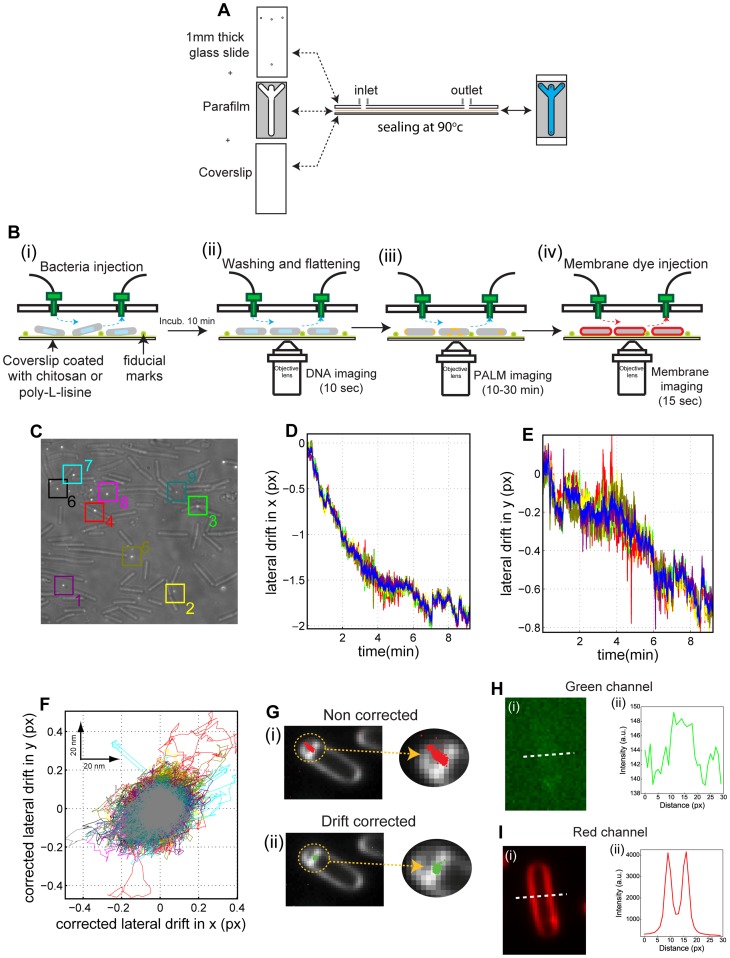
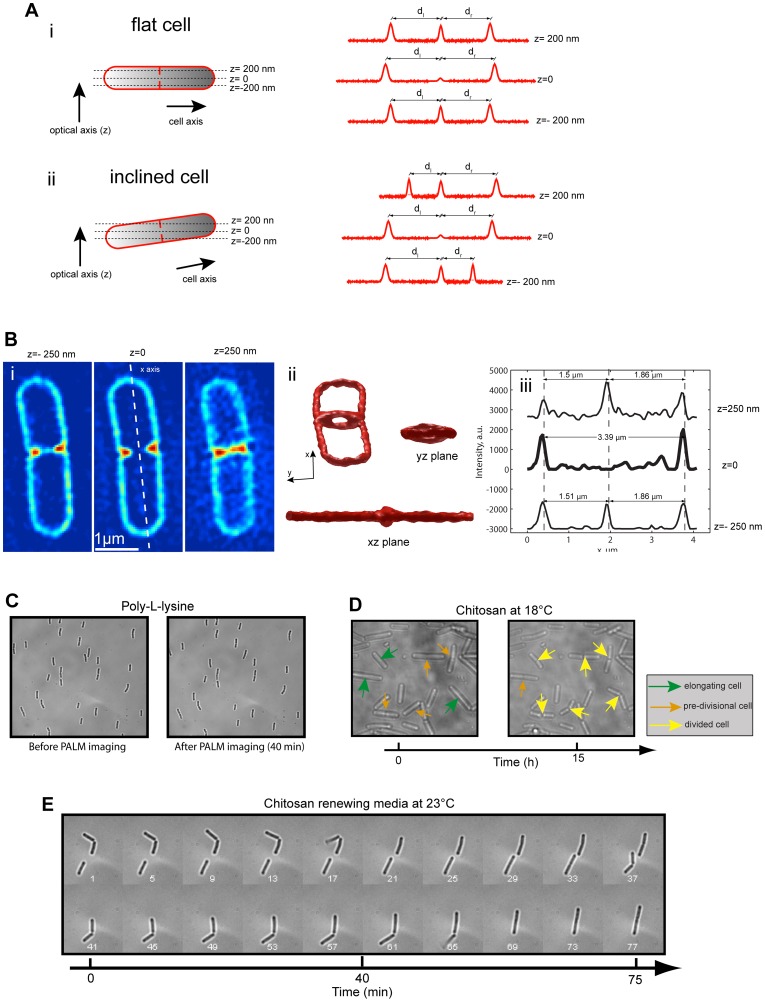
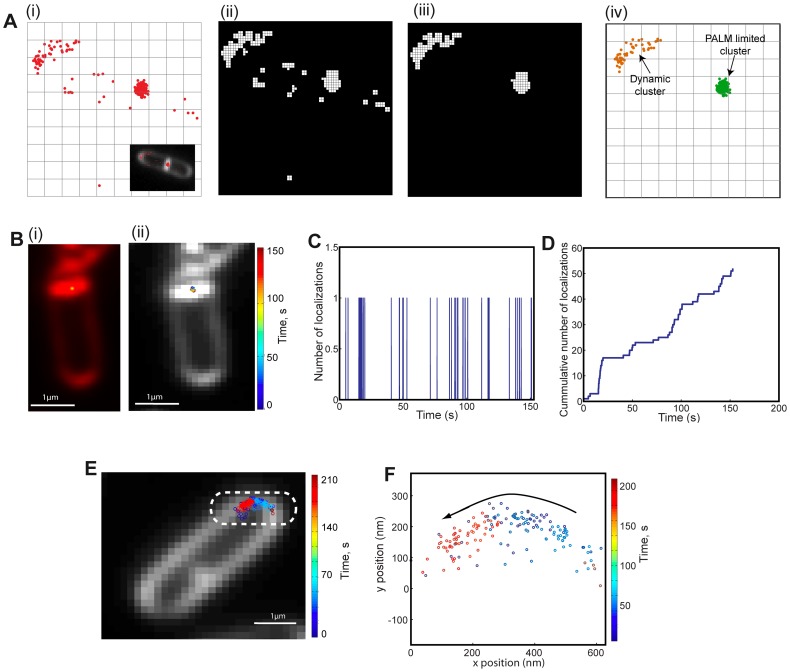
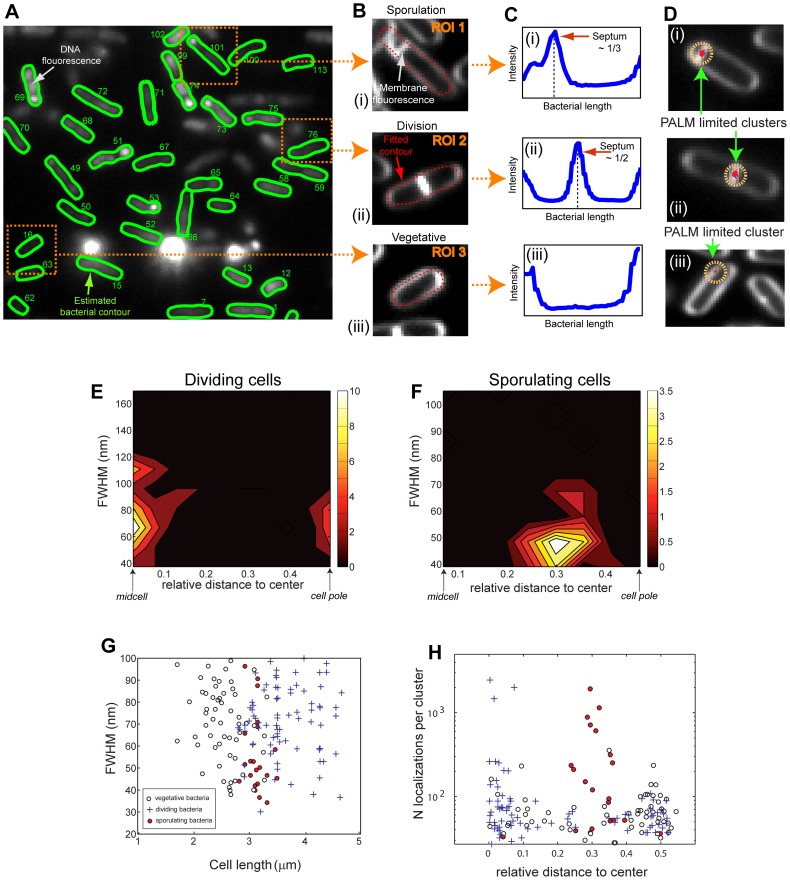
Bacteria have evolved complex, highly-coordinated, multi-component cellular engines to achieve high degrees of efficiency, accuracy, adaptability, and redundancy. Super-resolution fluorescence microscopy methods are ideally suited to investigate the internal composition, architecture, and dynamics of molecular machines and large cellular complexes. These techniques require the long-term stability of samples, high signal-to-noise-ratios, low chromatic aberrations and surface flatness, conditions difficult to meet with traditional immobilization methods. We present a method in which cells are functionalized to a microfluidics device and fluorophores are injected and imaged sequentially. This method has several advantages, as it permits the long-term immobilization of cells and proper correction of drift, avoids chromatic aberrations caused by the use of different filter sets, and allows for the flat immobilization of cells on the surface. In addition, we show that different surface chemistries can be used to image bacteria at different time-scales, and we introduce an automated cell detection and image analysis procedure that can be used to obtain cell-to-cell, single-molecule localization and dynamic heterogeneity as well as average properties at the super-resolution level.


Conflict of interest statement

Competing Interests: The authors have declared that no competing interests exist.

Figures

Figure 1
Figure 1. smSRM of bacteria in agarose pads.
A. smSRM imaging of bacteria in agarose pads. (i) A double-side adhesive o-ring was placed on a coverslip and melted agarose was added to create an adhering surface for the bacteria. (ii) Bacterial cells, previously stained with the membrane dye FM4-64 mixed with fiducial marks, were deposited on agarose and the pad was sealed with a clean coverslip. The sample was finally fixed on an Attofluor cell (Invitrogen) to avoid bacterial motion during microscopy. (iii–iv) Sequential imaging of bacterial membrane and SpoIIIE (iii) Epi-fluorescence image of the cell membrane was collected by exiting at 532 nm. (iv) smSRM images were collected by using continuous excitation with a 532 nm laser and by applying regular pulses of photo-activation with a 405 nm laser. B–C. Lateral drift during smSRM acquisition in agarose pads. Lateral drift over the full acquisition period was assessed by plotting the trajectories of fluorescent beads in x (B) and y (C) coordinates over time. Each colored trajectory corresponds to a single fluorescent bead. D–E. Alignment correction in smSRM experiments in agarose pads. Distortion arising from chromatic aberrations was quantified from the distance between the same fluorescent beads observed in two different emission channels (D) and corrected by using a linear transformation procedure (E) (see Materials and Methods). Each dot represents a different bead and the abcissa represents the x coordinate of each bead. Error bars represent the precision of localization before (D) and after (E) drift and alignment correction. F–G. Bleed-through of the membrane staining agent FM4-64 during smSRM imaging in agarose pads. (i) Image of a cell in the SpoIIIE-PA (SpoIIIE-eosFP) (F) and FM4-64 (G) channels. (ii) Line scans of the fluorescence signal across a B. subtilis cell (white dotted line in panels F-i and G-i) in the two observation channels (green and red lines, respectively). For comparison, the line scan of the fluorescence intensity emitted by a single SpoIIIE-PA protein was overlapped in F-ii (black dotted line). As expected, the signal-to-noise ratio and contrast in the red channel are adequate (SNR = 40/contrast = 2.3, panel G-ii). However, even at low dye concentrations the fluorescence signal from FM4-64 bleeds into the SpoIIIE-PA channel (SNR = 8/contrast = 1.3, panel F-ii), compromising single-molecule detection, lowering the localization precision, and often leading to false positive localizations. For comparison, in the single-molecule trace shown in F-ii the signal to noise ratio is 30, and the contrast is 3. H. SpoIIIE localization observed by smSRM in agarose pads. Pointillist representation of SpoIIIE-PA localization in B. subtilis at different cell stages. Each green dot represents a single fluorescent event detected in a single frame during the smSRM acquisition. False positive localizations can be observed scattered homogeneously over the cell membrane.
Figure 2
Figure 2. smSRM of bacteria in a microfluidics chamber.
A. Micro-fluidic chamber assembly. A a coverslip and a 1-way inlet and single outlet ports were sealed together by a parafilm mask melted at 90 °C during 1 minute. B. Sequential smSRM imaging procedure in microfluidic chamber. (i) The microfluidic chamber was filled with a 0.01% (w/v) solution of poly-L-Lysine or 0.015% (w/v) chitosan and incubated for at least 5 minutes at room temperature. After washing with sporulation media, 100 μL of a concentrated solution of bacterial cells along with fiducial marks were injected and let settle onto the coated surface. (i–ii) A high flow force was applied by pumping sporulation medium to rinse the channel, wash away unattached bacteria and ensure that attached bacteria laid completely flat on the surface. (ii) DNA was imaged by epi-fluorescence microscopy, and (iii) SpoIIIE was imaged by smSRM. (iv) Finally, the FM4-64 membrane staining agent was injected allowing for bacterial membrane detection by epi-fluorescence. C–E. Lateral drift during smSRM acquisition in micro-fluidics chambers. C. Bright field image of B. subtilis in a microfluidics chamber coated with chitosan. During bright field image acquisition the 561 nm laser was turned on to simultaneously detect fiducial marks. Colored squares indicate the selected beads for drift calculation and correction. D–E. Lateral drift over the full acquisition period was assessed by plotting the trajectories of fluorescent beads in x (D) and y (E) coordinates over time. Each colored trajectory corresponds to a single fluorescent bead selected in C. Blue line represent the mean of all trajectories. F. Quantification of lateral displacement after drift correction. The lateral displacements of the different fiducial marks were recalculated after subtraction of the drift from the mean trajectory. Grey line represents the mean drift obtained for the selected group of beads (σx = 5.4 nm and σy = 6.1 nm). G. Effect of drift correction on smSRM imaging. Pointillist reconstruction of detected events during smSRM imaging of SpoIIIE-PA (SpoIIIE-mMaple) in sporulating B. subtillis. Red and green dots represent the detected events before (i) and after (ii) drift correction, respectively. The size of the dots representing single molecule detections has been artificially increased for visualization purposes. H. Background in the SpoIIIE-PA channel during smSRM. Line scan of the fluorescence signal across a B. subtilis cell in the green (SpoIIIE-PA) detection channel (white dotted line in panels H-i). The background in the green channel corresponding to cell autofluorescence is extremely low (SNR = 0.3/contrast = 1.04) as compared to that observed in the presence of low amounts of membrane dye in agarose pads (SNR = 8/contrast = 1.3) and considerably lower than the signal from single-molecules (SNR∼30/contrast ∼5–10). I. Imaging bacterial membranes after smSRM acquisition. Line scans of the fluorescence signal across a B. subtilis cell in the red channel after injection of FM4-64 (white dotted line in panels I-i). As expected, the signal-to-noise ratio and contrast in the red channel are excellent (SNR = 200/contrast = 40, panel I-ii).
Figure 3
Figure 3. Cell flatness, stability and growth in microfluidics chambers.
A. Fluorescence intensity profiles of flat and inclined cells. Schematic fluorescence intensity profiles are drawn across a line passing through the cell poles and the center of a closing septum at different axial positions (left panels). z represents the direction of the optical axis, with z = 0 corresponding to the plane in which the center of the septum is on focus. (i) On a flat cell, the distance between the peaks corresponding to the positions of the cell poles and the center of the cell (dR and dL, respectively) either remain constant or diminish as the axial focal position increases or decreases. (ii) In contrast, in inclined cells the cell pole peaks move together to the left or the right as the axial position increases, and move to the opposite direction when the axial position decreases. This movement translates into an increase of dR and a decrease of dL on one side of the focal plane and the reverse on the opposite side. Intensity profiles are schematic and not from real data. B. 3D-SIM membrane imaging of a dividing B. subtilis cell and profile quantification. (i) Three planes of a single dividing cell are shown with the x-axis representing the axis of the cell. (ii) Three views of a constant intensity level reconstruction of the cell shown in (i). (iii) Intensity profiles drawn in the x direction at the three focal plane positions shown in (i). C. Integrity and stability of B. subtilis during smSRM imaging on poly-L-lysine-treated surfaces. Cells were incubated for 2 h in sporulation media, injected into a poly-L-lysine-coated microfluidics chamber, and attached to the surface as described in Figure 2B. Bright field images of sporulating B. subtilis cells before (left panel) and after (right panel) smSRM imaging (∼40 min). Notice that cells do not show any movement or sign of damage due the poly-L-lysine surface coating or due to smSRM imaging. Medium was continuously renewed by flow (5 µl/min of LB20%). D–E. B. subtilis can grow and divide after smSRM imaging on chitosan-treated surfaces. Exponentially growing cells were injected into a chitosan-treated microfluidics chamber, and attached to the surface as described in Figure 2B. Representative examples of B. subtillis spotted on chitosan and followed by time-lapse bright field imaging under two conditions: (D) at 18°C with no medium renewal, and (E) at 23°C while renewing the growing medium (LB20%). Time between frames was 8 min. Images were taken from Movie S1. Frame numbers (white) are indicated in the time-lapse montage of panel D. Color-coded arrows indicate elongating (green), pre-divisional (orange) and recently divided (yellow) cells. Notice that bacteria are not affected by the smSRM imaging procedure and can grow and divide successfully when attached to the surface coated with chitosan.
Figure 4
Figure 4. Automatic cluster detection and characterization.
A. Scheme of the clusterization algorithm. (i) Red dots represent single-molecule localizations with black lines representing pixel boundaries of the smSRM image in the inset. (ii) Initially, the field of view is divided in virtual pixels of a size smaller than our localization precision (virtual pixel size is typically 5–10 nm) and a binary image of the localizations map is built (white pixels). (iii) The binary image is then analyzed, and independent objects are automatically detected and classified. Objects showing a minimum number of events (5 to 50) and area (>1 px) were further processed whereas the rest were discarded. (iv) Each cluster was classified depending on their size, number of events and trajectories. A dynamic (orange dots) and a PALM-limited cluster (green dots, see main text) were detected. Dots and pixel sizes were arbitrary modified for visualizing purposes. B. PALM-limited clusters. (i) smSRM reconstruction of the distribution of SpoIIIE-PA (SpoIIIE-mMaple), and (ii) a pointillist representation of a PALM-limited cluster in which single localizations are color-coded by time (complete time-series). C–D. Analysis of single-molecule detections in a typical cluster. C. Number of events detected in the PALM-limited cluster shown in B are plotted as a function of time. Single, non-overlapping localization events are detected and dark times between events are longer than average emission times, consistent with each photo-activated protein being imaged with no overlapping between events. D. Cumulative number of events detected as a function of time in the PALM-limited cluster shown in B. This trace shows that photo-activation rates are in average homogeneous during acquisition. E–F Characterization of dynamic clusters. E. A pointillist representation of a dynamic cluster (highlighted by a dotted line) in which single localizations are color-coded by time (complete time-series). Here, localization events spread over several pixels and follow a path along the cell pole. F. Representative trajectories generated from tracking the motion of single-localizations identified in panel E (color coded by time of detection: from latest to earliest red, green and blue).
Figure 5
Figure 5. Automatic cell detection, sorting, classification, and cluster statistics.
A. Cell detection. Chromosomal DNA stained with SYTOX green was imaged, cells were detected, and contours were calculated using a modified version of MicrobeTracker . For each detected bacterium, the position of the cell and the points delimiting its contour were saved and fed to our PALMcbs software. B–C. Contour refinement and automatic cell sorting. B. Since chromosomes were naturally confined within the cell, the contour calculated with microbeTracker was often too small to encompass the whole membrane and required enlargement. Using the previously detected contour as a seed, the contours were recalculated by fitting it to the membrane fluorescence signal. C. A cell sorting procedure was used to classify cells according to the three growing states detectable in our experimental conditions. The presence of a septum was first assessed by plotting the fluorescence intensity profile of the membrane along the cell length. Depending on whether a septum was detected and on its position, each bacterium was automatically classified as sporulating, dividing or vegetative/pre-divisional (ROI 1, 2 and 3 respectively in panel B). D. Cluster detection and classification. First, single molecule events obtained from all frames are plotted together (red dots) and over-imposed on the membrane stain image (white). Next, the distribution of fluorescent events was analyzed as described in Figure 3 in order to automatically detect, classify and characterize clusters. E–F. Distribution of SpoIIIE-mMaple PALM-limited cluster sizes in a population of (E) dividing and (F) sporulating bacteria. The sizes of the detect clusters (FWHM, full width at half maximum) is plotted against the axial distance from the center of the bacteria. The total number of clusters detected is color-coded according to the color bar (right). (E) In dividing cells, clusters localize to division septa and to cell poles to a lower degree, and have a broad distribution with an average size of ∼65 nm. (F) In sporulating cells, clusters specifically localize to the sporulation septum and have a narrow distribution with a mean at ∼45 nm. G. SpoIIIE-mMaple PALM-limited cluster sizes as a function of cell cycle stage and bacterial length. The size of detected clusters was plotted against the bacterial length (in the axial direction) and classified depending on its cell cycle stage. Vegetative/pre-divisional cells tend to be small (2.5±0.5 μm) and show clusters of 65±15 nm in size, whilst dividing cells are considerably larger (4±0.6 μm) and display similar cluster sizes (65±18 nm). Interestingly, sporulating cells have a narrower size distribution (3.1±0.2 μm) and present smaller clusters (45±8 nm). H. Composition and distribution of SpoIIIE-mMaple PALM-limited clusters as a function of cell cycle stage. The number of localizations per cluster was plotted as a function of their relative axial distance to the center of the cell. Clusters in sporulating cells tend to have a larger number of localizations than clusters in dividing or vegetative/pre-divisional states.

Similar articles

Cited by

References

    1. Cozzarelli NR, Cost GJ, Nollmann M, Viard T, Stray JE (2006) Giant proteins that move DNA: bullies of the genomic playground. Nat Rev Mol Cell Biol 7: 580–588. - PubMed
    1. Schermelleh L, Heintzmann R, Leonhardt H (2010) A guide to super-resolution fluorescence microscopy. J Cell Biol 190: 165–175. - PMC - PubMed
    1. Huang B, Bates M, Zhuang X (2009) Super-resolution fluorescence microscopy. Annu Rev Biochem 78: 993–1016. - PMC - PubMed
    1. Betzig E, Patterson GH, Sougrat R, Lindwasser OW, Olenych S, et al. (2006) Imaging intracellular fluorescent proteins at nanometer resolution. Science 313: 1642–1645. - PubMed
    1. Hess ST, Girirajan TP, Mason MD (2006) Ultra-high resolution imaging by fluorescence photoactivation localization microscopy. Biophys J 91: 4258–4272. - PMC - PubMed

Publication types

LinkOut - more resources