

Autocrine extra-pancreatic trypsin 3 secretion promotes cell proliferation and survival in esophageal adenocarcinoma
- PMID: 24146905
- PMCID: PMC3795734
- DOI: 10.1371/journal.pone.0076667
Autocrine extra-pancreatic trypsin 3 secretion promotes cell proliferation and survival in esophageal adenocarcinoma
Abstract
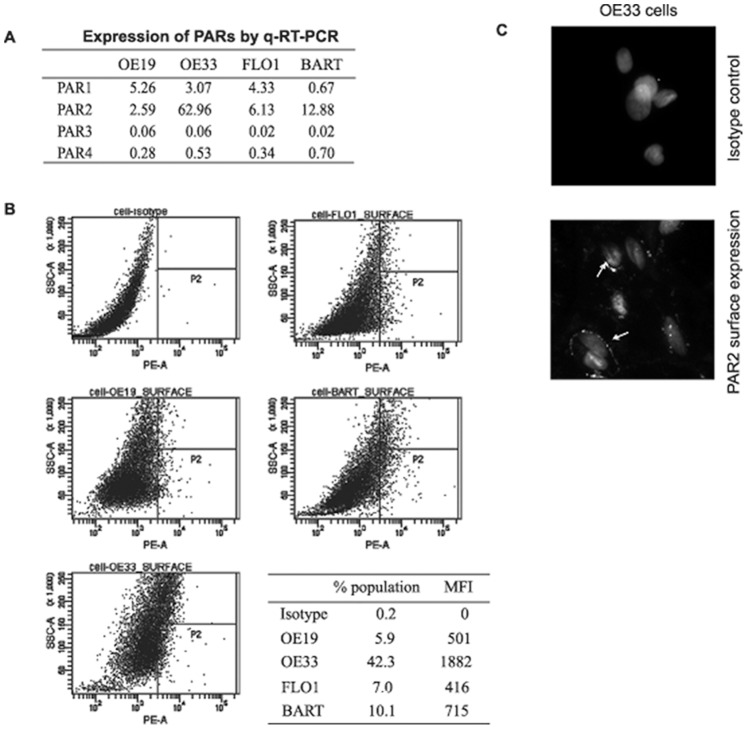
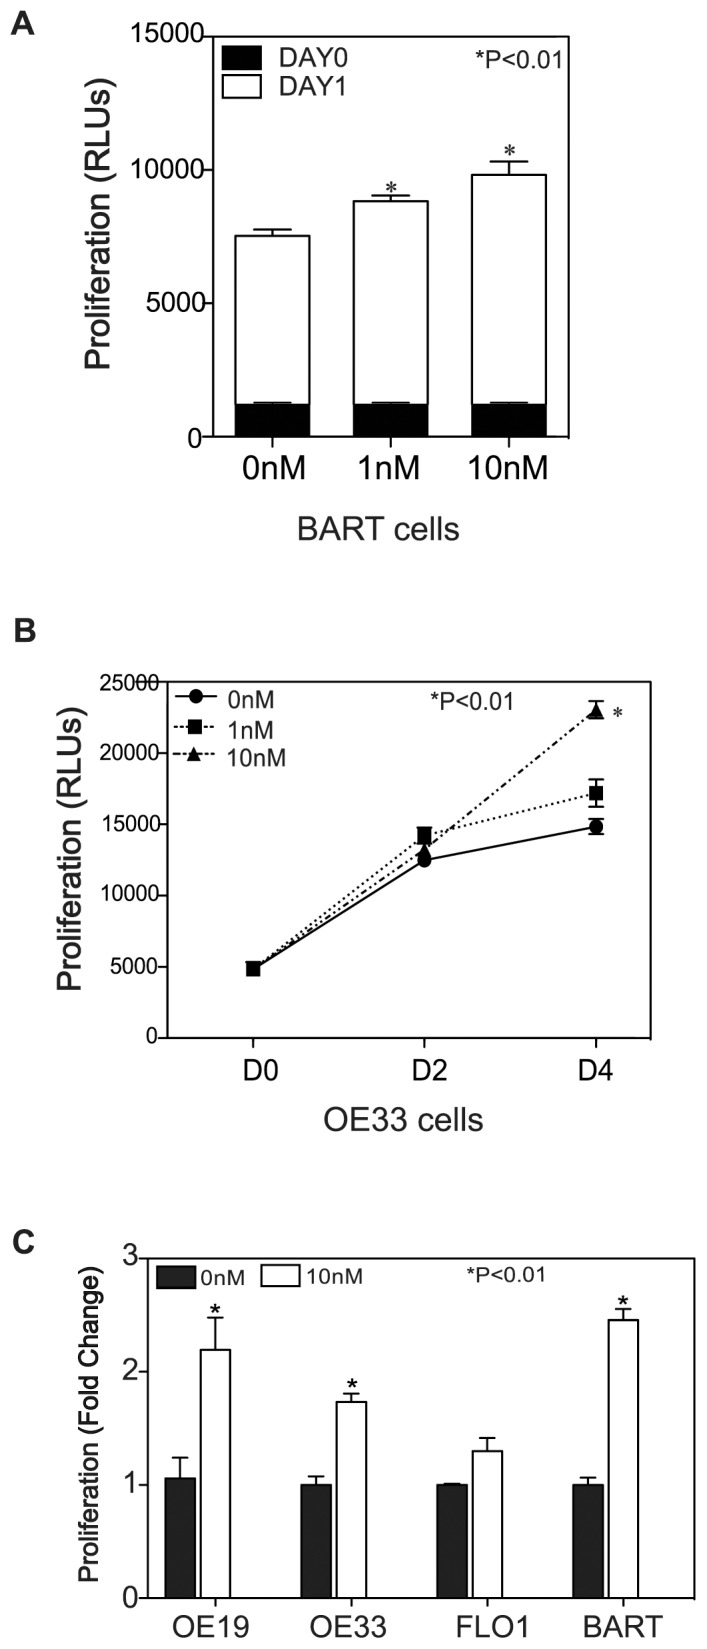
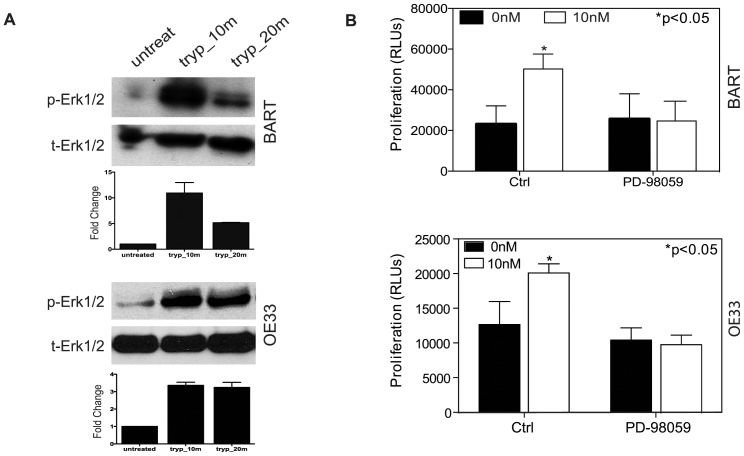
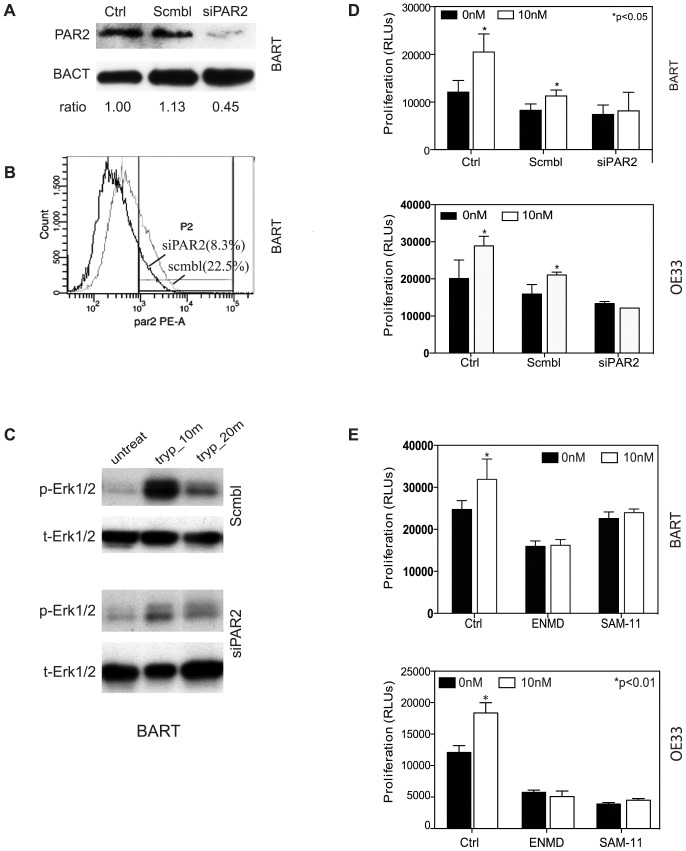
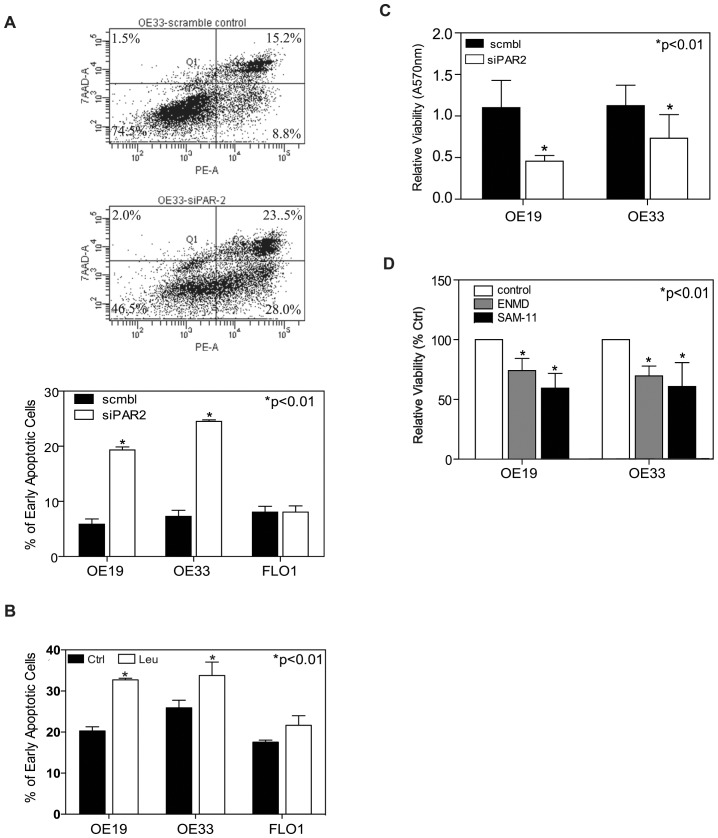
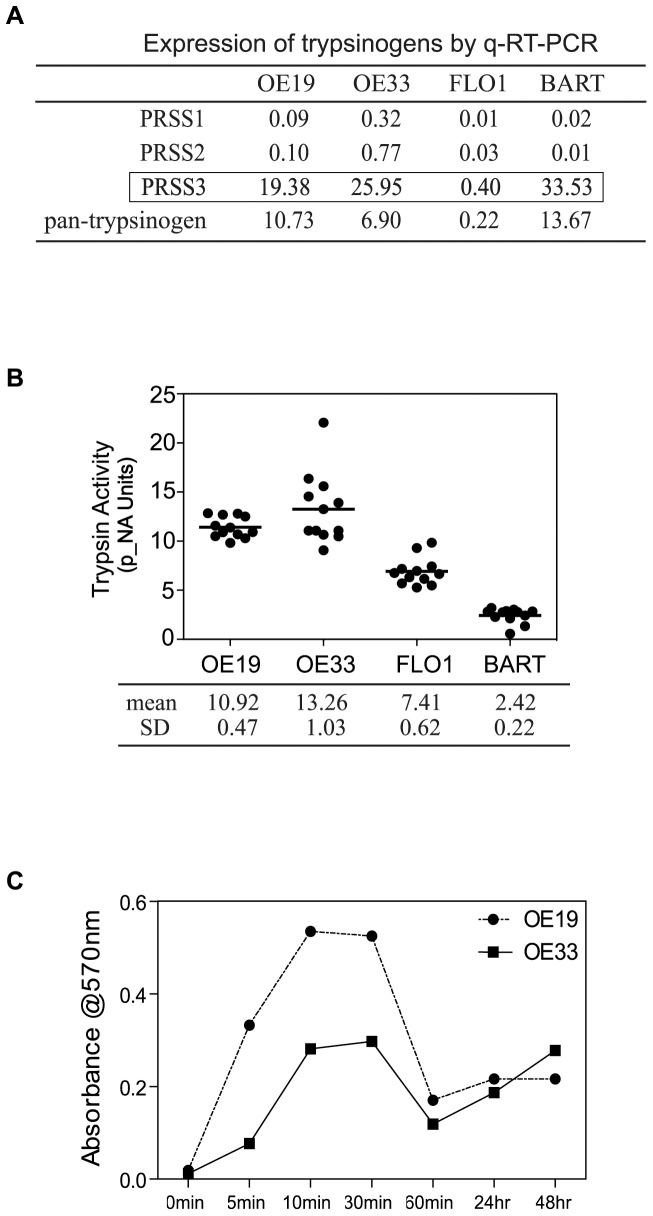
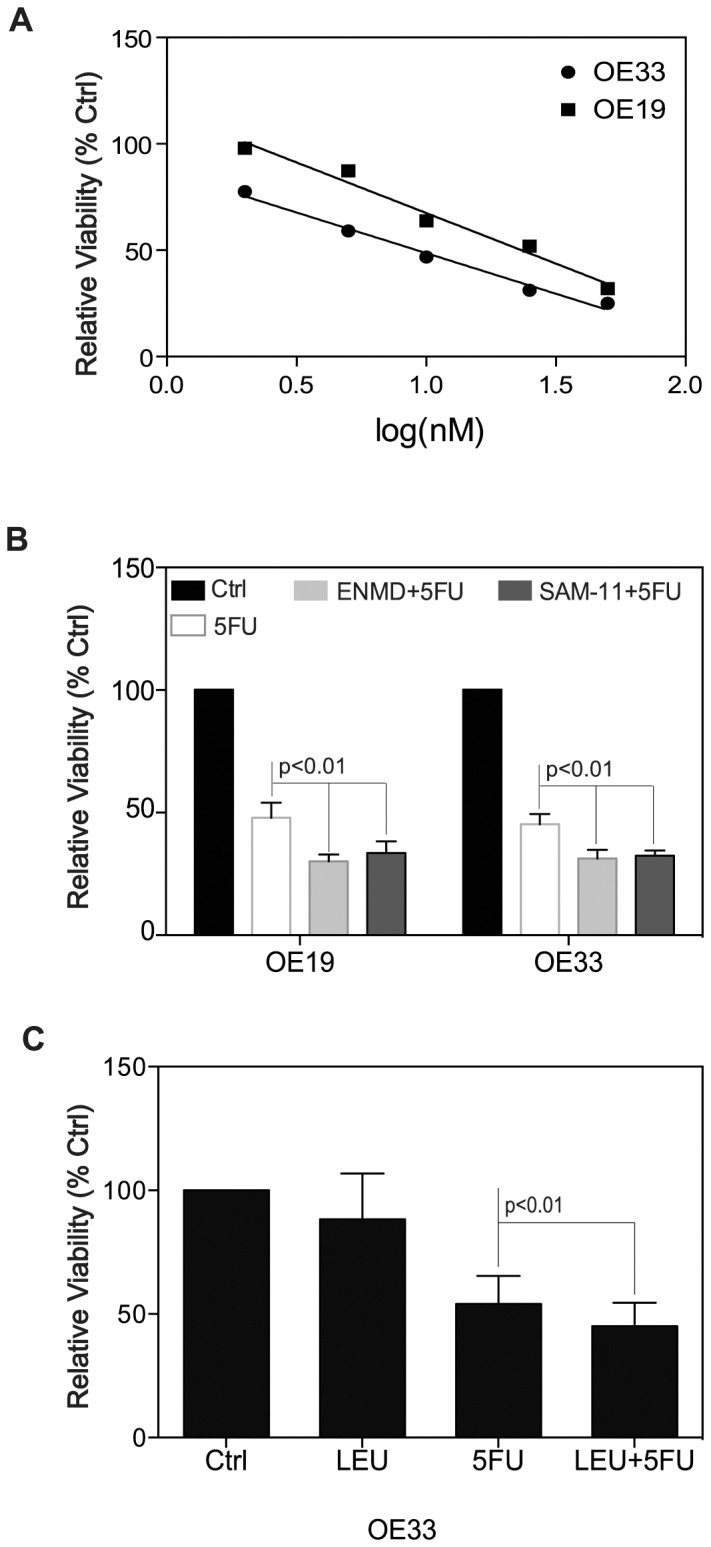
Trypsin or Tumor associated trypsin (TAT) activation of Protease-activated receptor 2 (PAR-2) promotes tumor cell proliferation in gastrointestinal cancers. The role of the trypsin/PAR-2 network in esophageal adenocarcinoma (EA) development has not yet been investigated. The aim of this study is to investigate the role of trypsin/PAR-2 activation in EA tumorogenesis and therapy. We found that esophageal adenocarcinoma cells (EACs) and Barrett's Metaplasia (BART) expressed high levels of type 3 extra-pancreatic trypsinogen (PRSS3), a novel type of TAT. Activity of secreted trypsin was detected in cultured media from EA OE19 and OE33 cultures but not from BART culture. Surface PAR-2 expression in BART and EACs was confirmed by both flow cytometry and immunofluorescence. Trypsin induced cell proliferation (~ 2 fold; P<0.01) in all tested cell lines at a concentration of 10 nM. Inhibition of PAR-2 activity in EACs via the PAR-2 antagonist ENMD (500 µM), anti-PAR2 antibody SAM-11 (2 µg/ml), or siRNA PAR-2 knockdown, reduced cell proliferation and increased apoptosis by up to 4 fold (P<0.01). Trypsin stimulation led to phosphorylation of ERK1/2, suggesting involvement of MAPK pathway in PAR-2 signal transduction. Inhibition of PAR-2 activation or siRNA PAR-2 knockdown in EACs prior to treatment with 5 FU reduced cell viability of EACs by an additional 30% (P<0.01) compared to chemotherapy alone. Our data suggest that extra-pancreatic trypsinogen 3 is produced by EACs and activates PAR-2 in an autocrine manner. PAR-2 activation increases cancer cell proliferation, and promotes cancer cell survival. Targeting the trypsin activated PAR-2 pathway in conjunction with current chemotherapeutic agents may be a viable therapeutic strategy in EA.
Conflict of interest statement
Figures
Similar articles
-
Autocrine VEGF signaling promotes proliferation of neoplastic Barrett's epithelial cells through a PLC-dependent pathway.Gastroenterology. 2014 Feb;146(2):461-72.e6. doi: 10.1053/j.gastro.2013.10.011. Epub 2013 Oct 9. Gastroenterology. 2014. PMID: 24120473 Free PMC article.
-
Signaling in H2O2-induced increase in cell proliferation in Barrett's esophageal adenocarcinoma cells.J Pharmacol Exp Ther. 2011 Oct;339(1):218-27. doi: 10.1124/jpet.111.182352. Epub 2011 Jul 12. J Pharmacol Exp Ther. 2011. PMID: 21750116 Free PMC article.
-
STAT5 mediates PAF-induced NADPH oxidase NOX5-S expression in Barrett's esophageal adenocarcinoma cells.Am J Physiol Gastrointest Liver Physiol. 2008 Jan;294(1):G174-83. doi: 10.1152/ajpgi.00291.2007. Epub 2007 Oct 18. Am J Physiol Gastrointest Liver Physiol. 2008. PMID: 17947454
-
PAR2: The Cornerstone of Pancreatic Diseases.Physiol Res. 2022 Nov 28;71(5):583-596. doi: 10.33549/physiolres.934931. Epub 2022 Sep 8. Physiol Res. 2022. PMID: 36073735 Free PMC article. Review.
-
Acute pancreatitis: proteinase-activated receptor-2 as Dr. Jekyll and Mr. Hyde.Physiol Res. 2006;55(5):467-474. doi: 10.33549/physiolres.930798. Epub 2005 Dec 12. Physiol Res. 2006. PMID: 16343048 Review.
Cited by
-
CpG Site-Specific Methylation-Modulated Divergent Expression of PRSS3 Transcript Variants Facilitates Nongenetic Intratumor Heterogeneity in Human Hepatocellular Carcinoma.Front Oncol. 2022 Apr 11;12:831268. doi: 10.3389/fonc.2022.831268. eCollection 2022. Front Oncol. 2022. PMID: 35480112 Free PMC article.
-
Identification of microRNAs as novel biomarkers for esophageal squamous cell carcinoma: a study based on The Cancer Genome Atlas (TCGA) and bioinformatics.Chin Med J (Engl). 2019 Sep 20;132(18):2213-2222. doi: 10.1097/CM9.0000000000000427. Chin Med J (Engl). 2019. PMID: 31490264 Free PMC article.
-
Combinatorial protein engineering of proteolytically resistant mesotrypsin inhibitors as candidates for cancer therapy.Biochem J. 2016 May 15;473(10):1329-41. doi: 10.1042/BJ20151410. Epub 2016 Mar 8. Biochem J. 2016. PMID: 26957636 Free PMC article.
-
Protease-activated receptor 2 agonist increases cell proliferation and invasion of human pancreatic cancer cells.Exp Ther Med. 2015 Jan;9(1):239-244. doi: 10.3892/etm.2014.2052. Epub 2014 Nov 5. Exp Ther Med. 2015. PMID: 25452809 Free PMC article.
-
Mesotrypsin Has Evolved Four Unique Residues to Cleave Trypsin Inhibitors as Substrates.J Biol Chem. 2015 Aug 28;290(35):21523-35. doi: 10.1074/jbc.M115.662429. Epub 2015 Jul 14. J Biol Chem. 2015. PMID: 26175157 Free PMC article.
References
-
- Phillips WA, Lord RV, Nancarrow DJ, Watson DI, Whiteman DC (2011) Barrett’s esophagus. J Gastroenterol Hepatol 26: 639–648. - PubMed
-
- Jaiswal K, Lopez-Guzman C, Souza RF, Spechler SJ, Sarosi GA Jr (2006) Bile salt exposure increases proliferation through p38 and ERK MAPK pathways in a non-neoplastic Barrett’s cell line. Am J Physiol Gastrointest Liver Physiol 290: G335–342. - PubMed
-
- Terada T, Ohta T, Minato H, Nakanuma Y (1995) Expression of pancreatic trypsinogen/trypsin and cathepsin B in human cholangiocarcinomas and hepatocellular carcinomas. Hum Pathol 26: 746–752. - PubMed
-
- Shimamoto R, Sawada T, Uchima Y, Inoue M, Kimura K, et al. (2004) A role for protease-activated receptor-2 in pancreatic cancer cell proliferation. Int J Oncol 24: 1401–1406. - PubMed
Publication types
MeSH terms
Substances
Supplementary concepts
Associated data
- Actions
- Actions
- Actions
LinkOut - more resources
Full Text Sources
Other Literature Sources
Medical
Miscellaneous
