. 2013 Oct 17;8(10):e77417.
doi: 10.1371/journal.pone.0077417. eCollection 2013.

Form-finding model shows how cytoskeleton network stiffness is realized

Affiliations

Form-finding model shows how cytoskeleton network stiffness is realized

Jinghai Gong et al. PLoS One. .

Abstract

In eukaryotic cells the actin-cytoskeletal network provides stiffness and the driving force that contributes to changes in cell shape and cell motility, but the elastic behavior of this network is not well understood. In this paper a two dimensional form-finding model is proposed to investigate the elasticity of the actin filament network. Utilizing an initially random array of actin filaments and actin-cross-linking proteins the form-finding model iterates until the random array is brought into a stable equilibrium configuration. With some care given to actin filament density and length, distance between host sites for cross-linkers, and overall domain size the resulting configurations from the form-finding model are found to be topologically similar to cytoskeletal networks in real cells. The resulting network may then be mechanically exercised to explore how the actin filaments deform and align under load and the sensitivity of the network's stiffness to actin filament density, length, etc. Results of the model are consistent with the experimental literature, e.g. actin filaments tend to re-orient in the direction of stretching; and the filament relative density, filament length, and actin-cross-linking protein's relative density, control the actin-network stiffness. The model provides a ready means of extension to more complicated domains and a three-dimensional form-finding model is under development as well as models studying the formation of actin bundles.


Conflict of interest statement

Competing Interests: The authors have declared that no competing interests exist.

Figures

Figure 1
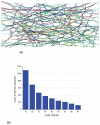
Figure 1. Typical actin-network (a) form-finding model (b) scanning electron micrograph.
Figure 2
Figure 2. Generation of a filament and cross-linked network (a) a prescribed square domain (b) the first actin filament placed (c) actin filaments reaching the specified relative density (d) actin filaments are divided into segments by nodes (e) the network of actin filaments connected by cross-linkers (i.e., actin-cross-linking proteins) before form-finding analysis (f) the network of actin filaments connected by cross-linkers after form-finding analysis.
*d and e show magnifications of the square region marked by the black dashed line in c.
Figure 3
Figure 3. Schematic diagram of Hooke’s law for plane stress state.
Figure 4
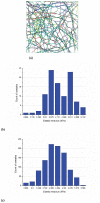
Figure 4. Typical model and impact of number of simulations (actin filament relative density: 0.2%, size: 10μm×10μm, Actin filament length: 5μm±2μm, segment length 0.3μm±0.06μm, and maximum cross-linker length: 0.3μm) (a) layout of a selected sample (b) histogram of elastic moduli for 100 samples: E¯=4.38kPa, std(E)=0.47kPa (c) histogram of elastic moduli for 1000 samples: E¯=4.41kPa, std(E)=0.52kPa.
Figure 5
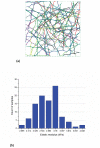
Figure 5. Typical model and response on 10μm×10μm domain (100 samples, actin filament relative density: 0.15%, actin filament length: 5μm±2μm, segment length 0.3μm±0.06μm, and maximum cross-linker length: 0.3 μm) (a) layout of a selected sample (10μm×10μm) (b) histogram of elastic moduli, E¯=3.11kPa, std(E)=0.40kPa.
Figure 6
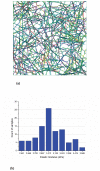
Figure 6. Typical model and response on 20μm×20μm domain (100 samples, actin filament relative density: 0.15%, actin filament length: 5μm±2μm, segment length 0.3μm±0.06μm, and maximum cross-linker length: 0.3 μm) (a) layout of a selected sample (20μm×20μm) (b) histogram of elastic moduli, E¯=3.09kPa, std(E)=0.24kPa.
Figure 7
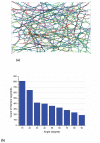
Figure 7. Initial layout and orientation of filament segments (a) initial layout of a selected sample (b) histogram of angles between filament segments and horizontal axis at the initial state.
Figure 8
Figure 8. Deformed shape and orientation at 50% tensile strain (a) layout of a selected sample at 50% extension (b) histogram of angles between filament segments and horizontal axis.
Figure 9
Figure 9. Deformed shape and orientation at 100% tensile strain (a) layout of a selected sample at 100% extension (b) histogram of angles between filament segments and horizontal axis.
Figure 10
Figure 10. Layouts of selected samples with different actin filament relative densities.
(a) 0.15% (b) 0.20% (c) 0.25% (d) 0.30%.
Figure 11
Figure 11. Impact of filament relative density on stiffness (a) filament relative density of 0.15%, E¯=3.11kPa, std(E)=0.40kPa; (b) filament relative density of 0.20%, E¯ = 4.38kPa, std(E) = 0.47kPa; (c) filament relative density of 0.25%, E¯ = 5.69kPa, std(E) = 0.66kPa; (d) filament relative density of 0.30%, E¯ = 6.83kPa, std(E) = 0.67kPa. E¯and std(E) denote sample mean and standard deviation of elastic modulus E, respectively.
Figure 12
Figure 12. Variation of average stiffness of networks with relative density of actin filaments.
Figure 13
Figure 13. Layouts of selected samples having different lengths of actin filaments (a) 0.6±0.12μm (b) 2.4±0.48μm (c) 4.2±0.84μm (d) 6±1.2μm.
Figure 14
Figure 14. Impact of average actin filament length (L) on stiffness (filament relative density of 0.2%) (a) actin filament length L = 0.6±0.12μm, E¯ = 2.08kPa, std(E) = 0.19kPa; (b) L = 2.4±0.48μm, E¯ = 3.00kPa, std(E) = 0.32kPa; (c) L = 4.2±0.84μm, E¯ = 3.50kPa, std(E) = 0.39kPa; (d) L = 6.0±1.2μm, E¯ = 3.85kPa, std(E) = 0.49kPa.
Figure 15
Figure 15. Variation of network stiffness as a function of average filament length.
Figure 16
Figure 16. Layouts of selected samples having (a) 20%, (b) 40%, (c) 60%, (d) 80%, and (e) 100% cross-linkers.
To highlight the cross-linkers, they are marked by blue dashed lines and actin filaments are in green.
Figure 17
Figure 17. Impact of cross-linker density (f) on stiffness (filament relative density of 0.2): (a) cross-linker density f = 20%, E¯ = 1.35 kPa, std(E) = 0.27kPa; (b) f = 40%, E¯ = 2.39kPa, std(E) = 0.35kPa; (c) f = 60%, E¯ = 3.15 kPa, std(E) = 0.42kPa; (d) f = 80%, E¯ = 3.77kPa, std(E) = 0.46kPa.
Figure 18
Figure 18. Variation of network stiffness with percentage of cross-linkers.
Figure 19
Figure 19. Histogram of actin filament energy fraction that is axial strain energy (10μm×10μm, actin filament relative density 0.15%, actin filament length 5μm±2μm, segment length 0.3±0.06μm, and maximum cross-linker length: 0.3μm).

Similar articles

Cited by

References

    1. Ethier CR, Simmons CA (2007) Introductory biomechanics: from cells to organisms. Cambridge Univ Pr.
    1. Pollard TD, Cooper JA (2009) Actin, a central player in cell shape and movement. Science 326: 1208–1212. doi:10.1126/science.1175862. PubMed: 19965462. - DOI - PMC - PubMed
    1. Satcher RL Jr, Dewey CF Jr (1996) Theoretical estimates of mechanical properties of the endothelial cell cytoskeleton. Biophys J 71: 109-118. doi:10.1016/S0006-3495(96)79206-8. PubMed: 8804594. - DOI - PMC - PubMed
    1. Ingber DE (1993) Cellular tensegrity: defining new rules of biological design that govern the cytoskeleton. J Cell Sci 104: 613-613. PubMed: 8314865. - PubMed
    1. Cañadas P, Laurent VM, Oddou C, Isabey D, Wendling S (2002) A cellular tensegrity model to analyse the structural viscoelasticity of the cytoskeleton. J Theor Biol 218: 155-173. doi:10.1006/jtbi.2002.3064. PubMed: 12381289. - DOI - PubMed

Publication types

LinkOut - more resources