. 2013 Oct 16;8(10):e77487.
doi: 10.1371/journal.pone.0077487. eCollection 2013.

The coordination of cell growth during fission yeast mating requires Ras1-GTP hydrolysis

Affiliations

The coordination of cell growth during fission yeast mating requires Ras1-GTP hydrolysis

Cathryn Weston et al. PLoS One. .

Expression of concern in

Abstract

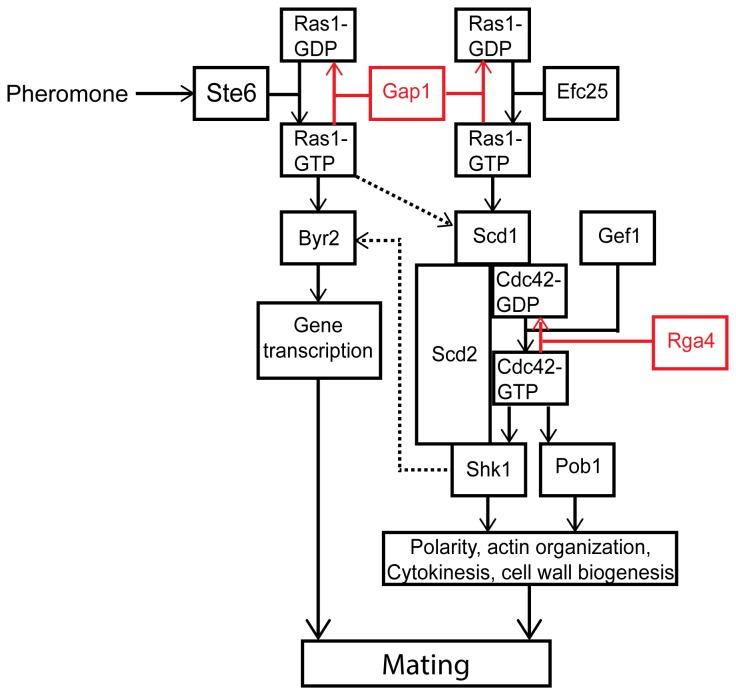
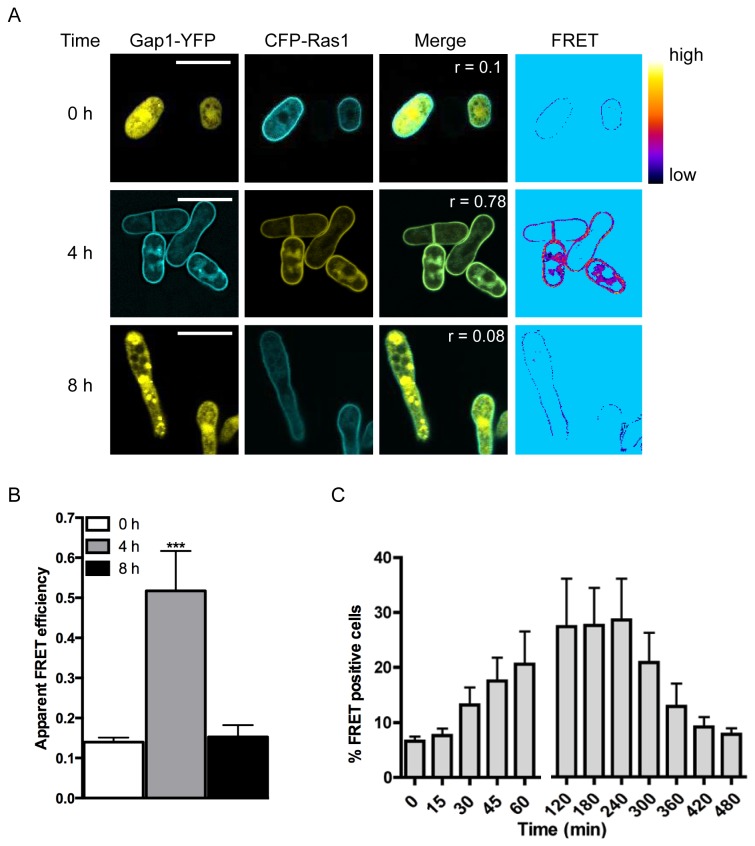
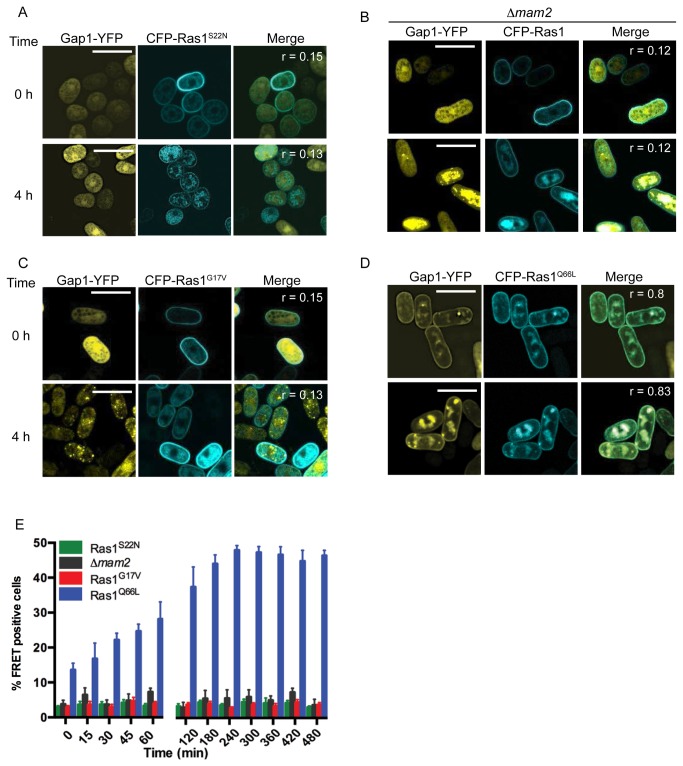
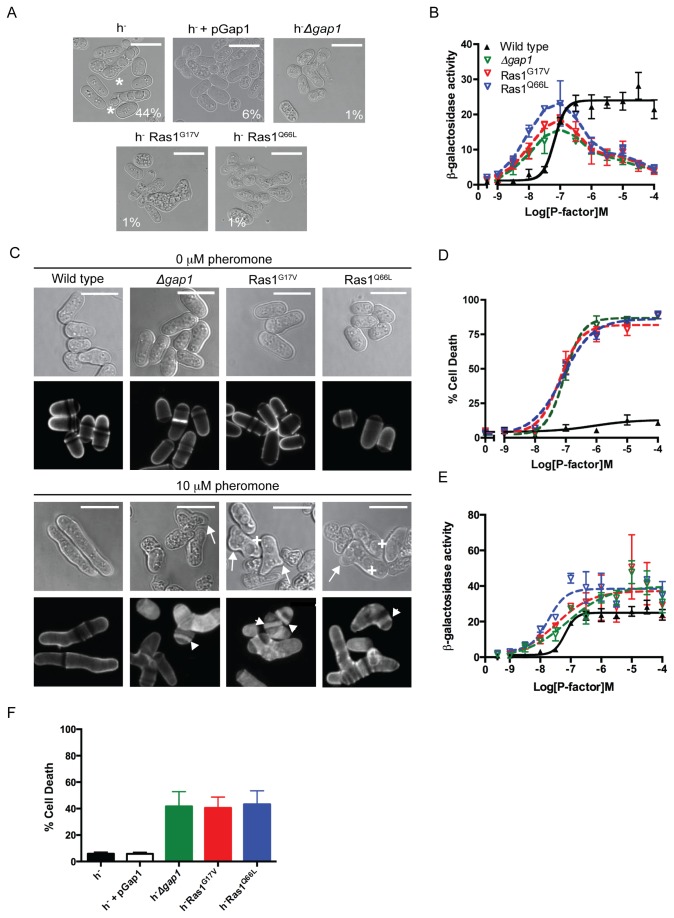
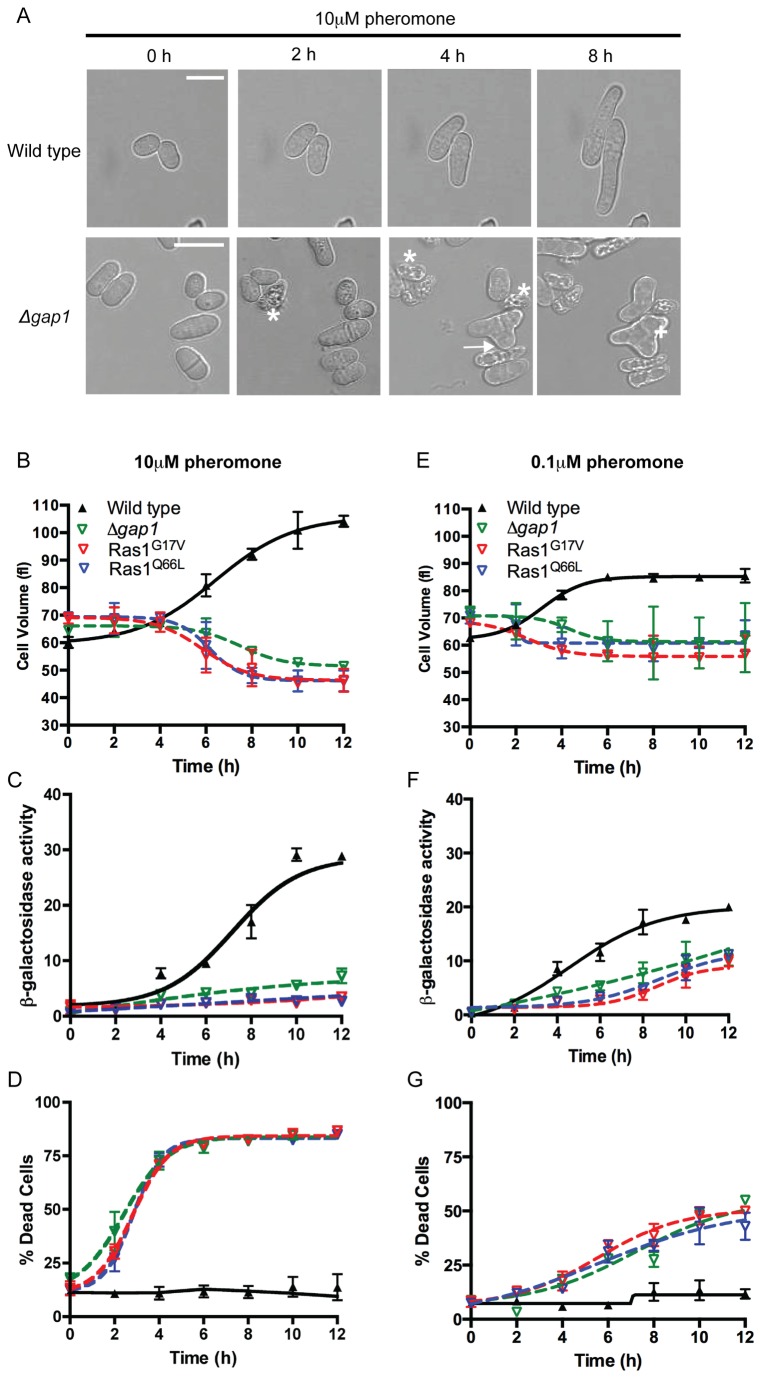
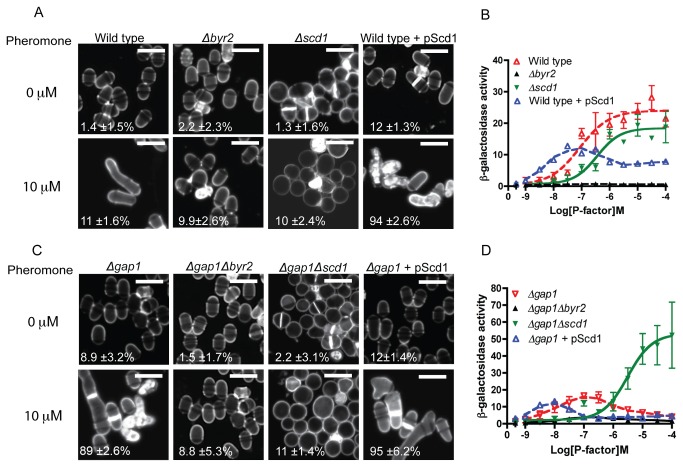
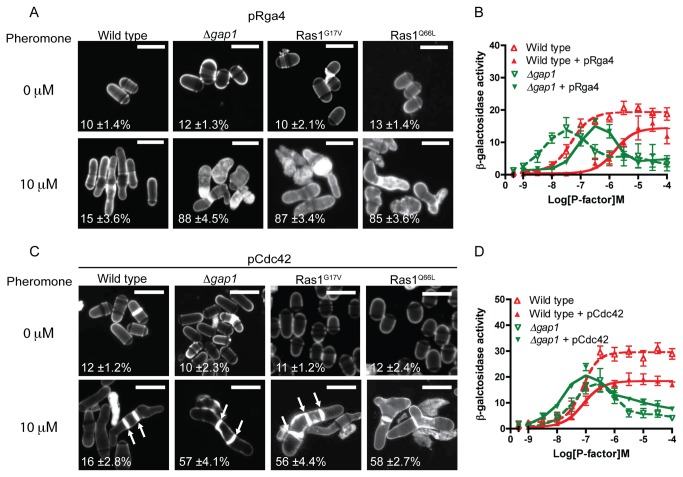
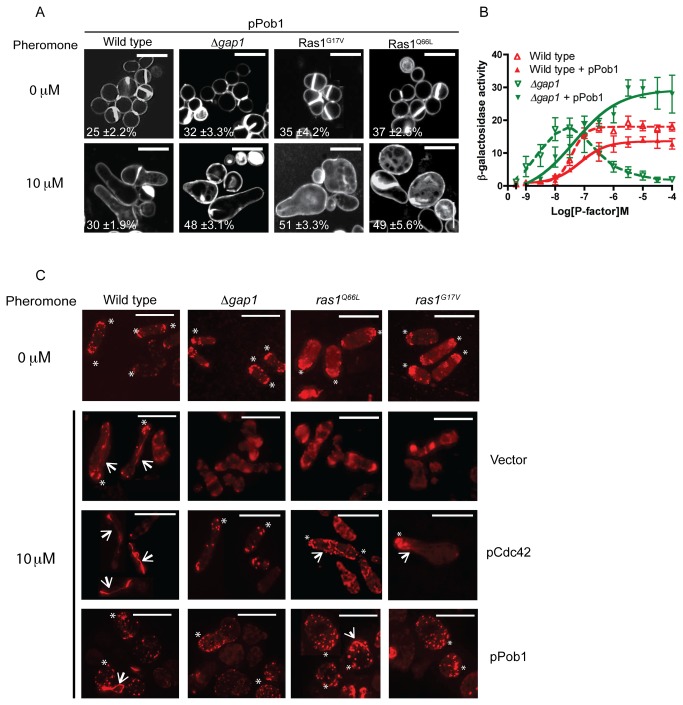
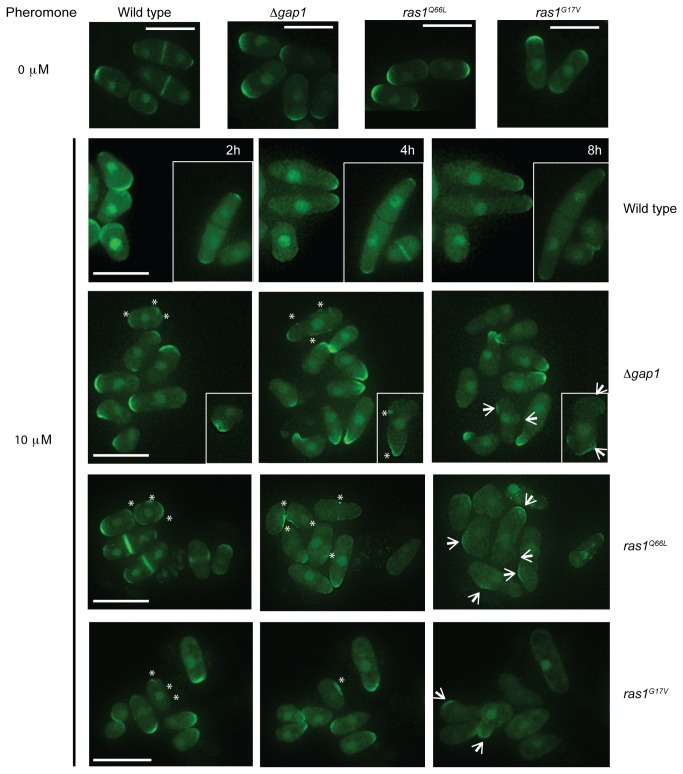
The spatial and temporal control of polarity is fundamental to the survival of all organisms. Cells define their polarity using highly conserved mechanisms that frequently rely upon the action of small GTPases, such as Ras and Cdc42. Schizosaccharomyces pombe is an ideal system with which to study the control of cell polarity since it grows from defined tips using Cdc42-mediated actin remodeling. Here we have investigated the importance of Ras1-GTPase activity for the coordination of polarized cell growth during fission yeast mating. Following pheromone stimulation, Ras1 regulates both a MAPK cascade and the activity of Cdc42 to enable uni-directional cell growth towards a potential mating partner. Like all GTPases, when bound to GTP, Ras1 adopts an active conformation returning to an inactive state upon GTP-hydrolysis, a process accelerated through interaction with negative regulators such as GAPs. Here we show that, at low levels of pheromone stimulation, loss of negative regulation of Ras1 increases signal transduction via the MAPK cascade. However, at the higher concentrations observed during mating, hyperactive Ras1 mutations promote cell death. We demonstrate that these cells die due to their failure to coordinate active Cdc42 into a single growth zone resulting in disorganized actin deposition and unsustainable elongation from multiple tips. These results provide a striking demonstration that the deactivation stage of Ras signaling is fundamentally important in modulating cell polarity.


Conflict of interest statement

Competing Interests: The authors have declared that no competing interests exist.

Figures

Figure 1
Figure 1. Schematic representation of Ras1 signaling cascades.
Ras1 signals via two distinct effectors to control of both pheromone-inducible and routine cell growth pathways. In the absence of pheromone the GEF, Efc25 promotes GDP for GTP exchange on Ras1. Through a complex with a Rho-GEF, Scd1, Ras1-GTP activates the essential G protein, Cdc42 so allowing polarized cell growth, faithful chromosome segregation and cell division. A second GEF for Cdc42, Gef1, is required to initiate bipolar growth but is not activated by Ras1. Upon pheromone stimulation, Ras1 activation is increased through interaction with another Ras1-GEF, Ste6. This pool of Ras1-GTP propagates the transcriptional response (acting via a second effector, Byr2 and a MAPK cascade). Pheromone-activated Ras1 also induces further GTP exchange on Cdc42 through activation of Scd1 promoting unidirectional cell growth towards a mating partner. Ras1 and Cdc42 contain a slow intrinsic ability to hydrolyze GTP, but the reaction is accelerated through interaction with GAPs, Gap1 and Rga4 (shown in red). Cross-talk between the two pathways is highlighted with dashed arrows.
Figure 2
Figure 2. Gap1 interacts with Ras1-GTP following pheromone stimulation.
A, Δras1Δgap1 cells transformed with Gap1-YFP and CFP-Ras1 were treated with 10 μM pheromone and imaged to determine localization of the proteins and confirm an interaction using FRET. Pearson’s correlation coefficients (r) and regions of FRET were determined using the Image J FRET and colocalization plugin. Heat-map shows FRET efficiency low (black) to high (yellow). B, Quantified apparent FRET efficiency of cells as indicated, determined using FRET-SE (displayed as mean (±SEM) of 10 cells analyzed). FRET efficiency was significantly elevated after treatment with 10 μM pheromone. Statistical significance determined using a two-tailed Students’s t test; *** representing p < 0.001. C, FACS-based FRET analysis of cells described in A. Data shown are mean values (±SEM) of five independent experiments.
Figure 3
Figure 3. Gap1 requires pheromone-induced GTP-binding to interacts with Ras1-GTP.
A-D, Fission yeast strains containing various CFP-Ras1 mutations and Gap1-YFP were treated with 10 μM pheromone and imaged to determine localization of the proteins. Pearson’s correlation coefficients (r) were determined using the Image J colocalization plugin. A, Δras1Δgap1 cells transformed with Gap1-YFP and CFP-Ras1S22N, B, Δras1Δgap1Δmam2 cells containing Gap1-YFP and CFP-Ras1, C Δras1Δgap1 cells transformed with Gap1-YFP and CFP-Ras1G17V and D, Δras1Δgap1 cells containing Gap1-YFP and CFP-Ras1Q66L. E, Strains in A-D were analyzed using FACS-based FRET to demonstrate protein-protein interactions. Data shown are mean values (±SEM) of five independent experiments.
Figure 4
Figure 4. Ras1-GTP hydrolysis is essential during mating.
A, Populations of S. pombe (h+ and h-) cells were imaged and scored for sporulation (asterix). Scale bars 10 μm. Values shown are % mated cells within each population. B, Pheromone-dependent transcription as determined using the sxa2>lacZ reporter for strains indicated. Ras1 GTPase-deficient strains display an initial increase in sensitivity to pheromone (< 0.1 μM) but signal is reduced at saturating concentrations (> 0.1 μM). C, Bright field and calcofluor staining in indicated genotypes. Upon pheromone exposure, wild type cells elongate from a single tip however, Ras1 GTPase-deficient strains display multiple elongation tubes (arrows), enlarged vacuoles (cross) and increased deposits of cell wall material (arrowheads). D, Pheromone-dependent changes in cell viability. Unlike wild type cells, Ras1-GTPase-defective strains display dose-dependent increase in cell death. E, Pheromone-dependent reporter gene activity from B, corrected for the number of viable cells within the population as measured in D. F, Percentage cell death within mating mixes shown in A. Values are mean of triplicate determinations (± standard error from the mean (SEM)).
Figure 5
Figure 5. Ras1-GTP-Gap1 interaction is essential during pheromone-directed cell elongation.
A, Images of morphological changes upon 10 μM pheromone stimulation. Wild type cells elongate from a single tip, in contrast, the presence of lysed cells (asterix), multiple projection tips (arrows) and enlarged vacuoles (cross) was noted in Ras1 GTPase-defective strains. Scale bar 10 μm. See also Movies S1-4. B-D, Quantification of pheromone-dependent changes in morphology, gene transcription and cell viability following exposure to 10 μM pheromone. E-G, Quantification of pheromone-dependent changes in morphology, gene transcription and cell viability following exposure to 0.1 μM pheromone. All data is mean (±SEM) of three individual experiments.
Figure 6
Figure 6. Ras1-GTP hydrolysis is essential to mediate cell polarity but not MAPK signaling.
A and C, Calcofluor white staining of indicated strains treated with 10 μM pheromone. Scale bar 10 μm. Values shown are percentage loss of cell viability for each population. B and D, Pheromone-dependent transcription as determined using the sxa2>lacZ reporter for the stains indicated. Removal of Scd1 from cells lacking Gap1 prevented pheromone-induced cell death while enabling an elevated transcriptional response. All values are mean of triplicate determinations (±SEM).
Figure 7
Figure 7. Pheromone-induced cell death is due to reduced Cdc42 signal transduction.
A, and C Values shown are percentage loss of cell viability. Scale bar 10 μm A, Calcofluor white staining of cells from indicated genotypes treated with pheromone. B, Pheromone-dependent transcription was quantified using the sxa2>lacZ reporter construct in strains expressing pRga4. C, Cells transformed with Cdc42 (pCdc42) were treated with pheromone, imaged as for A, many cells displayed multiple septa (arrows). D, Transcriptional response to pheromone was determined and revealed a slight restoration of maximal signal in the Δgap1 strain containing pCdc42. Values shown are mean of triplicate determinations (± SEM). Scale bar 10 μm.
Figure 8
Figure 8. Loss of Ras1-GTP hydrolysis prevents coordination of actin polymerization following pheromone stimulation.
A, Cells transformed with Pob1 (pPob1) were treated with pheromone and imaged following staining with calcofluor white. Values shown are percentage loss of cell viability. B, Pheromone-dependent reporter gene activity was quantified using the sxa2>lacZ reporter construct in strains expressing pPob1. Pob1 expression enabled an increased transcriptional response in strains lacking gap1. All values mean of triplicate determinations (±S.E.M). C, Rhodamine-phalloidin staining of actin wild type and strains containing indicated mutations. All mitotically growing cells (0 μM pheromone) display polarized actin at the cell tips (asterix). Following treatment with 10 μM pheromone elongating wild type cells exhibit defined actin patches (asterix) and cables (arrows). All mutant strains failed to coordinate actin polymerization and a single growth site was not defined. These defects were restored upon increased expression of pCdc42 or pPob1. Scale bar 10 μm.
Figure 9
Figure 9. Hyperactivation of Ras1 deregulates Cdc42-GTP localization following pheromone stimulation.
CRIB-GFP, a marker for Cdc42-GTP imaged following pheromone stimulation in indicated genotypes, representative images from Movies S5-8. CRIB-GFP is enriched at growing tips in all mitotically growing cells (0 μM). Following 2 h pheromone stimulation CRIB-GFP is enriched at a single tip in wild type cells enabling uni-directional growth to form a polarized conjugation tube. Cells containing hyperactivating Ras1 mutations display CRIB-GFP fluorescence at many discreet locations around the plasma membrane (asterix). These strains fail to coordinate a single site of active Cdc42 and attempt to elongate from multiple sites (arrows). Scale bar 10 μm.

Similar articles

Cited by

References

    1. Snell V, Nurse P (1993) Investigations into the control of cell form and polarity: the use of morphological mutants in fission yeast. Dev Suppl: 289-299. PubMed: 8049484. - PubMed
    1. Davey J (1998) Fusion of a fission yeast. Yeast 14: 1529-1566. doi:10.1002/(SICI)1097-0061(199812)14:16. PubMed: 9885154. - DOI - PubMed
    1. García P, Tajadura V, García I, Sánchez Y (2006) Role of Rho GTPases and Rho-GEFs in the regulation of cell shape and integrity in fission yeast. Yeast 23: 1031–1043. doi:10.1002/yea.1409. PubMed: 17072882. - DOI - PubMed
    1. Vanni C, Ottaviano C, Guo F, Puppo M, Varesio L et al. (2005) Constitutively active Cdc42 mutant confers growth disadvantage in cell transformation. Cell Cycle 4: 1675-1682. doi:10.4161/cc.4.11.2170. PubMed: 16294011. - DOI - PubMed
    1. Das M, Drake T, Wiley DJ, Buchwald P, Vavylonis D et al. (2012) Oscillatory Dynamics of Cdc42 GTPase in the Control of Polarized Growth. Science 13: 239-243. PubMed: 22604726. - PMC - PubMed

Publication types

MeSH terms