. 2013 Sep 17;8(9):e74350.
doi: 10.1371/journal.pone.0074350. eCollection 2013.

Aldh1-expressing endocrine progenitor cells regulate secondary islet formation in larval zebrafish pancreas

Affiliations

Aldh1-expressing endocrine progenitor cells regulate secondary islet formation in larval zebrafish pancreas

Hiroki Matsuda et al. PLoS One. .

Abstract

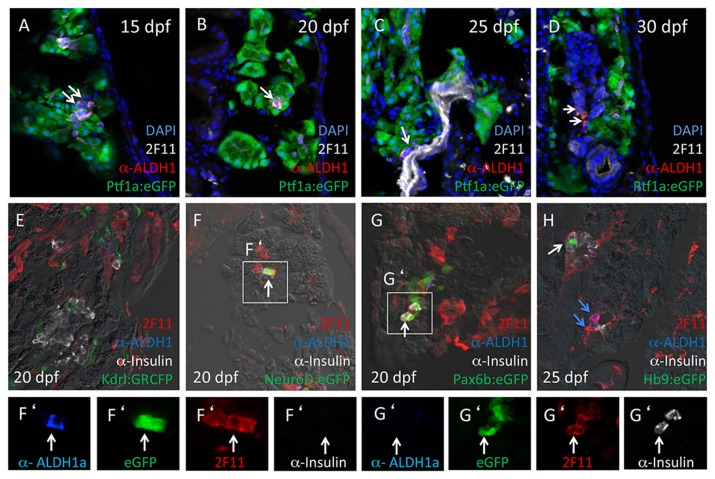
Aldh1 expression is known to mark candidate progenitor populations in adult and embryonic mouse pancreas, and Aldh1 enzymatic activity has been identified as a potent regulator of pancreatic endocrine differentiation in zebrafish. However, the location and identity of Aldh1-expressing cells in zebrafish pancreas remain unknown. In this study we demonstrate that Aldh1-expressing cells are located immediately adjacent to 2F11-positive pancreatic ductal epithelial cells, and that their abundance dramatically increases during zebrafish secondary islet formation. These cells also express neurod, a marker of endocrine progenitor cells, but do not express markers of more mature endocrine cells such as pax6b or insulin. Using formal cre/lox-based lineage tracing, we further show that Aldh1-expressing pancreatic epithelial cells are the direct progeny of pancreatic notch-responsive progenitor cells, identifying them as a critical intermediate between multi-lineage progenitors and mature endocrine cells. Pharmacologic manipulation of Aldh1 enzymatic activity accelerates cell entry into the Aldh1-expressing endocrine progenitor pool, and also leads to the premature maturation of these cells, as evidenced by accelerated pax6b expression. Together, these findings suggest that Aldh1-expressing cells act as both participants and regulators of endocrine differentiation during zebrafish secondary islet formation.


Conflict of interest statement

Competing Interests: The authors have declared that no competing interests exist.

Figures

Figure 1
Figure 1. Aldh1-expressing cells increase in number and are spatially associated with endocrine cells during secondary islet formation.
Expression of Aldh1 (red arrows) is compared with that of Insulin (white arrows), as assessed immunofluorescent labeling at 5 (A), 10 (B), 15 (C), 20 (D), 25 (E) and 30 dpf (F). (G) Quantification of the number of Aldh1-expressing cells located outside of the principle islet (black line), and their juxtaposition with Insulin-expressing cells (grey line). Values were derived from n=10 fish per developmental time point, with a minimum of 3 sections per fish. (*) and (**) indicate p<0.05 and p<0.01, respectively. Dotted white lines in (A) and (B) indicate region of principle islet; dotted white lines in (D) and (E) indicate region of pancreatic duct.
Figure 2
Figure 2. Aldh1 is expressed in NeuroDpos endocrine progenitor cells.
Expression of Aldh1 is compared with that of Pax6b:eGFP (pan-endocrine cell marker; A-D), Hb9:eGFP (early β cell marker; E-H) and NeuroD:eGFP (endocrine progenitor marker; I-L) at 15 (A, E and I), 20 (B, F and J), 25 (C, G and K) and 30 dpf (D, H and L). Note that Aldh1 is co-expressed with eGFP in NeuroD:eGFP fish (arrows), but not in Pax6b:eGFP and Hb9:eGFP fish. Dotted white lines in (E) indicate region of principle islet.
Figure 3
Figure 3. Aldh1-expressing cells express the pancreatic epithelial marker 2F11.
(A-D) All Aldh1-expressing cells co-express the pancreatic epithelial marker 2F11 (white arrows). (E) 2F11 does not label GRCFPpos vascular endothelial cells in Kdrl:GRCFP fish. (F-H) 2F11 labels both a subset of Insulinpos cells (G and G’) and eGFPpos cells in NeuroD:eGFP (F and F’), Pax6b:eGFP (G and G’) Hb9:eGFP (H) fish. White arrows in A-D indicate cells co-labeling for both 2F11 and Aldh1. White arrows in F and F’ indicate Insulin-negative cells co-expressing 2F11, Aldh1 and NeuroD:eGFP. White arrows in G and G’ indicate Aldh1-negative cell co-expressing Insulin, 2F11 and Pax6:eGFP. White arrow in H indicates Aldh1-negative cell expressing Insulin, 2F11 and Hb9:eGFP; blue arrows indicate Insulin-negative, Hb9:eGFP-negative cells expressing 2F11 and Aldh1.
Figure 4
Figure 4. Cell proliferation among Aldh1- and 2F11-expressing cells.
EdU signals (white arrows) were detected in subsets 2F11pos cells at 15 (A), 20 (B) and 25 dpf (C). (D) Cells co-expressing Aldh1 and 2F11 (blue arrows) are not proliferative, but are localized in the adjacent to Aldh1-negative, EdUpos, 2F11pos cells (white arrows). (E and E’) Cells co-expressing NeuroD and 2F11 (yellow arrows) are not proliferative but are localized adjacent to NeuroD:eGFP-negative, EdUpos, 2F11pos cells (white arrows). (F and F’) Detailed geometry of 2F11, Aldh1, NeuroD:eGFP expression in association with EdU incorporation. White arrows indicate EdU pos/2F11 pos/Aldh1 neg/NeuroD:eGFPneg cells. Blue arrows indicate EdUneg /2F11 pos/Aldh1 pos/NeuroD:eGFPpos cells. Yellow arrows indicate EdU neg/2F11 pos/Aldh1 neg/NeuroD:eGFPpos cells. Green arrows indicate EdU neg/2F11neg /Aldh1 neg/NeuroD:eGFPpos cells.
Figure 5
Figure 5. Aldh1-expressing cells are derived from Notch-responsive progenitor cells.
(A) Schematic timeline for 4OHT-induced lineage labeling. Tp1bglob:CreER T2/βactin:loxp-stop-loxp-hmgb-mCherry fish were treated with either 1% EtOH (B and D; negative controls) or with 4-hydroxy-tamoxifen (4OHT) between either 3-5 dpf (B and C) or 18-20 dpf (D and E), and then sacrificed for analysis at 25 dpf. Cells carrying the Tp1bglob:CreERT2 lineage label display red nuclei. (C) 2F11 pos/Aldh1pos cells arise from Notch-responsive cells labeled between 3-5 dpf (blue arrows). (E) Notch-responsive cells labeled between 18-20 dpf give rise to Aldh1pos (blue arrows), Pax6:eGFP+ endocrine cells (green arrows) and ductal cells (white arrows). F, Schematic depiction of proposed lineage relationships between Notch-responsive progenitors (Notch-ON) and cells expressing 2F11, Aldh1, NeuroD and Pax6b during secondary islet formation. Notch-ON cells expressing 2F11 (red) give rise to Notch-OFF, 2F11pos, NeuroDpos, Aldh1pos cells (blue), which then inactivate Aldh1 and activate Pax6 expression (green) prior to undergoing terminal endocrine differentiation (orange).
Figure 6
Figure 6. Inhibition of Aldh1 enzymatic activity increases the number of Aldh1- and NeuroD-expressing endocrine progenitor cells and induces their premature differentiation.
Panels to the right of merged images represent corresponding single channel images. (A and B) NeuroD:eGFP/Tp1:hmgb-mCherry fish were treated with DMSO (A) or DEAB (B) at 72-120 hpf. DEAB treatment increased the number of Notch-responsive cells also expressing NeuroD:eGFP (red arrows). (C) Quantification of the number of eGFPpos and/or mCherrypos cells in 1000 µm3 of 2F11pos tissue in NeuroD:eGFP/Tp1:hmgb-mCherry fish treated with DMSO or DEAB between 72-120 hpf. Inhibition of Aldh1a induced NeuroD:eGFP expression in Notch-responsive cells. Values indicate mean + SEM, with minimum of 20 larvae analyzed for each condition. (*) indicates p<0.05. (D) Quantification of the number of Aldh1-expresing cells in 100,000 µm3 of 2F11pos tissue in NeuroD:eGFP/Tp1:hmgb-mCherry fish treated with DMSO or DEAB treatment between 72-120 hpf. Values indicate mean + SEM, with minimum of 20 larvae analyzed for each condition. (*) indicates p<0.05. (E and F) NeuroD:eGFP/Tp1:hmgb-mCherry fish were treated with DMSO (E) or DEAB (F) at 18-20 dpf. DEAB treatment increased the number of Notch-responsive cells also expressing NeuroD:eGFP (red arrows), and these cells were frequently adjacent to Aldh1-expressing cells (blue arrows). (G and H) Pax6b:eGFP/Tp1:hmgb-mCherry fish were treated with DMSO (G) or DEAB (H) between 18-20 dpf. DEAB treatment activated Pax6:eGFP expression in Aldh1-expressing cells. (I) Quantification of number of eGFPpos and/or mCherrypos cells in 1000 µm2 of 2F11pos tissue in NeuroD:eGFP/Tp1:hmgb-mCherry or Pax6b:eGFP/Tp1:hmgb-mCherry fish treated with DMSO or DEAB between 18-20 dpf. NeuroD:eGFP, but not Pax6:eGFP expression is activated within Notch responsive cells following DEAB treatment. In contrast, Pax6:eGFP but not NeuroD:eGFP expression is induced in cells not expressing Tp1:hmgb1-mCherry. (*) indicates p<0.05, with n=8 fish per condition and a minimum of 3 sections analyzed per fish. (J) Quantification of Aldh1-expressing cells also expressing either NeuroD:eGFP or Pax6:eGFP following treatment with either DMSO or DEAB between 18-20 dpf. DAEB treatment increases the number of cells Aldh1-expressing cells also expressing either NeuroD:eGFP or Pax6:eGFP. (*) and (**) indicates p<0.05 and p<0.01, respectively. n=10 fish per condition and a minimum of three sections analyzed per fish.
Figure 7
Figure 7. Proposed model for the role of Aldh1-expressing cells in zebrafish secondary islet formation.
Notch-ON cells expressing 2F11 (red) give rise to Notch-OFF, 2F11pos, NeuroDpos Aldh1pos cells (blue), which then inactivate Aldh1 and activate Pax6 expression (green) prior to undergoing terminal endocrine differentiation (orange). Aldh1 enzymatic activity and associated retinoic acid production inhibit the progression of Notch-ON cells into the NeuroDpos, Aldh1pos endocrine progenitor pool, as well as the progressive differentiation of NeuroDpos, Aldh1pos cells.

Similar articles

Cited by

References

    1. Rieck S, Bankaitis ED, Wright CV (2012) Lineage determinants in early endocrine development. Semin Cell Dev Biol 23: 673-684. doi:10.1016/j.semcdb.2012.06.005. PubMed: 22728667. - DOI - PMC - PubMed
    1. Seymour PA, Sander M (2011) Historical perspective: beginnings of the beta-cell: current perspectives in beta-cell development. Diabetes 60: 364-376. doi:10.2337/db10-1068. PubMed: 21270248. - DOI - PMC - PubMed
    1. Murtaugh LC (2007) Pancreas and beta-cell development: from the actual to the possible. Development 134: 427-438. PubMed: 17185316. - PubMed
    1. Wang A, Sander M (2012) Generating cells of the gastrointestinal system: current approaches and applications for the differentiation of human pluripotent stem cells. J Mol Med (Berl) 90: 763-771. doi:10.1007/s00109-012-0923-y. PubMed: 22714642. - DOI - PubMed
    1. Huang H, Vogel SS, Liu N, Melton DA, Lin S (2001) Analysis of pancreatic development in living transgenic zebrafish embryos. Mol Cell Endocrinol 177: 117-124. doi:10.1016/S0303-7207(01)00408-7. PubMed: 11377827. - DOI - PubMed

Publication types

MeSH terms

LinkOut - more resources