. 2014 Jan;77(2):322-37.
doi: 10.1111/tpj.12358. Epub 2013 Dec 6.

A multi-colour/multi-affinity marker set to visualize phosphoinositide dynamics in Arabidopsis

Affiliations

A multi-colour/multi-affinity marker set to visualize phosphoinositide dynamics in Arabidopsis

Mathilde Laetitia Audrey Simon et al. Plant J. 2014 Jan.

Abstract

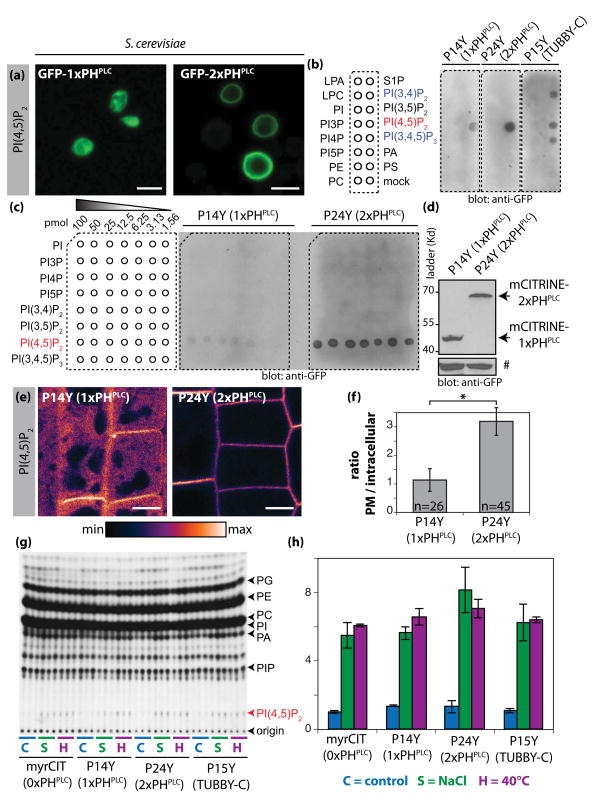
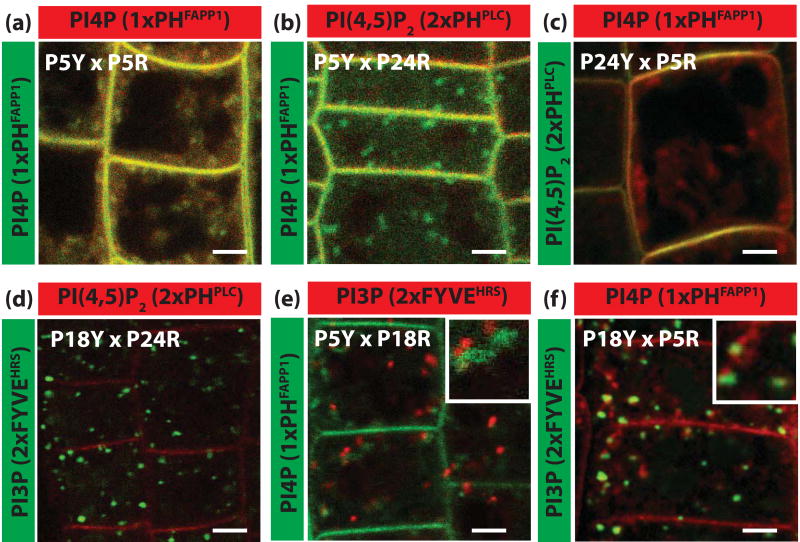
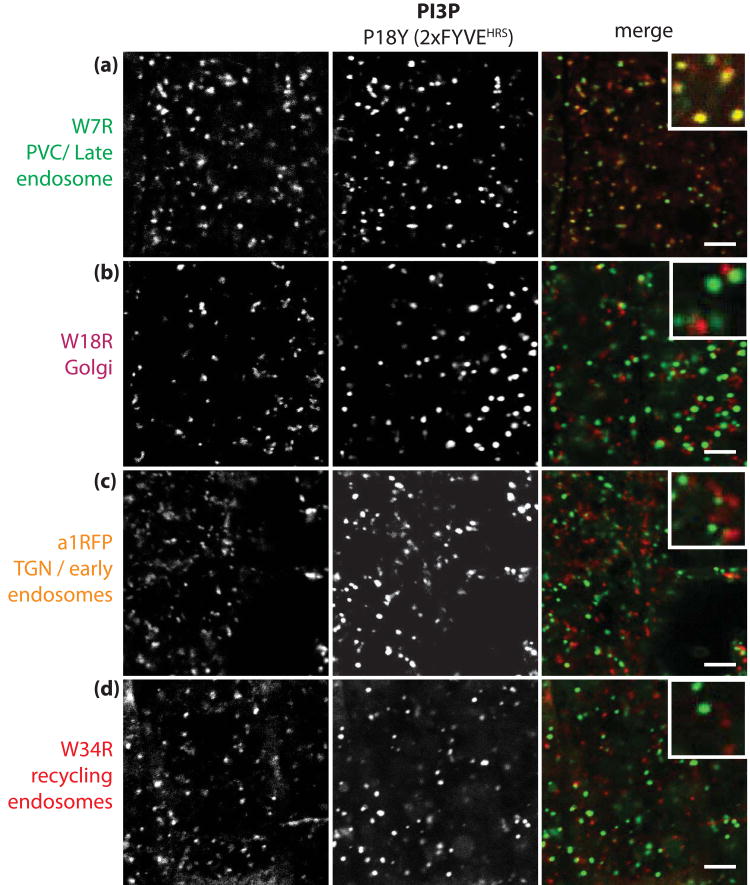
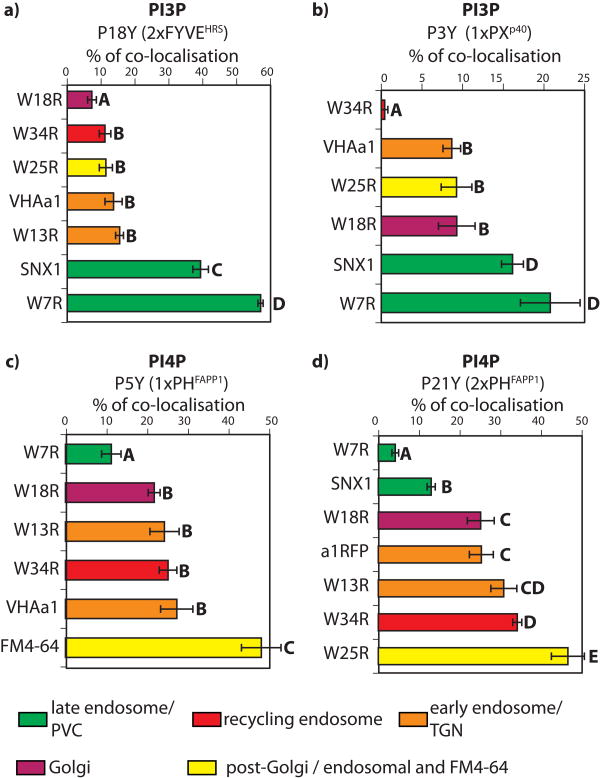
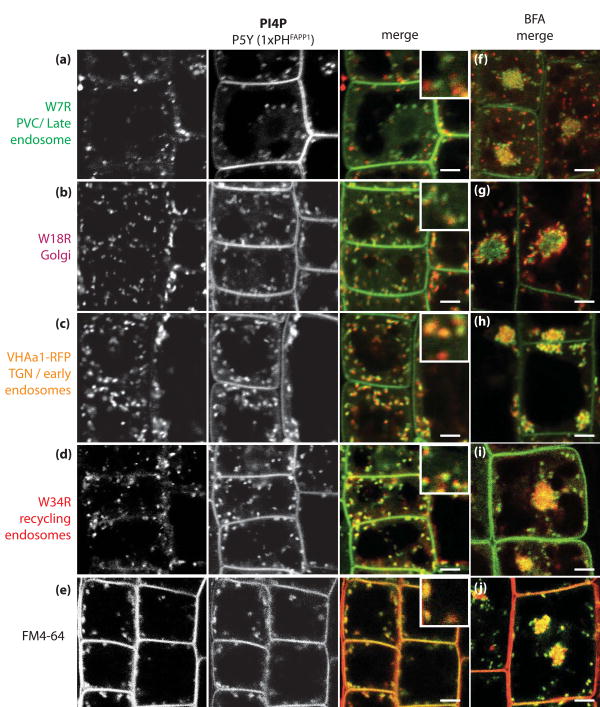
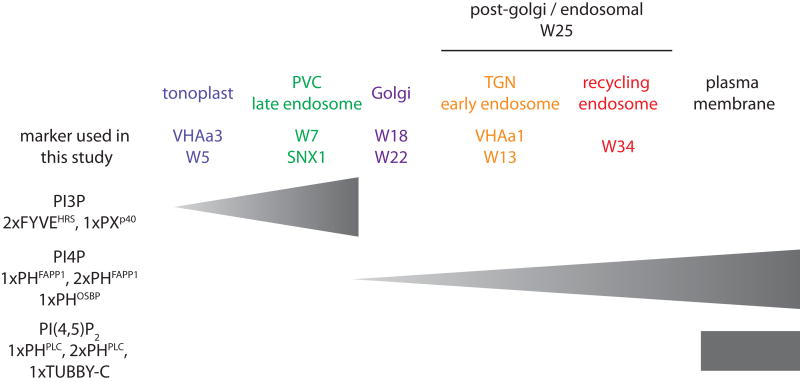
Phosphatidylinositolphosphates (PIPs) are phospholipids that contain a phosphorylated inositol head group. PIPs represent a minor fraction of total phospholipids, but are involved in many regulatory processes, such as cell signalling and intracellular trafficking. Membrane compartments are enriched or depleted in specific PIPs, providing a unique composition for these compartments and contributing to their identity. The precise subcellular localization and dynamics of most PIP species is not fully understood in plants. Here, we designed genetically encoded biosensors with distinct relative affinities and expressed them stably in Arabidopsis thaliana. Analysis of this multi-affinity 'PIPline' marker set revealed previously unrecognized localization of various PIPs in root epidermis. Notably, we found that PI(4,5)P2 is able to localize PIP2 -interacting protein domains to the plasma membrane in non-stressed root epidermal cells. Our analysis further revealed that there is a gradient of PI4P, with the highest concentration at the plasma membrane, intermediate concentration in post-Golgi/endosomal compartments, and the lowest concentration in the Golgi. Finally, we also found a similar gradient of PI3P from high in late endosomes to low in the tonoplast. Our library extends the range of available PIP biosensors, and will allow rapid progress in our understanding of PIP dynamics in plants.

Keywords: Arabidopsis thaliana; endosome; lipid binding domain; lipid signalling; membrane trafficking; phosphoinositide; sensor; technical advance.


Figures

Figure 1
Figure 1. Strategy for the generation of the “PIPline” collection
All PIP biosensor constructs (hereafter referred to as “PIPline”) were cloned into multisite gateway destination vectors (pB7m34GW, pH7m34GW and pK7m34GW). All the PIPlines are expressed under the control of the mild constitutive UBQ10 promoter. Each PIPline has been ascribed a number (n). Yellow PIPlines are named PnY, red PIPline PnR, and cyan PIPline PnC. 1xLBD means that only one LDB is fused to the fluorescent protein; 2xLBD means that two identical LBDs are fused in tandem dimer with the fluorescent protein.
Figure 2
Figure 2. Localisation of the LBD used in this study in yeast and human cells
Confocal pictures of S. cerevisiae (a) and human hepatocarcinoma cell line Huh-7 (b) expressing GFP-tagged LBD. Inset in (b) are immuno-localisation showing that 1xPXp40 (green) co-localises with the early endosome marker EEA1 (red) and that 1xPHFAPP1/1xPHOSBP (green) co-localise with the Golgi marker GM130 (red). Blue: Hoechst-stained nuclei. Scale bars 5 μm.
Figure 3
Figure 3. Localisation of PI3P, PI4P and PI(4,5)P2 in Arabidopsis root epidermis
(a-f) Confocal pictures of Arabidopsis root epidermal cells expressing various CITRINE-tagged LBDs: (a) CITRINE-1xFYVEHRS, (b) 1xPXp40-CITRINE, (c) CITRINE-1xPHFAPP1, (d) CITRINE-1xPHOSBP, (e) CITRINE-1xPHPLC, (f) CITRINE-1xTUBBY-C. The respective PIPline name is indicated in the top left corner. Scale bars 5 μm.
Figure 4
Figure 4. Engineering and analysis of low and high avidity PI3P and PI4P biosensors in Arabidopsis root epidermal cells
(a) Schematic representation of the strategy used to obtain low and high avidity PIP biosensors. (b) Confocal pictures of Arabidopsis root epidermal cells expressing CITRINE-tagged 1xFYVEHRS and 2xFYVEHRS. (c) Graph representation of the ratio of 1xFYVEHRS (P1Y) and 2xFYVEHRS (P18Y) endosomal signal relative to the levels of cytosolic signal. (d) Confocal pictures of Arabidopsis root epidermal cells expressing CITRINE-tagged 1xPHFAPP1 and 2xPHFAPP1. (e) Graph representation of the ratio of 1xPHFAPP1 (P5Y) and 2xPHFAPP1 (P21Y) at the PM relative to the intracellular levels. Confocal pictures are colour-coded in pixel intensity following the LUT scale shown at the bottom. Scale bars 5 μm. Error bars represent standard deviation (s.d.). Asterisk mark: statistical difference (p<0.05) according to Student's t-test. n is the number of cells used in each quantitative analysis.
Figure 5
Figure 5. PI(4,5)P2 is able to drive PIP2-interacting domains to the PM in non-stressed root epidermal cells
(a) Confocal pictures of S. cerevisiae expressing GFP-1xPHPLC (left) and GFP-2xPHPLC (right). Scale bars 5 μm. (b) Protein-lipid overlay assay with CITRINE-1xPHPLC (left), CITRINE-2xPHPLC (middle) and CITRINE-TUBBY-C (right) proteins extracted from P14Y, P15Y and P24Y transgenic plants. The position of each lipid is indicated on the map on the left panel. (c) Protein-lipid overlay assay with the same quantities of CITRINE-1xPHPLC (left), CITRINE-2xPHPLC (right) extracted from P14Y and P24Y transgenic lines. The position and quantity of each lipid is indicated on the map on the left panel. (d) Western blot showing similar expression level of transgenic proteins. The non-specific band indicated by a sharp sign serves as a loading control. (e) Confocal pictures of Arabidopsis root epidermal cells expressing CITRINE-tagged 1xPHPLC and 2xPHPLC. Confocal pictures are colour-coded in pixel intensity following the LUT scale shown at the bottom. Scale bars 5 μm. (f) Graph representing the ratio of 1xPHPLC (P14Y) and 2xPHPLC (P24Y) at the PM relative to the intracellular signal. Error bars represent standard deviation (s.d.). Asterisk mark indicates statistical difference (p<0.05) according to Student's t-test. n is the number of cells used in each quantitative analysis. (g) Alkaline TLC profile of Arabidopsis seedlings labelled for 16H with 32Pi and then incubated for 30 min at: 22°C in control buffer (C = control, blue), 22°C in control buffer supplemented with 250mM NaCl (S = Salt, green) or 40°C in control buffer (H = Heat, purple). Each lane is a pool of 3 seedlings and each condition was analysed in triplicate using the following genotypes: myristoylated 2xCITRINE (myrCIT) as a non-PIP2 binding control (0xPHPLC), P14Y (CITRINE-1xPHPLC), P24Y (CITRINE-2xPHPLC) and P15Y (CITRINE-TUBBY-C). An autoradiograph of a typical experiment is shown. (h) Quantification of PIP2 levels by densitometry of the autoradiograph shown in (g). The fold change was calculated relative to levels of PI(4,5)P2 present in myrCIT (0xPHPLC) in the control condition from two independent experiments.
Figure 6
Figure 6. Simultaneous labelling of two PIP species in Arabidopsis root epidermis
(a-f) Confocal pictures of root epidermal cells co-expressing one CITRINE- and one CHERRY-tagged PIPline. Each image is an overlay of the green channel (CITRINE) and red channel (CHERRY), co-localisation being visualised by the yellow colour. (a) CITRINE-1xPHFAPP1 x 2xCHERRY-1xPHFAPP1, (b) CITRINE-1xPHFAPP1 x 2xCHERRY-2xPHPLC, (c) CITRINE-2xPHPLC x 2xCHERRY-1xPHFAPP1, (d) CITRINE-2xFYVEHRS x 2xCHERRY-2xPHPLC, (e) CITRINE-1xPHFAPP1 x 2xCHERRY-2xFYVEHRS, (f) CITRINE-2xFYVEHRS x 2xCHERRY-1xPHFAPP1. The names of the PIPlines used in each cross are indicated at the top and left of each panel. Scale bars 5 μm.
Figure 7
Figure 7. CITRINE-2xFYVEHRS localises to late endosomes in Arabidopsis root epidermis
(a-d) Confocal pictures of root epidermal cells co-expressing CITRINE-2xFYVEHRS with intracellular compartment markers fused with a red fluorescent protein: (a) W7R (late endosomes/PVC), (b) W18R (Golgi apparatus), (c) VHAa1-RFP (early endosomes/TGN) and (d) W34R (recycling endosomes). Left pictures correspond to the compartment markers, middle pictures correspond to CITRINE-2xFYVEHRS (both depicted in grey scale for increased contrast), while the right pictures correspond to the overlay of both channels with the compartment markers in red and the 2xFYVEHRS sensor in green. Scale bars 5 μm.
Figure 8
Figure 8. Quantitative analysis of intra-cellular co-localisations
Quantitative co-localisation data obtained by object-based analysis between various compartment markers and 2xFYVEHRS (a), 1xPXp40 (b), 1xPHFAPP1 (c), 2xPHFAPP1 (d). Error bars represent standard deviation. Bold capital letters indicate statistical difference (p<0.05) according to Steel-Dwass-Critchlow-Fligner bilateral test. Co-localisations were quantified in 30 cells per conditions only on intra-cellular signals (i.e. excluding the PM).
Figure 9
Figure 9. Intra-cellular CITRINE-1xPHFAPP1 localises to post-golgi/endosomal compartments in Arabidopsis root epidermis
(a-d) Confocal pictures of root epidermal cells co-expressing CITRINE-1xPHFAPP1 with intracellular compartment markers fused with a red fluorescent protein: (a) W7R (late endosomes/PVC), (b) W18R (Golgi apparatus), (c) VHAa1-RFP (early endosomes/TGN) and (d) W34R (recycling endosomes). (e) Co-localisation with red endocytic tracer FM4-64. Left pictures correspond to the compartment markers (a-d) or FM6-64 (e), middle picture correspond to CITRINE-1xPHFAPP1 (both depicted in grey scale for increased contrast), while the two right columns of pictures correspond to the overlay of both channels with the compartment markers in red and the 1xPHFAPP1 sensor in green. (f-j) Co-localisation between CITRINE-1xPHFAPP1 and the corresponding compartment markers in the presence of BFA at 25 μM for 1 hour. Scale bars 5 μm.
Figure 10
Figure 10. Summary of PI3P, PI4P and PI(4,5)P2 localisation in Arabidopsis epidermal cells
The gradient of intensity of localisation in intracellular compartments is represented by the broadness of the triangle.

Similar articles

Cited by

References

    1. Ago T, Takeya R, Hiroaki H, Kuribayashi F, Ito T, Kohda D, Sumimoto H. The PX Domain as a Novel Phosphoinositide- Binding Module. Biochem Biophys Res Commun. 2001;287:733–738. - PubMed
    1. Balla A, Tuymetova G, Tsiomenko A, Várnai P, Balla T. A Plasma Membrane Pool of Phosphatidylinositol 4- Phosphate Is Generated by Phosphatidylinositol 4-Kinase Type-III Alpha: Studies with the PH Domains of the Oxysterol Binding Protein and FAPP1. Molecular biology of the cell. 2005;16:1282–1295. - PMC - PubMed
    1. Balla T. Phosphoinositides: tiny lipids with giant impact on cell regulation. Physiological Reviews. 2013;93:1019–1137. - PMC - PubMed
    1. Balla T, Szentpetery Z, Kim YJ. Phosphoinositide signaling: new tools and insights. Physiology (Bethesda) 2009;24:231–244. - PMC - PubMed
    1. Bravo J, Karathanassis D, Pacold CM, Pacold ME, Ellson CD, Anderson KE, Butler PJ, Lavenir I, Perisic O, Hawkins PT, Stephens L, Williams RL. The crystal structure of the PX domain from p40(phox) bound to phosphatidylinositol 3-phosphate. Mol Cell. 2001;8:829–839. - PubMed

Publication types

MeSH terms