. 2013 Oct 22:14:725.
doi: 10.1186/1471-2164-14-725.

Positively correlated miRNA-mRNA regulatory networks in mouse frontal cortex during early stages of alcohol dependence

Affiliations

Positively correlated miRNA-mRNA regulatory networks in mouse frontal cortex during early stages of alcohol dependence

Yury O Nunez et al. BMC Genomics. .

Abstract

Background: Although the study of gene regulation via the action of specific microRNAs (miRNAs) has experienced a boom in recent years, the analysis of genome-wide interaction networks among miRNAs and respective targeted mRNAs has lagged behind. MicroRNAs simultaneously target many transcripts and fine-tune the expression of genes through cooperative/combinatorial targeting. Therefore, they have a large regulatory potential that could widely impact development and progression of diseases, as well as contribute unpredicted collateral effects due to their natural, pathophysiological, or treatment-induced modulation. We support the viewpoint that whole mirnome-transcriptome interaction analysis is required to better understand the mechanisms and potential consequences of miRNA regulation and/or deregulation in relevant biological models. In this study, we tested the hypotheses that ethanol consumption induces changes in miRNA-mRNA interaction networks in the mouse frontal cortex and that some of the changes observed in the mouse are equivalent to changes in similar brain regions from human alcoholics.

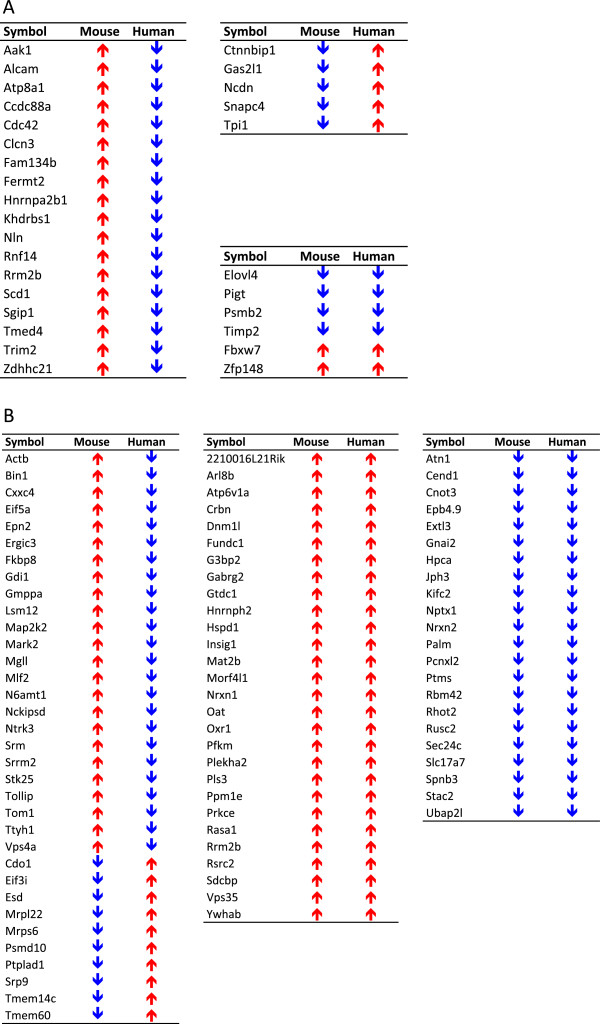
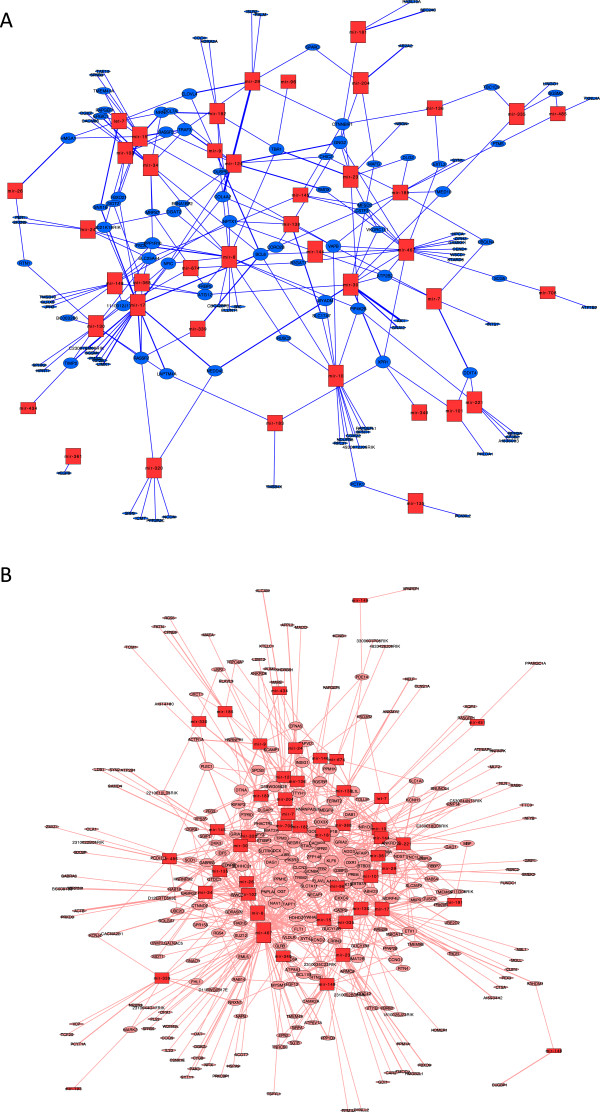
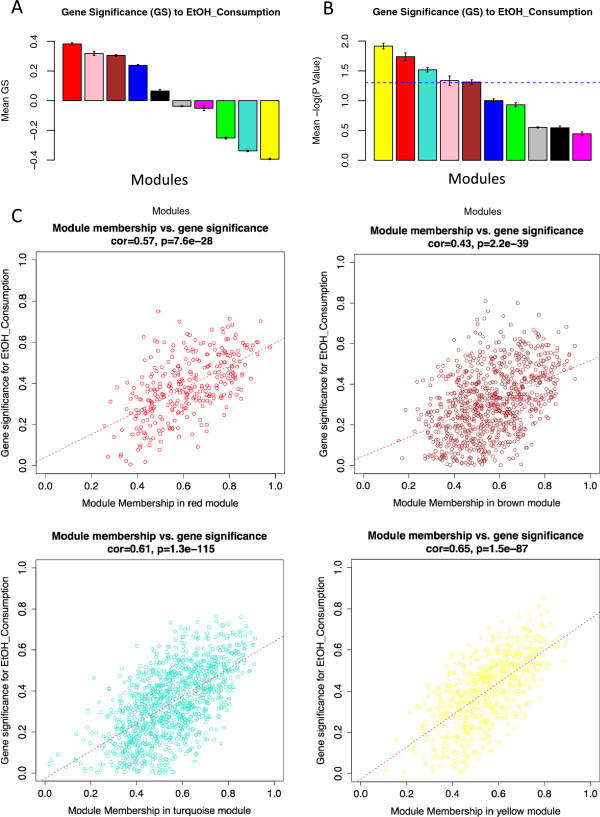
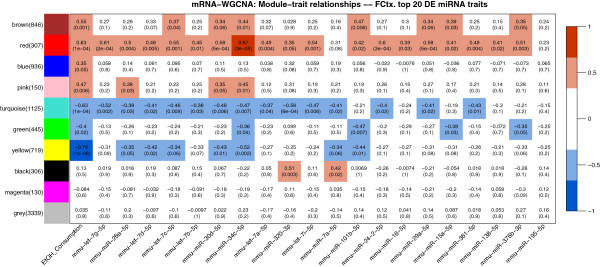
Results: miRNA-mRNA interaction networks responding to ethanol insult were identified by differential expression analysis and weighted gene coexpression network analysis (WGCNA). Important pathways (coexpressed modular networks detected by WGCNA) and hub genes central to the neuronal response to ethanol are highlighted, as well as key miRNAs that regulate these processes and therefore represent potential therapeutic targets for treating alcohol addiction. Importantly, we discovered a conserved signature of changing miRNAs between ethanol-treated mice and human alcoholics, which provides a valuable tool for future biomarker/diagnostic studies in humans. We report positively correlated miRNA-mRNA expression networks that suggest an adaptive, targeted miRNA response due to binge ethanol drinking.

Conclusions: This study provides new evidence for the role of miRNA regulation in brain homeostasis and sheds new light on current understanding of the development of alcohol dependence. To our knowledge this is the first report that activated expression of miRNAs correlates with activated expression of mRNAs rather than with mRNA downregulation in an in vivo model. We speculate that early activation of miRNAs designed to limit the effects of alcohol-induced genes may be an essential adaptive response during disease progression.


Figures

Figure 1
Figure 1
Upregulation of frontal cortex miRNAs in response to alcohol is conserved from mice to humans. Venn diagram highlights common set of 14 upregulated miRNA families in prefrontal cortex of human alcoholics [11] and ethanol-treated mice (current study). P value empirically assessed after 100,000 Monte Carlo simulations. PFC: prefrontal cortex, FCtx: frontal cortex.
Figure 2
Figure 2
Conserved differential gene expression in response to ethanol with implicit model differences in direction of change. A: Venn diagram highlights common set of 29 differentially expressed genes in prefrontal cortex of human alcoholics (as reported by [14]) and ethanol-treated mice (current results); B: Directionality of expression changes in common set of 29 differentially expressed genes referred to in A; C: Venn diagram highlights common set of 84 differentially expressed genes in prefrontal cortex of human alcoholics (as reported by [15]) and ethanol-treated mice (current study); D: Directionality of expression change in common set of 84 differentially expressed genes referred to in C. P values empirically assessed after 105 and 107 Monte Carlo simulations, respectively.
Figure 3
Figure 3
Alcohol-induced miRNA-mRNA interaction networks. A: Interaction network among upregulated miRNAs (red squares) and downregulated mRNAs (blue circles); average number of neighbors 2.95. B: Interaction network among upregulated miRNAs (red squares) and upregulated mRNAs (pink circles); average number of neighbors 4.97. The average number of neighbors represents the average number of links (edges) a node has to other nodes. The size of the nodes is proportional to the number of edges (interactions, represented as lines) for each node.
Figure 4
Figure 4
Gene dendrogram, module assignment, and correlation to individual traits of interest. The network was created from the weighted correlation matrix generated by WGCNA, by first calculating the adjacency matrix and then calculating topological overlap (TO) to hierarchically cluster genes into coexpression modules (see Materials and Methods). Final module assignments were made based on module membership. (Upper) Cluster dendrogram groups genes into distinct modules. The y-axis represents a dissimilarity distance (1 - TO). Dynamic tree cutting was used to determine modules, by dividing the dendrogram at significant branch points. (Lower) Correlation between individual genes and traits of interest (ethanol consumption and miRNA expression) with FDR < 0.10 are shown as color coded lines: red line indicates positive correlation and blue line indicates negative correlation). Red and turquoise modules (encased by rectangles) appear preferentially targeted by differentially expressed miRNAs.
Figure 5
Figure 5
Identifying alcohol-relevant modules by average gene significance and module membership. A: Bar plot of the average gene significance for each detected module, equivalent to the average correlation among module genes and the ethanol consumption trait; B: Bar plot of the average -log P value of the gene significance; C: Plot of correlations between gene significance (GS) and module membership (MM) for representative alcohol-related modules. Color-coding is equivalent to module names. * Five modules (yellow, red, turquoise, pink, and brown) have an average P < 0.05 [-lg(P value) > 1.3].
Figure 6
Figure 6
Correlations of module eigengenes vs. consumption and top 20 differentially expressed miRNA traits. Significant miRNA targeting is evident primarily against red and turquoise modules. Brown and yellow modules show significant correlations to a lower but relevant number of differentially expressed miRNAs.
Figure 7
Figure 7
Coexpression networks for red module. A: coexpression network of gene-gene interactions among genes with high GS and high MM. Node width is proportional to node connectivity (number of edges/interacting partners), and edge size is proportional to the weight of the particular interaction; B: network of correlated miRNA-mRNA expression profiles (node width is proportional to the connectivity of the node, and edge size is proportional to the correlation between miRNA and mRNA expression). Pink ovals represent upregulated genes; red rectangles represents upregulated miRNAs.

Similar articles

Cited by

References

    1. Gorini G, Bell RL, Mayfield RD. Molecular Targets of Alcohol: Action Translational Research for Pharmacotherapy Development and Screening. Prog Mol Biol Transl Sci. 2011;14:293–347. doi:10.1016/B978-0-12-385506-0.00007-7. - PMC - PubMed
    1. Farris SP, Miles MF. Ethanol Modulation of Gene Networks: Implications for Alcoholism. Neurobiol Dis. 2011. pp. 1–7. doi:10.1016/j.nbd.2011.04.013. - PMC - PubMed
    1. Ron D, Messing RO. Signaling Pathways Mediating Alcohol Effects. Current Topics in Behavioural Neurosciences. 2011. doi:10.1007/7854_2011_161. - PMC - PubMed
    1. Nunez YO, Mayfield RD. Understanding Alcoholism Through microRNA Signatures in Brains of Human Alcoholics. Front Genet. 2012;14:43. doi:10.3389/fgene.2012.00043. - PMC - PubMed
    1. Mayfield RD, Harris RA, Schuckit MA. Genetic Factors Influencing Alcohol Dependence. Br J Pharmacol. 2008;14(2):275–287. doi:10.1038/bjp.2008.88. - PMC - PubMed

Publication types