

Phylotranscriptomics: saturated third codon positions radically influence the estimation of trees based on next-gen data
- PMID: 24148944
- PMCID: PMC3845638
- DOI: 10.1093/gbe/evt157
Phylotranscriptomics: saturated third codon positions radically influence the estimation of trees based on next-gen data
Abstract
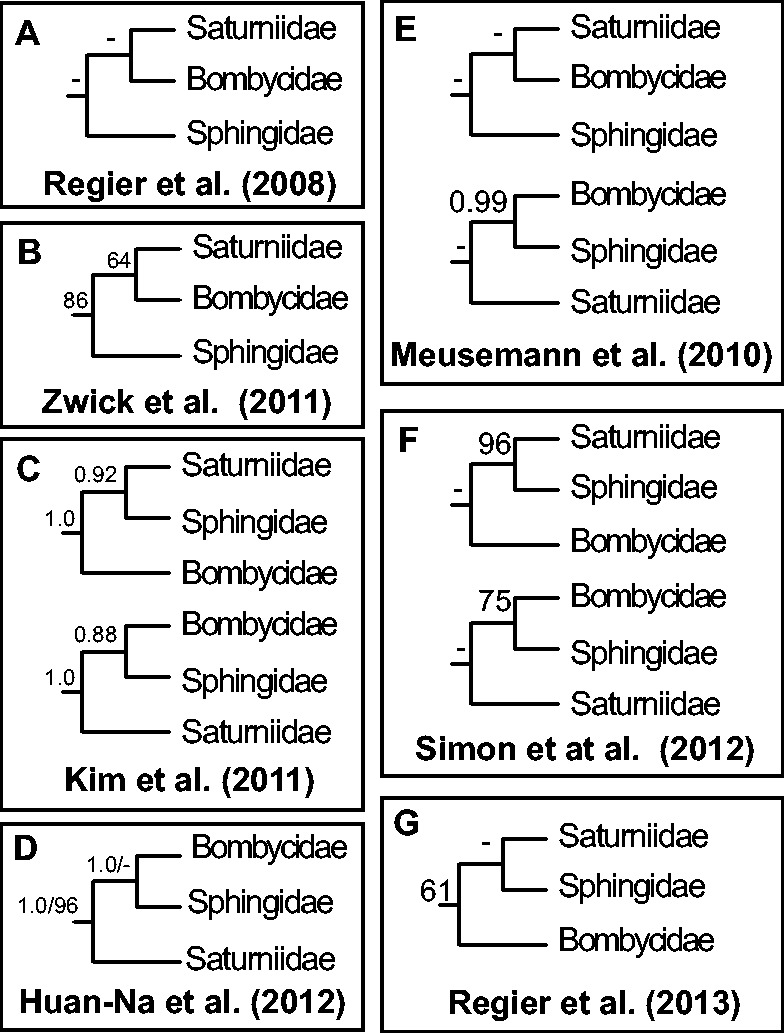
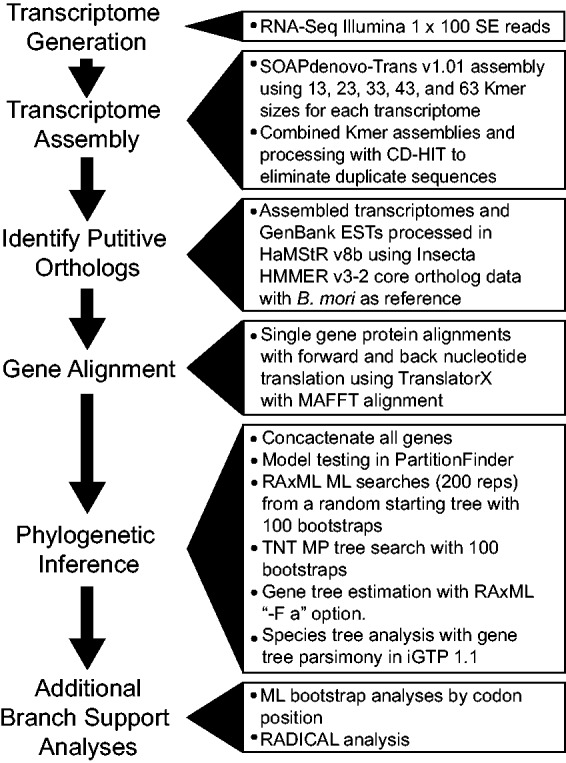
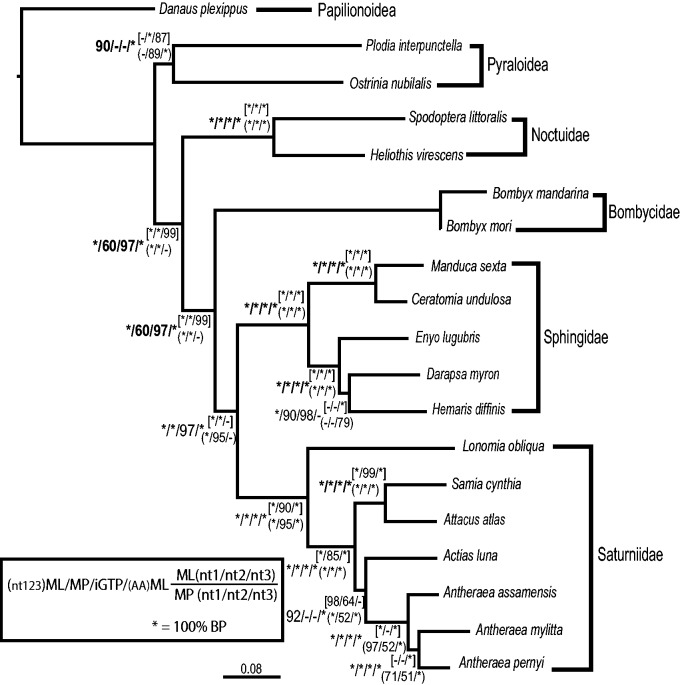
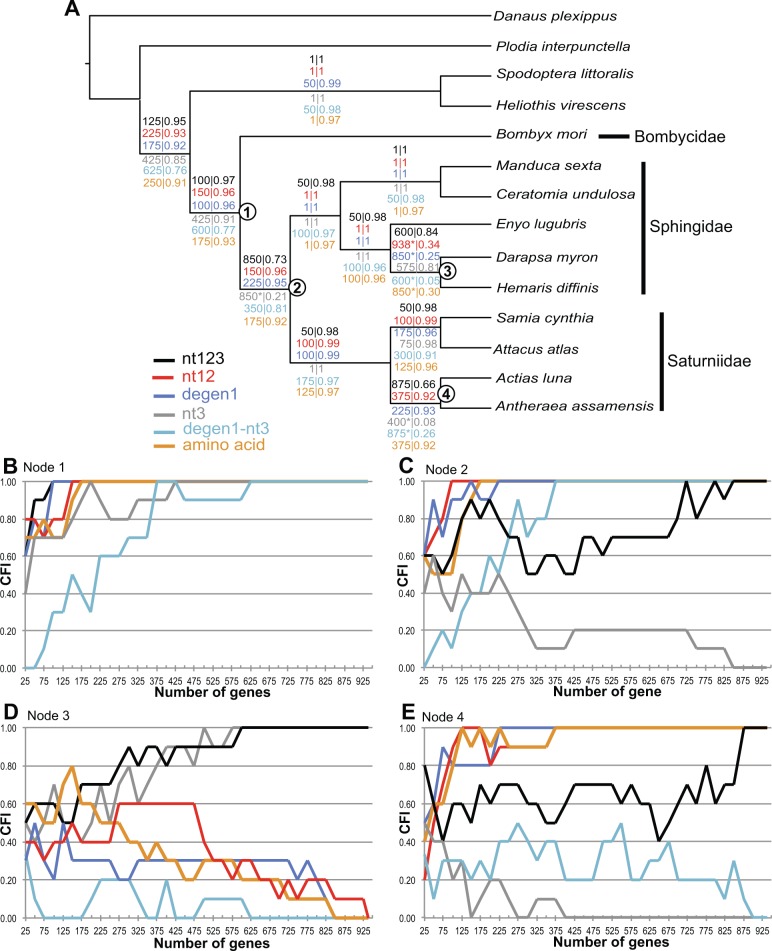
Recent advancements in molecular sequencing techniques have led to a surge in the number of phylogenetic studies that incorporate large amounts of genetic data. We test the assumption that analyzing large number of genes will lead to improvements in tree resolution and branch support using moths in the superfamily Bombycoidea, a group with some interfamilial relationships that have been difficult to resolve. Specifically, we use a next-gen data set that included 19 taxa and 938 genes (∼1.2M bp) to examine how codon position and saturation might influence resolution and node support among three key families. Maximum likelihood, parsimony, and species tree analysis using gene tree parsimony, on different nucleotide and amino acid data sets, resulted in largely congruent topologies with high bootstrap support compared with prior studies that included fewer loci. However, for a few shallow nodes, nucleotide and amino acid data provided high support for conflicting relationships. The third codon position was saturated and phylogenetic analysis of this position alone supported a completely different, potentially misleading sister group relationship. We used the program RADICAL to assess the number of genes needed to fix some of these difficult nodes. One such node originally needed a total of 850 genes but only required 250 when synonymous signal was removed. Our study shows that, in order to effectively use next-gen data to correctly resolve difficult phylogenetic relationships, it is necessary to assess the effects of synonymous substitutions and third codon positions.
Keywords: Bombycoidea; Lepidoptera; phylogeny; saturation; synonymous substitutions; transcriptome.
Figures
Similar articles
-
Increased gene sampling strengthens support for higher-level groups within leaf-mining moths and relatives (Lepidoptera: Gracillariidae).BMC Evol Biol. 2011 Jun 24;11:182. doi: 10.1186/1471-2148-11-182. BMC Evol Biol. 2011. PMID: 21702958 Free PMC article.
-
Phylogenomics provides strong evidence for relationships of butterflies and moths.Proc Biol Sci. 2014 Aug 7;281(1788):20140970. doi: 10.1098/rspb.2014.0970. Proc Biol Sci. 2014. PMID: 24966318 Free PMC article.
-
Mitochondrial phylogenomics of early land plants: mitigating the effects of saturation, compositional heterogeneity, and codon-usage bias.Syst Biol. 2014 Nov;63(6):862-78. doi: 10.1093/sysbio/syu049. Epub 2014 Jul 28. Syst Biol. 2014. PMID: 25070972
-
A large-scale, higher-level, molecular phylogenetic study of the insect order Lepidoptera (moths and butterflies).PLoS One. 2013;8(3):e58568. doi: 10.1371/journal.pone.0058568. Epub 2013 Mar 12. PLoS One. 2013. PMID: 23554903 Free PMC article.
-
Toward reconstructing the evolution of advanced moths and butterflies (Lepidoptera: Ditrysia): an initial molecular study.BMC Evol Biol. 2009 Dec 2;9:280. doi: 10.1186/1471-2148-9-280. BMC Evol Biol. 2009. PMID: 19954545 Free PMC article.
Cited by
-
A phylogenomic analysis of lichen-feeding tiger moths uncovers evolutionary origins of host chemical sequestration.Mol Phylogenet Evol. 2018 Apr;121:23-34. doi: 10.1016/j.ympev.2017.12.015. Epub 2017 Dec 20. Mol Phylogenet Evol. 2018. PMID: 29274497 Free PMC article.
-
Extremely divergent COI sequences within an amphipod species complex: A possible role for endosymbionts?Ecol Evol. 2022 Oct 27;12(10):e9448. doi: 10.1002/ece3.9448. eCollection 2022 Oct. Ecol Evol. 2022. PMID: 36311398 Free PMC article.
-
Interrogating Genomic-Scale Data to Resolve Recalcitrant Nodes in the Spider Tree of Life.Mol Biol Evol. 2021 Mar 9;38(3):891-903. doi: 10.1093/molbev/msaa251. Mol Biol Evol. 2021. PMID: 32986823 Free PMC article.
-
Phylogenetic relationships and taxonomic position of genus Hyperacrius (Rodentia: Arvicolinae) from Kashmir based on evidences from analysis of mitochondrial genome and study of skull morphology.PeerJ. 2020 Nov 18;8:e10364. doi: 10.7717/peerj.10364. eCollection 2020. PeerJ. 2020. PMID: 33240667 Free PMC article.
-
The Complete Mitochondrial Genome and Expression Profile of Mitochondrial Protein-Coding Genes in the Bisexual and Parthenogenetic Haemaphysalis longicornis.Front Physiol. 2019 Jul 30;10:982. doi: 10.3389/fphys.2019.00982. eCollection 2019. Front Physiol. 2019. PMID: 31417433 Free PMC article.
References
-
- Betancur-R R, Li C, Munroe TA, Ballesteros JA, Ortí G. Addressing gene tree discordance and non-stationarity to resolve a multi-locus phylogeny of the flatfishes (Teleostei: Pleuronectiformes) Syst Biol. 2013;62(5):763–785. - PubMed
-
- Biomatters. Geneious v5.5.8. 2013 [cited 2013 Nov 8]. Available from: http://www.geneious.com.
-
- Buckley TR, Simon C, Chambers GK. Exploring among-site rate variation models in a maximum likelihood framework using empirical data: the effects of model assumptions on estimates of topology, branch lengths, and bootstrap support. Syst Biol. 2001;50:67–86. - PubMed
MeSH terms
Substances
LinkOut - more resources
Full Text Sources
Other Literature Sources
