. 2013 Dec;23(12):2013-29.
doi: 10.1101/gr.155960.113. Epub 2013 Oct 22.

Disclosing the crosstalk among DNA methylation, transcription factors, and histone marks in human pluripotent cells through discovery of DNA methylation motifs

Affiliations

Disclosing the crosstalk among DNA methylation, transcription factors, and histone marks in human pluripotent cells through discovery of DNA methylation motifs

Phuc-Loi Luu et al. Genome Res. 2013 Dec.

Abstract

Gene expression regulation is gated by promoter methylation states modulating transcription factor binding. The known DNA methylation/unmethylation mechanisms are sequence unspecific, but different cells with the same genome have different methylomes. Thus, additional processes bringing specificity to the methylation/unmethylation mechanisms are required. Searching for such processes, we demonstrated that CpG methylation states are influenced by the sequence context surrounding the CpGs. We used such a property to develop a CpG methylation motif discovery algorithm. The newly discovered motifs reveal "methylation/unmethylation factors" that could recruit the "methylation/unmethylation machinery" to the loci specified by the motifs. Our methylation motif discovery algorithm provides a synergistic approach to the differently methylated region algorithms. Since our algorithm searches for commonly methylated regions inside the same sample, it requires only a single sample to operate. The motifs that were found discriminate between hypomethylated and hypermethylated regions. The hypomethylation-associated motifs have a high CG content, their targets appear in conserved regions near transcription start sites, they tend to co-occur within transcription factor binding sites, they are involved in breaking the H3K4me3/H3K27me3 bivalent balance, and they transit the enhancers from repressive H3K27me3 to active H3K27ac during ES cell differentiation. The new methylation motifs characterize the pluripotent state shared between ES and iPS cells. Additionally, we found a collection of motifs associated with the somatic memory inherited by the iPS from the initial fibroblast cells, thus revealing the existence of epigenetic somatic memory on a fine methylation scale.


Figures
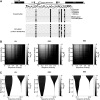
Figure 1.
Figure 1.
DNA methylation patterns are nonuniformly distributed and are influenced by their DNA context. (A) Analysis of the methylation state of nestin (NES) second intron enhancer region. The lollipop diagram in the top panel shows the observed 58.6% global methylation (Han et al. 2009). Such methylation is nonuniformly distributed along CpG “columns.” There are CpG “columns” with higher and lower probability to be methylated. In simulations with a uniform distribution of the methylation states, we can observe lollipop diagrams such as the one shown in the bottom panel, with the same methylation percentage as the one experimentally observed, but with nonpreferential “column” methylation distributions. (B) Heatmaps of the frequencies of the similarity of the methylation between the two DNA strands versus the similarity of the sequence of the two DNA strands for each CpG word. (C) Violin plots of the frequencies of the methylation similarity between the two DNA strands for low (≤0.1) and high (≥0.9) sequence similarity between the two DNA strands. The similarities are calculated genome wide, and their frequencies are represented in log10 scale by gray color bars.
Figure 2.
Figure 2.
Methylation-resistant CpGMMs are more abundant and are highly correlated among pluripotent populations. Histograms of the Pearson correlation coefficients of pairwise pools of different cell types for methylation-resistant (A) and methylation-prone (B) CpGMMs. Vertical lines mark the low and high correlation boundaries. Venn diagram of the numbers of methylation-resistant (C) and methylation-prone (D) CpGMM clusters in each cell type. ES CpGMM regions are marked in white, iPSs in gray, and fibroblasts in black. The numbers enclosed by the circular segments are the numbers of cell type-specific motifs.
Figure 3.
Figure 3.
General discriminative features between all the methylation-resistant and methylation-prone CpGMMs. Histograms of (A) the 4 nt distributions across the discovered CpGMMs; (B) the conservation of all the CpGMM targets, where the sequence conservation scores were taken from primates phastCons 46-way (see Supplemental Material; Siepel et al. 2005); and (C) the distances of all the CpGMM targets to the TSSs. The methylation-resistant features are in gray; the methylation-prone, in black. Vertical lines mark the position of the median.
Figure 4.
Figure 4.
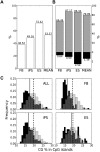
Correlation of methylation-resistant and methylation-prone CpGMM targets with CpG islands for each cell type. Percentage of CpGMM targets of each cell type that lie inside CpG islands (A) and methylation-resistant and methylation-prone CpGMM targets of each cell type that lie inside CpG islands (B). The methylation-resistant percentages are in gray, the methylation-prone in black, and the merged ones in white. The rightmost bars correspond to the mean across all the populations. (C) Histograms of the CG content of the CpGMM targets inside CpG islands for the pool of all samples (ALL), fibroblast (FB), iPS, and ES. The dashed and gray vertical lines mark the positions of the mean of the methylation-resistant and methylation-prone distributions, respectively.
Figure 5.
Figure 5.
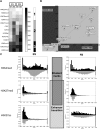
Correlation between ES cell CpGMM loci targets and histone mark signals. (A) Heatmap of the mean signal of the co-occurrences of histone marks with methylation-prone (MP) and methylation-resistant (MR) ES cell CpGMM targets that share loci (calculated as in Supplemental Fig. S6) with ES and fibroblast histone marks. The labeled rectangles mark the three types of correlation patterns. The gray color bar shows the color codification of the mean signal. (B) Scatter plot of the differences of resistant minus prone averages of histone mark signals' co-occurrences with ES cell CpGMM targets in fibroblasts versus ES cells. (C) Histograms of CpGMM targets co-occurring with the H3K4me3, H3K27me3, and H3K27ac histone marks. Only the signals with a score of at least 250 are plotted. The frequencies associated with methylation-resistant and methylation-prone CpGMM targets are in gray and black, respectively.
Figure 6.
Figure 6.
Discriminative features of mixed promoters containing bivalent and monovalent CpGMMs in ES cells. (A) Histograms of the distances of methylation-resistant CpGMM targets (gray), and methylation-prone CpGMM targets (black), to the in-between CTCF for promoters simultaneously containing methylation-resistant and methylation-prone CpGMMs. The vertical lines show mean values of the distances to CTCF of methylation-resistant and methylation-prone CpGMM loci. (B) Histogram of the expression of genes with only methylation-resistant (light gray) and methylation-prone (gray) CpGMMs. (C) Histogram of the expression of all genes (light gray) and genes with promoters simultaneously containing methylation-resistant and methylation-prone CpGMMs (gray). The black vertical lines show the gene expression threshold. The numbers inside boxes are the percentages of expressed genes. (D) Heatmap of the percentage of expressed genes with mixed and unmixed structures of methylation-resistant and methylation-prone CpGMMs 1kb upstream of the TSS. The corresponding genomic structure with positions relative to the TSS (marked with an arrow) of the methylation-resistant and methylation-prone CpGMMs and CTCF binding is represented beside each heatmap cell.
Figure 7.
Figure 7.
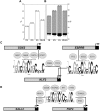
Crosstalk between CpGMMs and TFs. Percentages of CpGMM targets of each cell type (A) and methylation-resistant and methylation-prone CpGMM targets of each cell type (B) that co-occupy TFBSs. The methylation-resistant percentages are in gray, the methylation-prone in black, and the merged ones in white. The rightmost bars correspond to the mean across all populations. (C,D) Pluripotent networks arising from the crosstalk between CpGMMs and TFs. The CpGMMs are those whose loci targets have significant enrichment of pluripotent genes. The small circles indicate the positions of the methylation-resistant CpGMM target loci. The ellipses over the CpGMMs enclose the names of the TFs expressed >4.5 FPKM and whose TFBMs resemble (Pearson correlation ≥0.85) the CpGMM. The horizontal bars represent the promoters of the CpGMM targets. The light gray region of the bar represents the gene promoter itself; the black part represents a small portion of the coding region; and the beginning of each horizontal arrow marks the TSSs.

Similar articles

Cited by

References

    1. Artyomov MN, Meissner A, Chakraborty AK 2010. A model for genetic and epigenetic regulatory networks identifies rare pathways for transcription factor induced pluripotency. PLoS Comput Biol 6: e1000785. - PMC - PubMed
    1. Berg OG, Von Hippel PH 1987. Selection of DNA binding sites by regulatory proteins: Statistical-mechanical theory and application to operators and promoters. J Mol Biol 193: 723–743 - PubMed
    1. Bernstein BE, Mikkelsen TS, Xie X, Kamal M, Huebert DJ, Cuff J, Fry B, Meissner A, Wernig M, Plath K, et al. 2006. A bivalent chromatin structure marks key developmental genes in embryonic stem cells. Cell 125: 315–326 - PubMed
    1. Bhasin M, Zhang H, Reinherz EL, Reche PA 2005. Prediction of methylated CpGs in DNA sequences using a support vector machine. FEBS Lett 579: 4302–4308 - PubMed
    1. Bird A 2011. Putting the DNA back into DNA methylation. Nat Genet 43: 1050–1051 - PubMed

MeSH terms

LinkOut - more resources