

Air pollution and respiratory infections during early childhood: an analysis of 10 European birth cohorts within the ESCAPE Project
- PMID: 24149084
- PMCID: PMC3888562
- DOI: 10.1289/ehp.1306755
Air pollution and respiratory infections during early childhood: an analysis of 10 European birth cohorts within the ESCAPE Project
Erratum in
- Environ Health Perspect. 2014 Jan;122(1):112
Abstract
Background: Few studies have investigated traffic-related air pollution as a risk factor for respiratory infections during early childhood.
Objectives: We aimed to investigate the association between air pollution and pneumonia, croup, and otitis media in 10 European birth cohorts--BAMSE (Sweden), GASPII (Italy), GINIplus and LISAplus (Germany), MAAS (United Kingdom), PIAMA (the Netherlands), and four INMA cohorts (Spain)--and to derive combined effect estimates using meta-analysis.
Methods: Parent report of physician-diagnosed pneumonia, otitis media, and croup during early childhood were assessed in relation to annual average pollutant levels [nitrogen dioxide (NO2), nitrogen oxide (NOx), particulate matter≤2.5 μm (PM2.5), PM2.5 absorbance, PM10, PM2.5-10 (coarse PM)], which were estimated using land use regression models and assigned to children based on their residential address at birth. Identical protocols were used to develop regression models for each study area as part of the ESCAPE project. Logistic regression was used to calculate adjusted effect estimates for each study, and random-effects meta-analysis was used to calculate combined estimates.
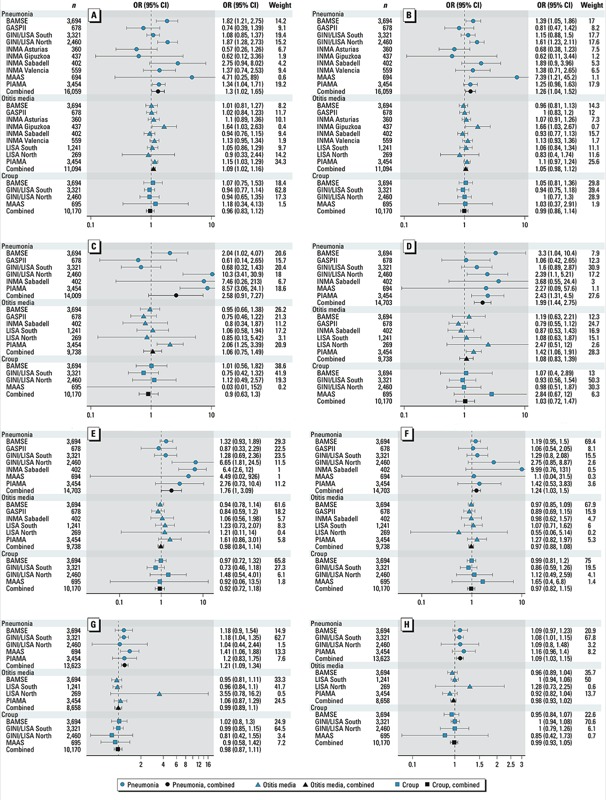
Results: For pneumonia, combined adjusted odds ratios (ORs) were elevated and statistically significant for all pollutants except PM2.5 (e.g., OR=1.30; 95% CI: 1.02, 1.65 per 10-μg/m3 increase in NO2 and OR=1.76; 95% CI: 1.00, 3.09 per 10-μg/m3 PM10). For otitis media and croup, results were generally null across all analyses except for NO2 and otitis media (OR=1.09; 95% CI: 1.02, 1.16 per 10-μg/m3).
Conclusion: Our meta-analysis of 10 European birth cohorts within the ESCAPE project found consistent evidence for an association between air pollution and pneumonia in early childhood, and some evidence for an association with otitis media.
Conflict of interest statement
The authors declare they have no actual or potential competing financial interests.
Figures
References
-
- Aguilera I, Pedersen M, Garcia-Esteban R, Ballester F, Basterrechea M, Esplugues A, et al. 2013Early-life exposure to outdoor air pollution and respiratory health, ear infections, and eczema in infants from the INMA study. Environ Health Perspect 121387–392.; 10.1289/ehp.1205281 - DOI - PMC - PubMed
-
- Bateson TF, Schwartz J. Children’s response to air pollutants. J Toxicol Environ Health A. 2008;71(3):238–243. - PubMed
-
- Beelen R, Hoek G, Vienneau D, Eeftens M, Dimakopoulou M, Pedeli X, et al. Development of NO2 and NOx land use regression models for estimating air pollution exposure in 36 study areas in Europe—the ESCAPE project. Atmos Environ. 2013;72:10–23.
-
- Black RE, Cousens S, Johnson HL, Lawn JE, Rudan I, Bassani DG, et al. Global, regional, and national causes of child mortality in 2008: a systematic analysis. Lancet. 2010;375:1969–1987. - PubMed
Publication types
MeSH terms
Substances
Grants and funding
LinkOut - more resources
Full Text Sources
Other Literature Sources
Medical