

Analysis of the distances covered by first division brazilian soccer players obtained with an automatic tracking method
- PMID: 24149334
- PMCID: PMC3786245
Analysis of the distances covered by first division brazilian soccer players obtained with an automatic tracking method
Abstract
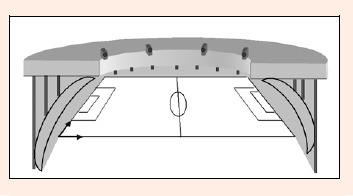
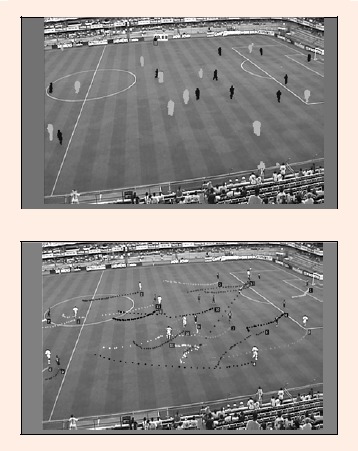
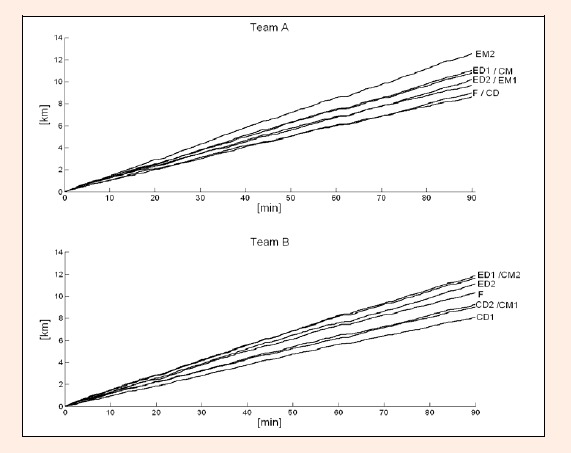
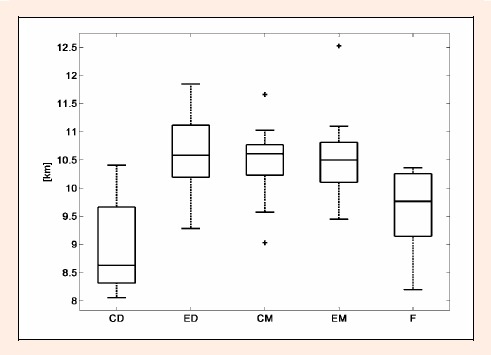
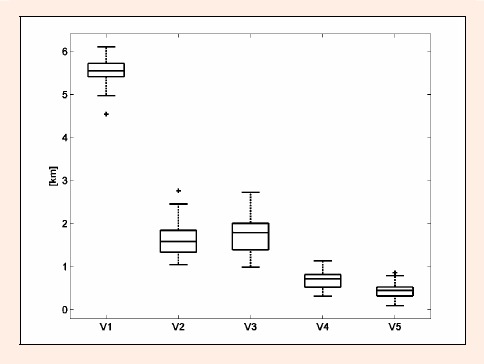
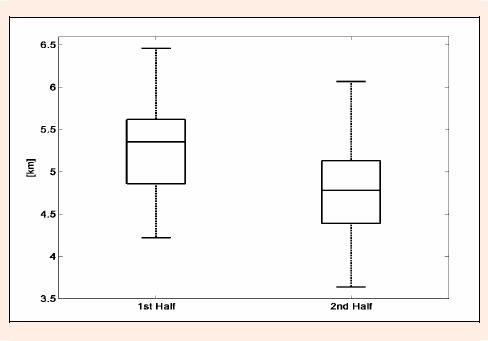
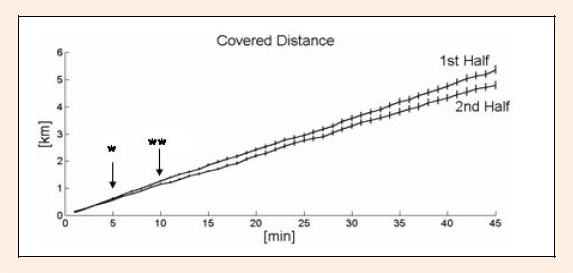
Methods based on visual estimation still is the most widely used analysis of the distances that is covered by soccer players during matches, and most description available in the literature were obtained using such an approach. Recently, systems based on computer vision techniques have appeared and the very first results are available for comparisons. The aim of the present study was to analyse the distances covered by Brazilian soccer players and compare the results to the European players', both data measured by automatic tracking system. Four regular Brazilian First Division Championship matches between different teams were filmed. Applying a previously developed automatic tracking system (DVideo, Campinas, Brazil), the results of 55 outline players participated in the whole game (n = 55) are presented. The results of mean distances covered, standard deviations (s) and coefficient of variation (cv) after 90 minutes were 10,012 m, s = 1,024 m and cv = 10.2%, respectively. The results of three-way ANOVA according to playing positions, showed that the distances covered by external defender (10642 ± 663 m), central midfielders (10476 ± 702 m) and external midfielders (10598 ± 890 m) were greater than forwards (9612 ± 772 m) and forwards covered greater distances than central defenders (9029 ± 860 m). The greater distances were covered in standing, walking, or jogging, 5537 ± 263 m, followed by moderate-speed running, 1731 ± 399 m; low speed running, 1615 ± 351 m; high-speed running, 691 ± 190 m and sprinting, 437 ± 171 m. Mean distance covered in the first half was 5,173 m (s = 394 m, cv = 7.6%) highly significant greater (p < 0.001) than the mean value 4,808 m (s = 375 m, cv = 7.8%) in the second half. A minute-by-minute analysis revealed that after eight minutes of the second half, player performance has already decreased and this reduction is maintained throughout the second half. Key pointsA novel automatic tracking method was presented. No previous work was found in the literature reporting data of simultaneous trajectories of all soccer players obtained by an automatic tracking method.The study reveals 7% reduction in mean distance covered in the second half and moreover after eight minutes of the second half, player performance has already decreased and this reduction is maintained throughout the second half.
Keywords: Biomechanics; distance covered; soccer; tracking.
Figures
References
-
- Bangsbo J., Mohr M., Krustrup P. (2006) Physical and metabolic demands of training and match-play in the elite football player. Journal of Sports Sciences 24(7), 665-674 - PubMed
-
- Bangsbo J., Norregaard L., Thorso F. (1991) Activity profile of competition soccer. Canadian Journal of Sport Sciences 16(2), 110-116 - PubMed
-
- Barros R.M.L., Russomanno T.G., Brenzikofer R., Figueroa P.J. (2006) A method to synchronise video cameras using the audio band. Journal of Biomechanics 39(4), 776-780 - PubMed
-
- Di Salvo V., Collins A., McNeill B., Cardinale M. (2006) Validation of Prozone ®: A new video-based performance analysis system. International Journal of Performance Analysis in Sport (serial online) 6(1), (12 screens/inclusive page), June. Available from URL: http://www.ingentaconnect.com/content/uwic/ujpa
-
- Di Salvo V., Baron R., Tschan H., Calderon Montero F.J., Bachl N., Pigozzi F. (2007) Performance Characteristics According to Playing Position in Elite Soccer. International Journal of Sports Medicine (serial online) 28(3), (06 screens/inclusive page), March. Available from URL: http://www.thieme-connect.com/ejournals/toc/sportsmed/ - PubMed
LinkOut - more resources
Full Text Sources