

Replicated high-density genetic maps of two great tit populations reveal fine-scale genomic departures from sex-equal recombination rates
- PMID: 24149651
- PMCID: PMC3931172
- DOI: 10.1038/hdy.2013.107
Replicated high-density genetic maps of two great tit populations reveal fine-scale genomic departures from sex-equal recombination rates
Abstract
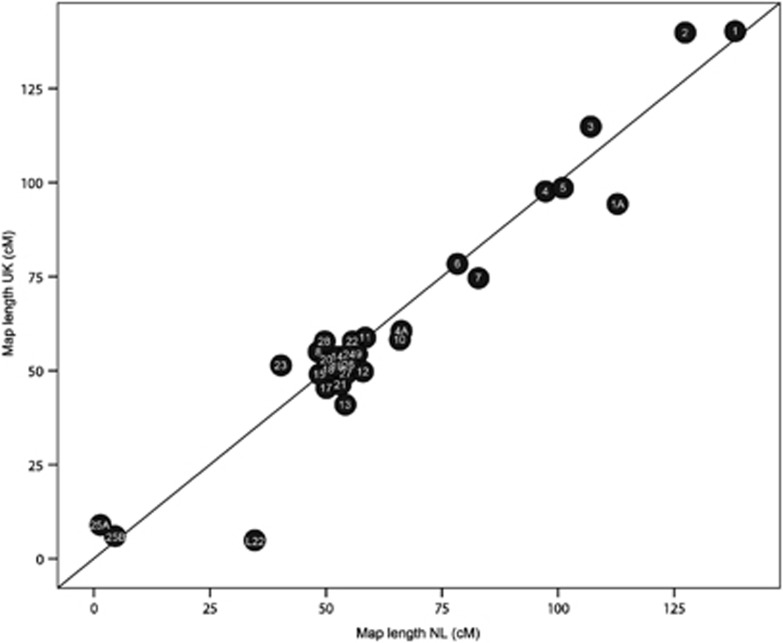
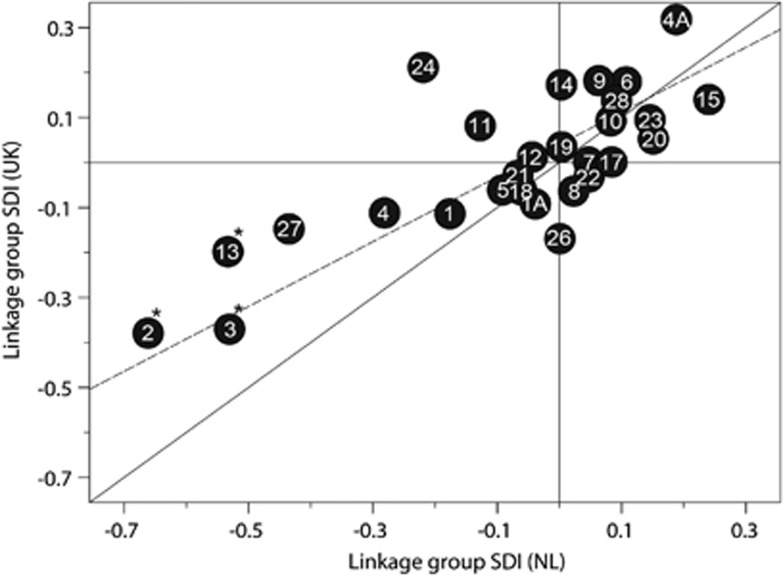
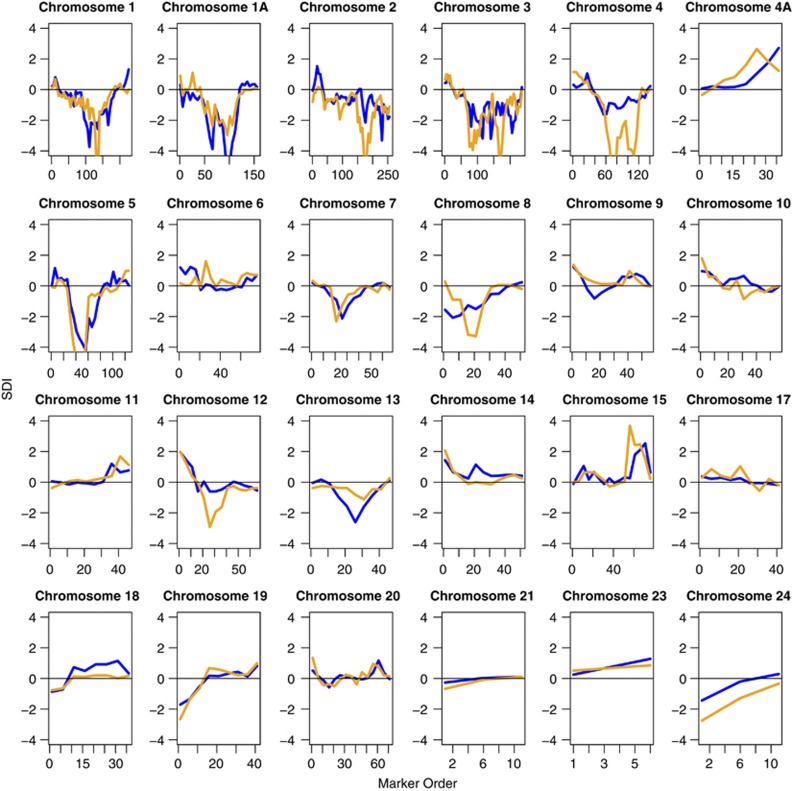
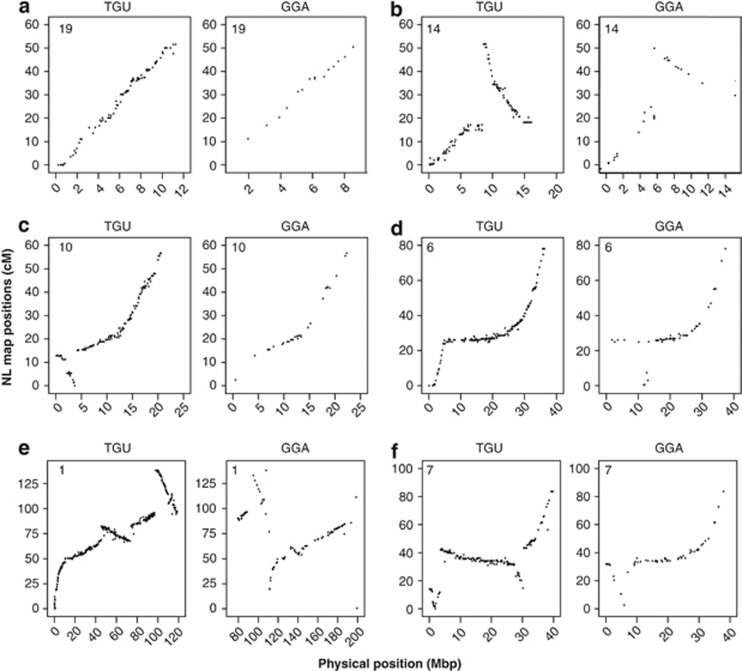
Linking variation in quantitative traits to variation in the genome is an important, but challenging task in the study of life-history evolution. Linkage maps provide a valuable tool for the unravelling of such trait-gene associations. Moreover, they give insight into recombination landscapes and between-species karyotype evolution. Here we used genotype data, generated from a 10k single-nucleotide polymorphism (SNP) chip, of over 2000 individuals to produce high-density linkage maps of the great tit (Parus major), a passerine bird that serves as a model species for ecological and evolutionary questions. We created independent maps from two distinct populations: a captive F2-cross from The Netherlands (NL) and a wild population from the United Kingdom (UK). The two maps contained 6554 SNPs in 32 linkage groups, spanning 2010 cM and 1917 cM for the NL and UK populations, respectively, and were similar in size and marker order. Subtle levels of heterochiasmy within and between chromosomes were remarkably consistent between the populations, suggesting that the local departures from sex-equal recombination rates have evolved. This key and surprising result would have been impossible to detect if only one population was mapped. A comparison with zebra finch Taeniopygia guttata, chicken Gallus gallus and the green anole lizard Anolis carolinensis genomes provided further insight into the evolution of avian karyotypes.
Figures
Similar articles
-
Avian genome evolution: insights from a linkage map of the blue tit (Cyanistes caeruleus).Heredity (Edinb). 2010 Jan;104(1):67-78. doi: 10.1038/hdy.2009.107. Heredity (Edinb). 2010. PMID: 19707235
-
A linkage map of the zebra finch Taeniopygia guttata provides new insights into avian genome evolution.Genetics. 2008 May;179(1):651-67. doi: 10.1534/genetics.107.086264. Genetics. 2008. PMID: 18493078 Free PMC article.
-
A first-generation microsatellite-based genetic linkage map of the Siberian jay (Perisoreus infaustus): insights into avian genome evolution.BMC Genomics. 2009 Jan 3;10:1. doi: 10.1186/1471-2164-10-1. BMC Genomics. 2009. PMID: 19121221 Free PMC article.
-
A comparison of synteny and gene order on the homologue of chicken chromosome 7 between two passerine species and between passerines and chicken.Cytogenet Genome Res. 2008;121(2):120-9. doi: 10.1159/000125837. Epub 2008 Jun 9. Cytogenet Genome Res. 2008. PMID: 18544935
-
The recombination landscape of the zebra finch Taeniopygia guttata genome.Genome Res. 2010 Apr;20(4):485-95. doi: 10.1101/gr.101410.109. Epub 2010 Mar 31. Genome Res. 2010. PMID: 20357052 Free PMC article.
Cited by
-
Comparison between short-term stress and long-term adaptive responses reveal common paths to molecular adaptation.iScience. 2022 Feb 10;25(3):103899. doi: 10.1016/j.isci.2022.103899. eCollection 2022 Mar 18. iScience. 2022. PMID: 35243257 Free PMC article.
-
From molecules to populations: appreciating and estimating recombination rate variation.Nat Rev Genet. 2020 Aug;21(8):476-492. doi: 10.1038/s41576-020-0240-1. Epub 2020 May 29. Nat Rev Genet. 2020. PMID: 32472059 Review.
-
A high-density linkage map enables a second-generation collared flycatcher genome assembly and reveals the patterns of avian recombination rate variation and chromosomal evolution.Mol Ecol. 2014 Aug;23(16):4035-58. doi: 10.1111/mec.12810. Epub 2014 Jun 17. Mol Ecol. 2014. PMID: 24863701 Free PMC article.
-
High-Resolution Mapping of Crossover and Non-crossover Recombination Events by Whole-Genome Re-sequencing of an Avian Pedigree.PLoS Genet. 2016 May 24;12(5):e1006044. doi: 10.1371/journal.pgen.1006044. eCollection 2016 May. PLoS Genet. 2016. PMID: 27219623 Free PMC article.
-
Nonequivalent lethal equivalents: Models and inbreeding metrics for unbiased estimation of inbreeding load.Evol Appl. 2018 Oct 23;12(2):266-279. doi: 10.1111/eva.12713. eCollection 2019 Feb. Evol Appl. 2018. PMID: 30697338 Free PMC article.
References
-
- Åkesson M, Hansson B, Hasselquist D, Bensch S. Linkage mapping of AFLP markers in a wild population of great reed warblers: importance of heterozygosity and number of genotyped individuals. Mol Ecol. 2007;16:2189–2202. - PubMed
-
- Bachmann K, Harington BA, Craig JP. Genome size in birds. Chromosoma. 1972;37:405–416. - PubMed
Publication types
MeSH terms
LinkOut - more resources
Full Text Sources
Other Literature Sources
Miscellaneous
