

Does combined dry land strength and aerobic training inhibit performance of young competitive swimmers?
- PMID: 24149700
- PMCID: PMC3761739
Does combined dry land strength and aerobic training inhibit performance of young competitive swimmers?
Abstract
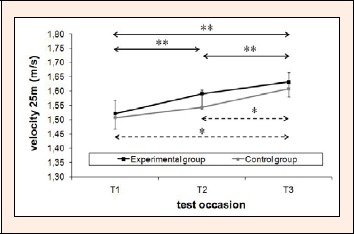
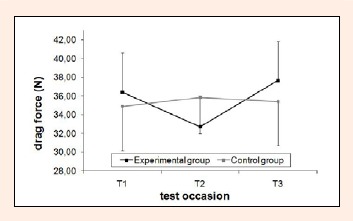
(i) to examine the effects of eight weeks of combined dry land strength and aerobic swimming training for increasing upper and lower body strength, power and swimming performance in young competitive swimmers and, (ii) to assess the effects of a detraining period (strength training cessation) on strength and swimming performance. The participants were divided into two groups: an experimental group (eight boys and four girls) and a control group (six boys and five girls). Apart from normal practice sessions (six training units per week of 1 h and 30 min per day), the experimental group underwent eight weeks (two sessions per week) of strength training. The principal strength exercises were the bench press, the leg extension, and two power exercises such as countermovement jump and medicine ball throwing. Immediately following this strength training program, all the swimmers undertook a 6 week detraining period, maintaining the normal swimming program, without any strength training. Swimming (25 m and 50 m performances, and hydrodynamic drag values), and strength (bench press and leg extension) and power (throwing medicine ball and countermovement jump) performances were tested in three moments: (i) before the experimental period, (ii) after eight weeks of combined strength and swimming training, and (iii) after the six weeks of detraining period. Both experimental and control groups were evaluated. A combined strength and aerobic swimming training allow dry land strength developments in young swimmers. The main data can not clearly state that strength training allowed an enhancement in swimming performance, although a tendency to improve sprint performance due to strength training was noticed. The detraining period showed that, although strength parameters remained stable, swimming performance still improved. Key pointsThis study investigated the effect of dry land strength training on sprint performance in young competitive swimmers.A combined strength and aerobic swimming training allow dry land strength developments in young swimmers.The main data can not clearly state that strength training allowed an enhancement in swimming performance, although a tendency to improve sprint performance due to strength training was noticed.The detraining period showed that, although strength parameters remained stable, swimming performance still improved.
Keywords: Children; combined training; cross training; detraining; hydrodynamics.
Figures


References
-
- Abernethy P., Quigley B. (1993) Concurrent strength and endurance training of the elbow extensors. Journal of Strength and Conditioning Research 7(7), 234-240
-
- Arellano R., Terres-Nicol J.M., Redondo J.M. (2006) Fundamental hydrodynamics of swimming propulsion. In: Biomechanics and Medicine in Swimming X. Eds: Vilas-Boas J.P., Alves F., Marques A.Portuguese Journal of Sport Sciences; 6, 15-20
-
- Barbosa T.M., Marinho D.A., Costa M., Coelho J., Cruz A., Marques M.C., Silva A.J. (2009) Path-flow analysis model for anthropometric, hydrodynamic and biomechanical variables in age-group swimmers. Journal of Sports Science and Medicine 8(Suppl. 11), 183
-
- Barbosa T.M., Costa M.J., Marinho D.A., Coelho J., Moreira M., Silva A.J. (2010) Modelling the links between age-group swimming performance, energetic and biomechanic profiles. Pediatric Exercise Science, in press. - PubMed
LinkOut - more resources
Full Text Sources