

The prevalence and origin of exoprotease-producing cells in the Bacillus subtilis biofilm
- PMID: 24149708
- PMCID: PMC3917226
- DOI: 10.1099/mic.0.072389-0
The prevalence and origin of exoprotease-producing cells in the Bacillus subtilis biofilm
Abstract
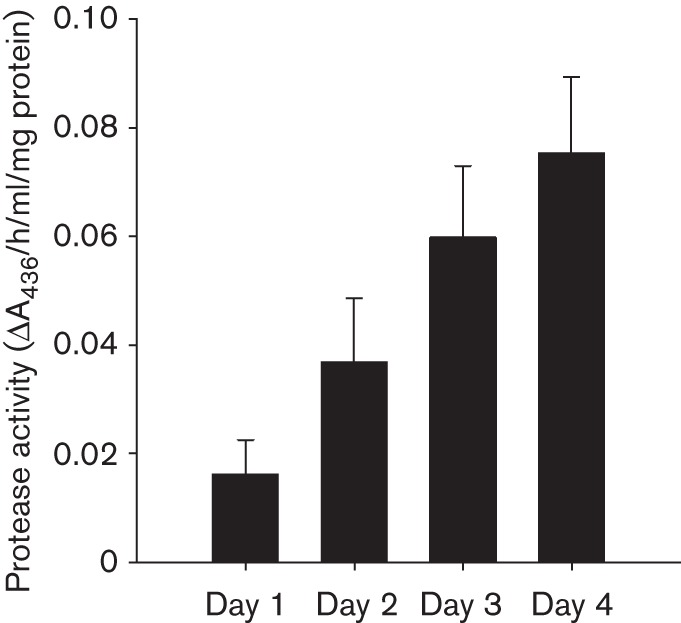
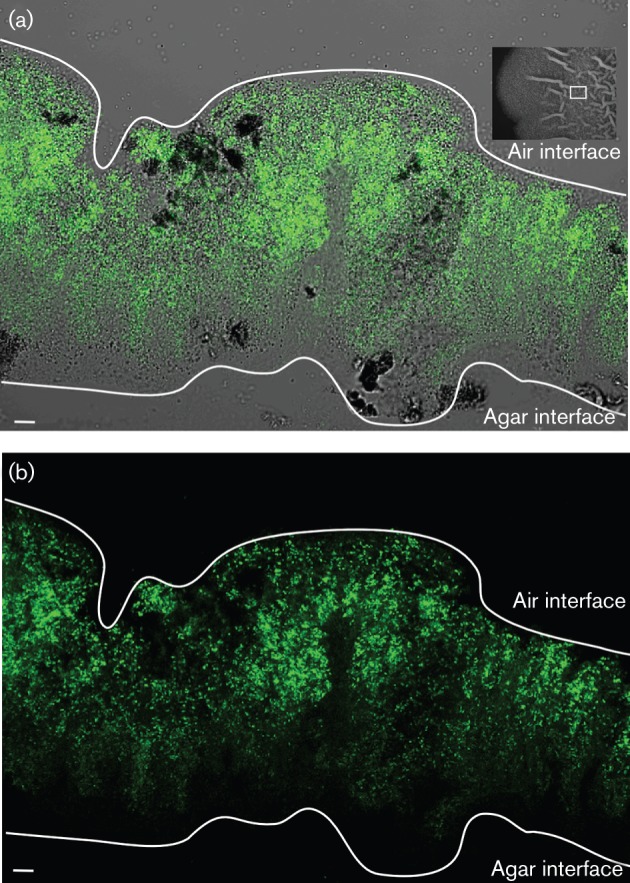
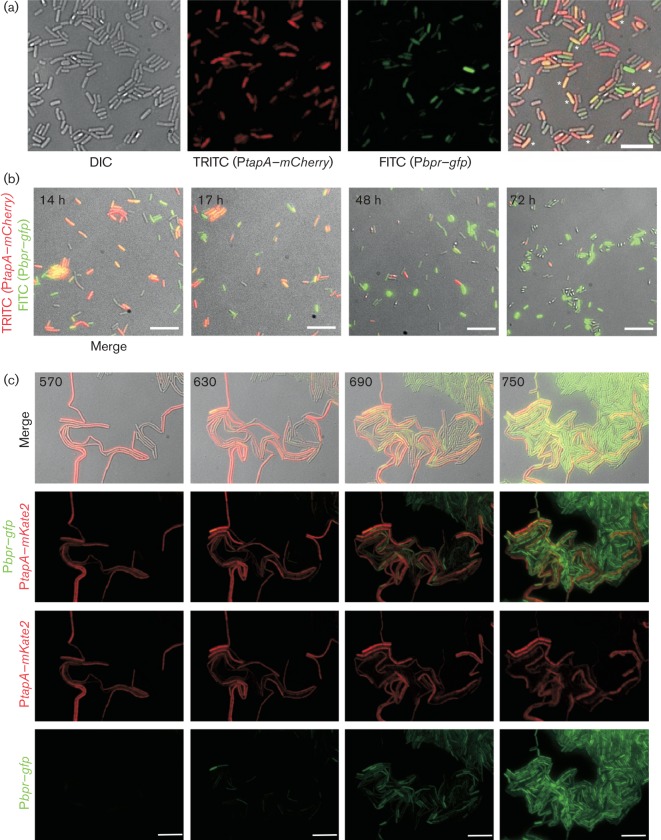
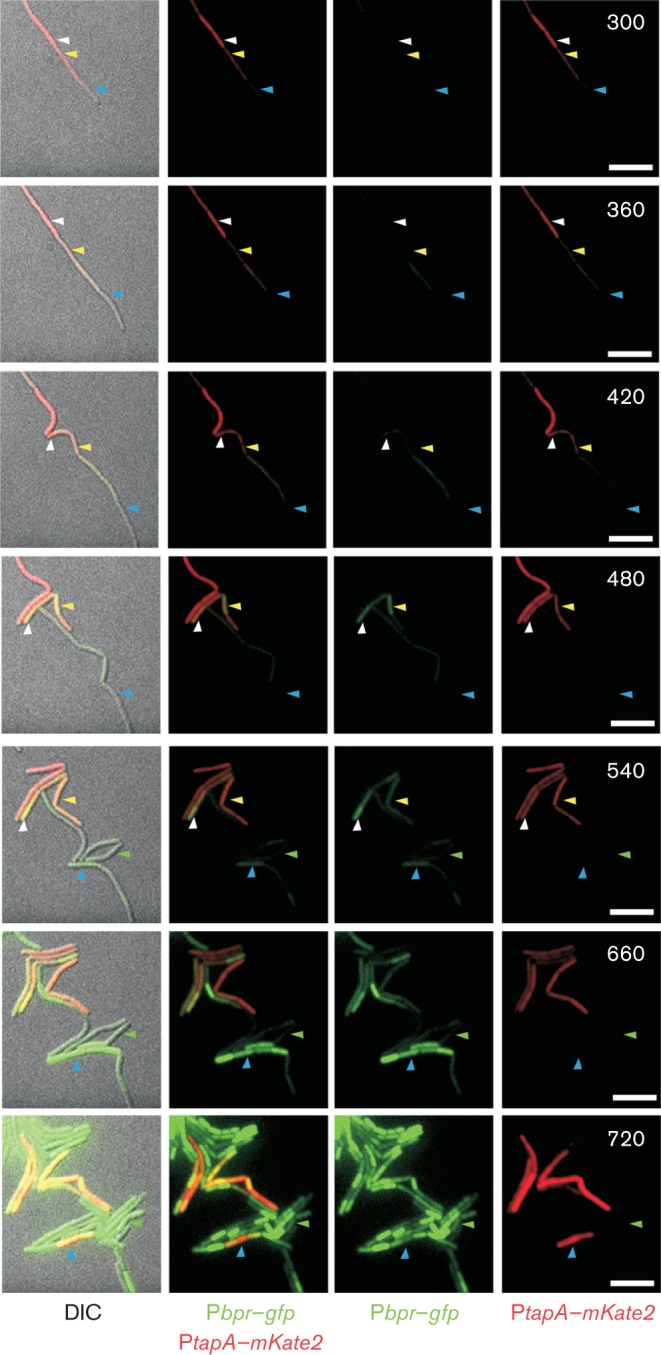
Biofilm formation by the Gram-positive bacterium Bacillus subtilis is tightly controlled at the level of transcription. The biofilm contains specialized cell types that arise from controlled differentiation of the resident isogenic bacteria. DegU is a response regulator that controls several social behaviours exhibited by B. subtilis including swarming motility, biofilm formation and extracellular protease (exoprotease) production. Here, for the first time, we examine the prevalence and origin of exoprotease-producing cells within the biofilm. This was accomplished using single-cell analysis techniques including flow cytometry and fluorescence microscopy. We established that the number of exoprotease-producing cells increases as the biofilm matures. This is reflected by both an increase at the level of transcription and an increase in exoprotease activity over time. We go on to demonstrate that exoprotease-producing cells arise from more than one cell type, namely matrix-producing and non-matrix-producing cells. In toto these findings allow us to add exoprotease-producing cells to the list of specialized cell types that are derived during B. subtilis biofilm formation and furthermore the data highlight the plasticity in the origin of differentiated cells.
Figures
Similar articles
-
Biofilm formation by Bacillus subtilis: new insights into regulatory strategies and assembly mechanisms.Mol Microbiol. 2014 Aug;93(4):587-98. doi: 10.1111/mmi.12697. Epub 2014 Jul 18. Mol Microbiol. 2014. PMID: 24988880 Free PMC article. Review.
-
DegU co-ordinates multicellular behaviour exhibited by Bacillus subtilis.Mol Microbiol. 2007 Jul;65(2):554-68. doi: 10.1111/j.1365-2958.2007.05810.x. Epub 2007 Jun 21. Mol Microbiol. 2007. PMID: 17590234
-
Single-cell analysis of Bacillus subtilis biofilms using fluorescence microscopy and flow cytometry.J Vis Exp. 2012 Feb 15;(60):3796. doi: 10.3791/3796. J Vis Exp. 2012. PMID: 22371091 Free PMC article.
-
The role of nitric-oxide-synthase-derived nitric oxide in multicellular traits of Bacillus subtilis 3610: biofilm formation, swarming, and dispersal.BMC Microbiol. 2011 May 20;11:111. doi: 10.1186/1471-2180-11-111. BMC Microbiol. 2011. PMID: 21599925 Free PMC article.
-
Bacillus subtilis biofilm formation and social interactions.Nat Rev Microbiol. 2021 Sep;19(9):600-614. doi: 10.1038/s41579-021-00540-9. Epub 2021 Apr 6. Nat Rev Microbiol. 2021. PMID: 33824496 Review.
Cited by
-
Giving structure to the biofilm matrix: an overview of individual strategies and emerging common themes.FEMS Microbiol Rev. 2015 Sep;39(5):649-69. doi: 10.1093/femsre/fuv015. Epub 2015 Apr 22. FEMS Microbiol Rev. 2015. PMID: 25907113 Free PMC article. Review.
-
Microbial life cycles link global modularity in regulation to mosaic evolution.Nat Ecol Evol. 2019 Aug;3(8):1184-1196. doi: 10.1038/s41559-019-0939-6. Epub 2019 Jul 22. Nat Ecol Evol. 2019. PMID: 31332330
-
Biofilm formation by Bacillus subtilis: new insights into regulatory strategies and assembly mechanisms.Mol Microbiol. 2014 Aug;93(4):587-98. doi: 10.1111/mmi.12697. Epub 2014 Jul 18. Mol Microbiol. 2014. PMID: 24988880 Free PMC article. Review.
-
Extensive cellular multi-tasking within Bacillus subtilis biofilms.mSystems. 2023 Aug 31;8(4):e0089122. doi: 10.1128/msystems.00891-22. Epub 2023 Aug 1. mSystems. 2023. PMID: 37527273 Free PMC article.
-
ComX-Induced Exoproteases Degrade ComX in Bacillus subtilis PS-216.Front Microbiol. 2018 Feb 1;9:105. doi: 10.3389/fmicb.2018.00105. eCollection 2018. Front Microbiol. 2018. PMID: 29449835 Free PMC article.
References
Publication types
MeSH terms
Substances
Grants and funding
- 083524/Z/07/Z/WT_/Wellcome Trust/United Kingdom
- BB/H002340/1/BB_/Biotechnology and Biological Sciences Research Council/United Kingdom
- 095931/WT_/Wellcome Trust/United Kingdom
- 100149/Z/12/Z/WT_/Wellcome Trust/United Kingdom
- BB/C520404/1/BB_/Biotechnology and Biological Sciences Research Council/United Kingdom
LinkOut - more resources
Full Text Sources
Other Literature Sources
Molecular Biology Databases