

Body mass index and incident hospitalisation for cardiovascular disease in 158 546 participants from the 45 and Up Study
- PMID: 24149770
- PMCID: PMC4052432
- DOI: 10.1038/ijo.2013.192
Body mass index and incident hospitalisation for cardiovascular disease in 158 546 participants from the 45 and Up Study
Abstract
Objective: To investigate the relationship between fine gradations in body mass index (BMI) and risk of hospitalisation for different types of cardiovascular disease (CVD).
Design, subjects and methods: The 45 and Up Study is a large-scale Australian cohort study initiated in 2006. Self-reported data from 158 546 individuals with no history of CVD were linked prospectively to hospitalisation and mortality data. Hazard ratios (HRs) of incident hospitalisation for specific CVD diagnoses in relation to baseline BMI categories were estimated using Cox regression, adjusting for age, sex, region of residence, income, education, smoking, alcohol intake and health insurance status.
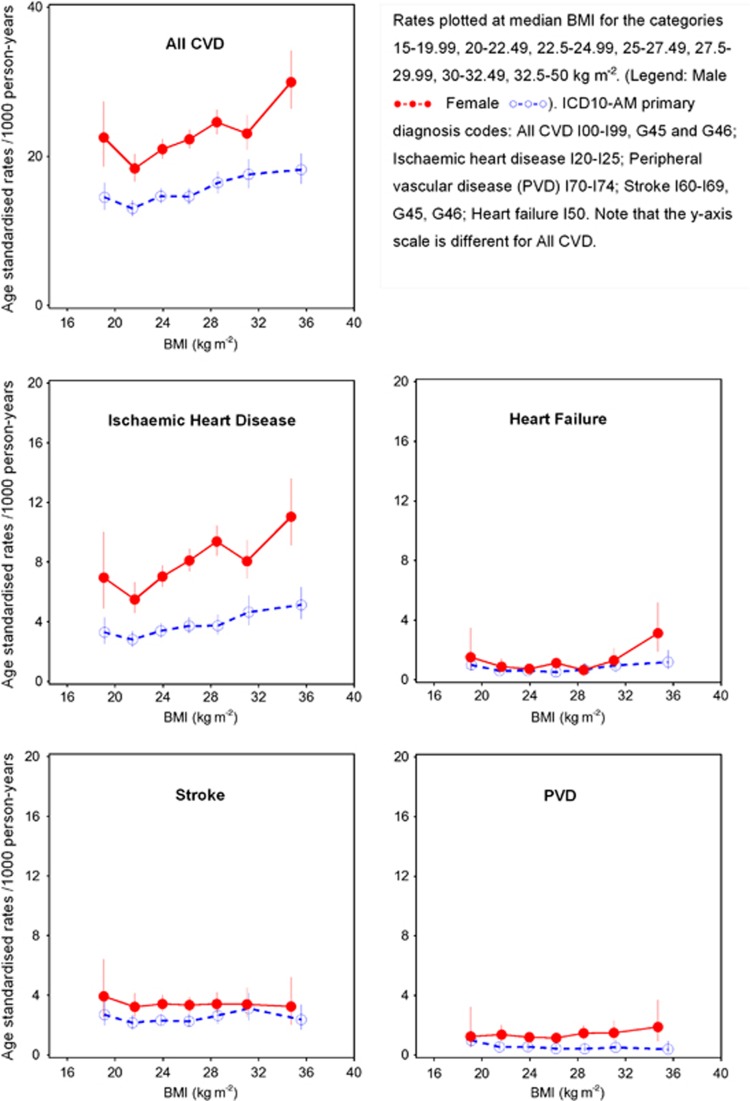
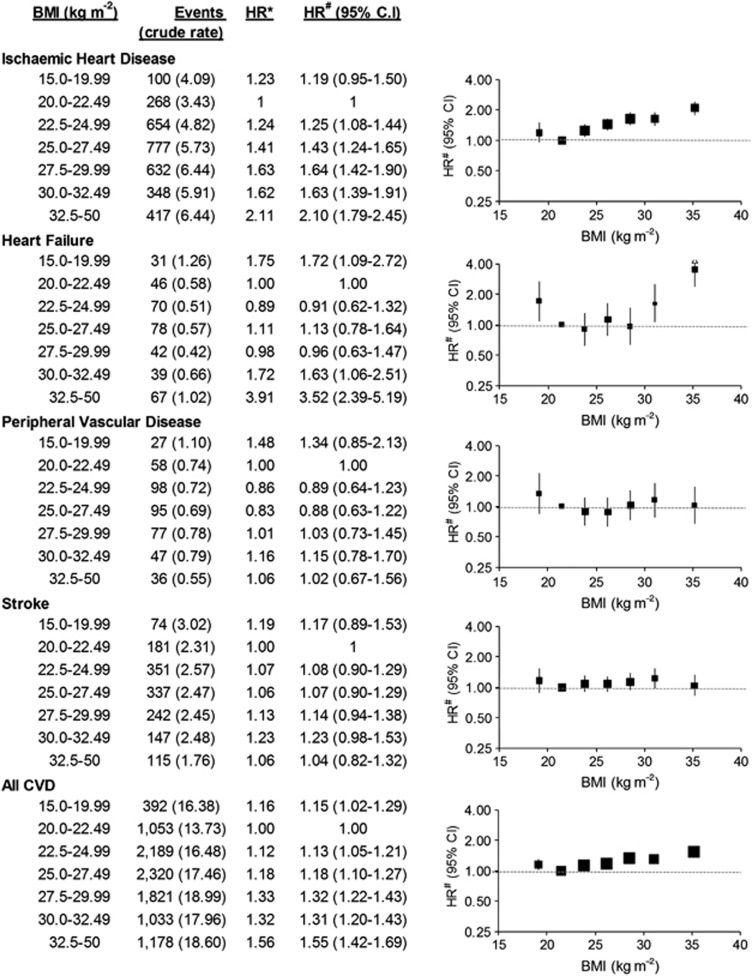
Results: There were 9594 incident CVD admissions over 583 100 person-years among people with BMI≥20 kg m(-2), including 3096 for ischaemic heart disease (IHD), 1373 for stroke, 411 for peripheral vascular disease (PVD) and 320 for heart failure. The adjusted HR of hospitalisation for all CVD diagnoses combined increased significantly with increasing BMI (P(trend) <0.0001)). The HR of IHD hospitalisation increased by 23% (95% confidence interval (95% CI): 18-27%) per 5 kg m(-2) increase in BMI (compared to BMI 20.0-22.49 kg m(-2), HR (95% CI) for BMI categories were: 22.5-24.99=1.25 (1.08-1.44); 25-27.49=1.43 (1.24-1.65); 27.5-29.99=1.64 (1.42-1.90); 30-32.49=1.63 (1.39-1.91) and 32.5-50=2.10 (1.79-2.45)). The risk of hospitalisation for heart failure showed a significant, but nonlinear, increase with increasing BMI. No significant increase was seen with above-normal BMI for stroke or PVD. For other specific classifications of CVD, HRs of hospitalisation increased significantly with increasing BMI for: hypertension; angina; acute myocardial infarction; chronic IHD; pulmonary embolism; non-rheumatic aortic valve disorders; atrioventricular and left bundle-branch block; atrial fibrillation and flutter; aortic aneurysm; and phlebitis and thrombophlebitis.
Conclusion: The risk of hospitalisation for a wide range of CVD subtypes increases with relatively fine increments in BMI. Obesity prevention strategies are likely to benefit from focusing on bringing down the mean BMI at the population level, in addition to targeting those with a high BMI.
Figures
Similar articles
-
Prospective cohort study of body mass index and the risk of hospitalisation: findings from 246361 participants in the 45 and Up Study.Int J Obes (Lond). 2013 Jun;37(6):790-9. doi: 10.1038/ijo.2012.155. Int J Obes (Lond). 2013. PMID: 22986682
-
Is poor oral health a risk marker for incident cardiovascular disease hospitalisation and all-cause mortality? Findings from 172 630 participants from the prospective 45 and Up Study.BMJ Open. 2016 Aug 30;6(8):e012386. doi: 10.1136/bmjopen-2016-012386. BMJ Open. 2016. PMID: 27577588 Free PMC article.
-
Tobacco smoking and risk of 36 cardiovascular disease subtypes: fatal and non-fatal outcomes in a large prospective Australian study.BMC Med. 2019 Jul 3;17(1):128. doi: 10.1186/s12916-019-1351-4. BMC Med. 2019. PMID: 31266500 Free PMC article.
-
Proteinuria, Body Mass Index, and the Risk of New-Onset Heart Failure: A Prospective Cohort Study in Northern China.Curr Probl Cardiol. 2023 Mar;48(3):101519. doi: 10.1016/j.cpcardiol.2022.101519. Epub 2022 Nov 28. Curr Probl Cardiol. 2023. PMID: 36450329 Review.
-
Eating Behaviors and Incident Cardiovascular Disease in Japanese People: The Population-Based Panasonic Cohort Study 14.Curr Probl Cardiol. 2023 Sep;48(9):101818. doi: 10.1016/j.cpcardiol.2023.101818. Epub 2023 May 20. Curr Probl Cardiol. 2023. PMID: 37211300 Review.
Cited by
-
Implantable loop recorders in patients with unexplained syncope: Clinical predictors of pacemaker implantation.Cardiol J. 2019;26(1):36-46. doi: 10.5603/CJ.a2018.0008. Epub 2018 Feb 5. Cardiol J. 2019. PMID: 29399750 Free PMC article.
-
Body Composition and Risk of Incident Heart Failure in 1 Million Adults: A Systematic Review and Dose-Response Meta-Analysis of Prospective Cohort Studies.J Am Heart Assoc. 2023 Jul 4;12(13):e029062. doi: 10.1161/JAHA.122.029062. Epub 2023 Jun 22. J Am Heart Assoc. 2023. PMID: 37345755 Free PMC article.
-
Association between body mass index and outcomes after percutaneous coronary intervention in multiethnic South East Asian population: a retrospective analysis of the Malaysian National Cardiovascular Disease Database-Percutaneous Coronary Intervention (NCVD-PCI) registry.BMJ Open. 2017 Nov 9;7(11):e017794. doi: 10.1136/bmjopen-2017-017794. BMJ Open. 2017. PMID: 29127228 Free PMC article.
-
Mobile Health Use by Older Individuals at Risk of Cardiovascular Disease and Type 2 Diabetes Mellitus in an Australian Cohort: Cross-sectional Survey Study.JMIR Mhealth Uhealth. 2022 Sep 7;10(9):e37343. doi: 10.2196/37343. JMIR Mhealth Uhealth. 2022. PMID: 36069764 Free PMC article.
-
Heart Failure With Preserved Ejection Fraction: Prevention and Management.Am J Lifestyle Med. 2017 Feb 1;13(2):182-189. doi: 10.1177/1559827617695219. eCollection 2019 Mar-Apr. Am J Lifestyle Med. 2017. PMID: 30800025 Free PMC article.
References
-
- Organisation for Economic Co-operation and Development . Obesity and the Economics of Prevention: Fit Not Fat. OECD: Paris, France; 2010.
-
- Thompson D, Edelsberg J, Colditz GA, Bird AP, Oster G. Lifetime health and economic consequences of obesity. Arch Intern Med. 1999;159:2177–2183. - PubMed
-
- Kortt MA, Langley PC, Cox ER. A review of cost-of-illness studies on obesity. Clin Ther. 1998;20:772–779. - PubMed
-
- Wilson PW, D'Agostino RB, Sullivan L, Parise H, Kannel WB. Overweight and obesity as determinants of cardiovascular risk: the Framingham experience. Arch Intern Med. 2002;162:1867–1872. - PubMed
-
- Hubert HB, Feinleib M, McNamara PM, Castelli WP. Obesity as an independent risk factor for cardiovascular disease: a 26-year follow-up of participants in the Framingham Heart Study. Circulation. 1983;67:968–977. - PubMed
Publication types
MeSH terms
LinkOut - more resources
Full Text Sources
Other Literature Sources
Medical
