

Using optoacoustic imaging for measuring the temperature dependence of Grüneisen parameter in optically absorbing solutions
- PMID: 24150350
- PMCID: PMC3867102
- DOI: 10.1364/OE.21.025077
Using optoacoustic imaging for measuring the temperature dependence of Grüneisen parameter in optically absorbing solutions
Abstract
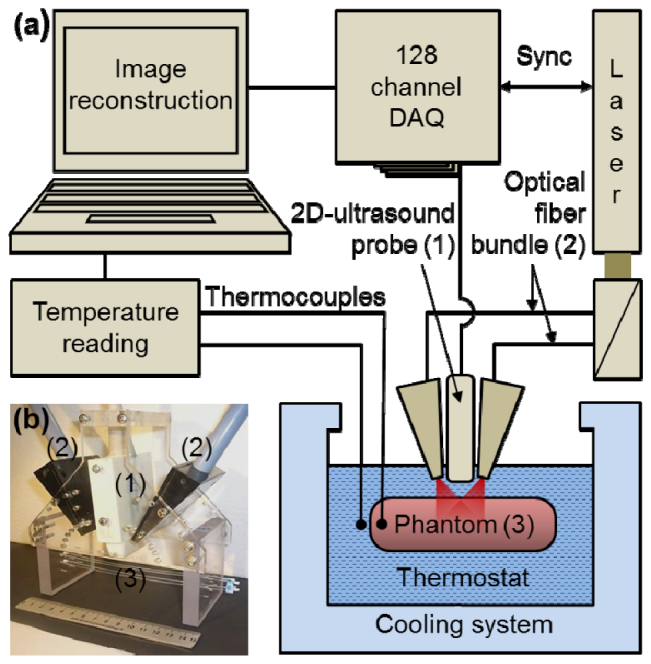
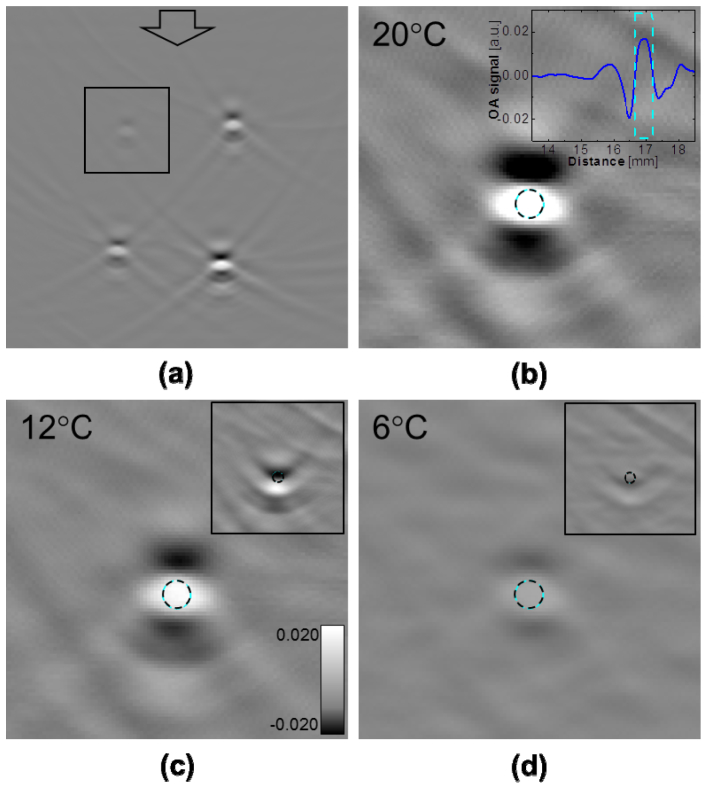
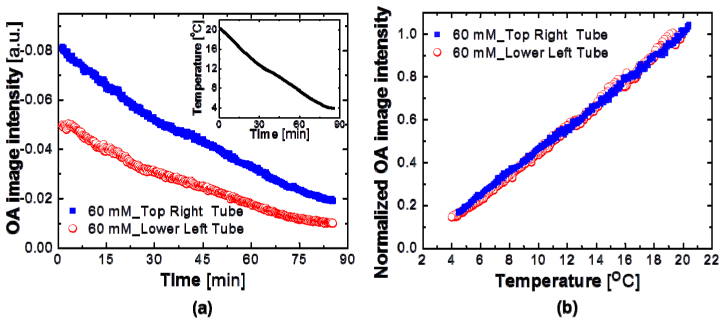
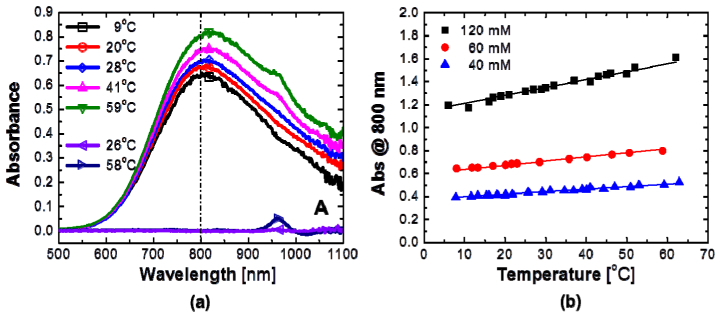
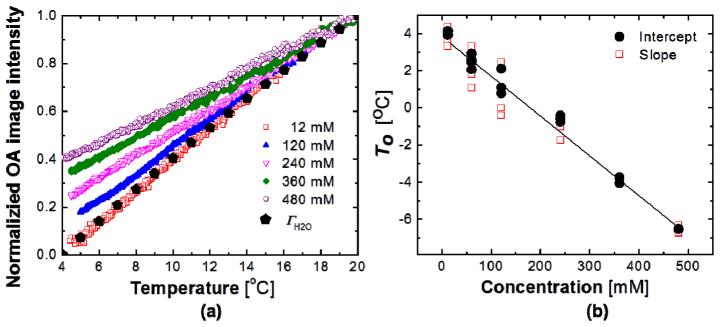
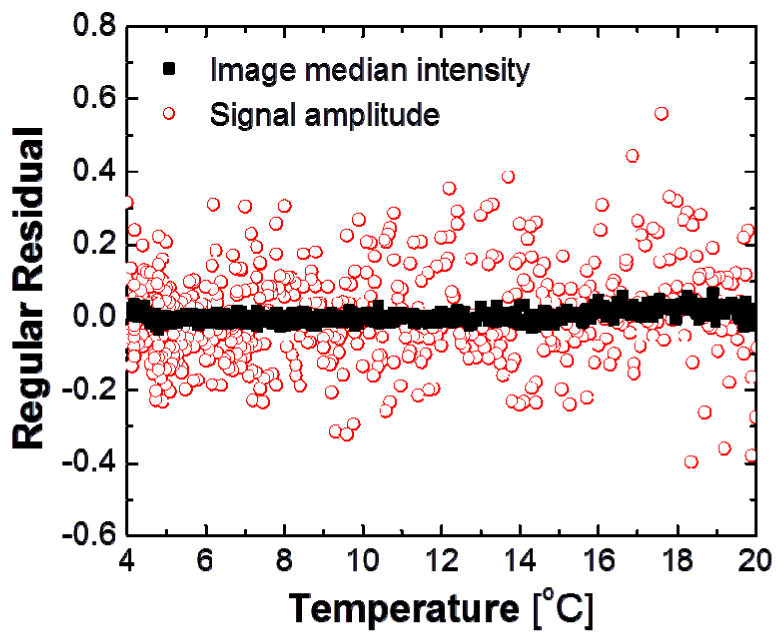
Grüneisen parameter is a key temperature-dependent physical characteristic responsible for thermoelastic efficiency of materials. We propose a new methodology for accurate measurements of temperature dependence of Grüneisen parameter in optically absorbing solutions. We use two-dimensional optoacoustic (OA) imaging to improve accuracy of measurements. Our approach eliminates contribution of local optical fluence and absorbance. To validate the proposed methodology, we studied temperature dependence of aqueous cupric sulfate solutions in the range from 22 to 4 °C. Our results for the most diluted salt perfectly matched known temperature dependence for the Grüneisen parameter of water. We also found that Grüneisen-temperature relationship for cupric sulfate exhibits linear trend with respect to the concentration. In addition to accurate measurements of Grüneisen changes with temperature, the developed technique provides a basis for future high precision OA temperature monitoring in live tissues.
Figures
Similar articles
-
Least squares QR-based decomposition provides an efficient way of computing optimal regularization parameter in photoacoustic tomography.J Biomed Opt. 2013 Aug;18(8):80501. doi: 10.1117/1.JBO.18.8.080501. J Biomed Opt. 2013. PMID: 23903561
-
Deep-tissue temperature mapping by multi-illumination photoacoustic tomography aided by a diffusion optical model: a numerical study.J Biomed Opt. 2018 Jan;23(1):1-10. doi: 10.1117/1.JBO.23.1.016014. J Biomed Opt. 2018. PMID: 29380565
-
Photothermoacoustic imaging of biological tissues: maximum depth characterization comparison of time and frequency-domain measurements.J Biomed Opt. 2009 Jul-Aug;14(4):044025. doi: 10.1117/1.3200924. J Biomed Opt. 2009. PMID: 19725736
-
Absolute photoacoustic thermometry in deep tissue.Opt Lett. 2013 Dec 15;38(24):5228-5231. doi: 10.1364/ol.38.005228. Opt Lett. 2013. PMID: 24322224 Free PMC article.
-
Temperature-dependent optoacoustic response and transient through zero Grüneisen parameter in optically contrasted media.Photoacoustics. 2017 Jun 23;7:36-46. doi: 10.1016/j.pacs.2017.06.002. eCollection 2017 Sep. Photoacoustics. 2017. PMID: 28725558 Free PMC article.
Cited by
-
Multiscale Functional and Molecular Photoacoustic Tomography.Ultrason Imaging. 2016 Jan;38(1):44-62. doi: 10.1177/0161734615584312. Epub 2015 May 1. Ultrason Imaging. 2016. PMID: 25933617 Free PMC article. Review.
-
Proton range verification in homogeneous materials through acoustic measurements.Phys Med Biol. 2018 Jan 17;63(2):025036. doi: 10.1088/1361-6560/aa9c1f. Phys Med Biol. 2018. PMID: 29160776 Free PMC article.
-
Photoacoustically guided wavefront shaping for enhanced optical focusing in scattering media.Nat Photonics. 2015 Feb;9(2):126-132. doi: 10.1038/nphoton.2014.322. Nat Photonics. 2015. PMID: 25914725 Free PMC article.
-
Towards non-contact photoacoustic imaging [review].Photoacoustics. 2020 Sep 23;20:100207. doi: 10.1016/j.pacs.2020.100207. eCollection 2020 Dec. Photoacoustics. 2020. PMID: 33024694 Free PMC article. Review.
-
GPU-accelerated 3D volumetric X-ray-induced acoustic computed tomography.Biomed Opt Express. 2020 Jan 13;11(2):752-761. doi: 10.1364/BOE.381963. eCollection 2020 Feb 1. Biomed Opt Express. 2020. PMID: 32133222 Free PMC article.
References
-
- A. A. Oraevsky and A. A. Karabutov, “Optoacoustic tomography,” in Biomedical Photonics Handbook, T. Vo-Dinh, ed. (CRC, 2003), pp. 34/31–34/34.
-
- S. Manohar, T. G. van Leeuwen, J. M. Klaase, F. M. van den Engh, and W. Steenbergen, “Photoacoustic mammography with a flat detection geometry,” in Photoaccoustic Imaging and Spectroscopy, L. V. Wang, ed. (CRC, 2009), pp. 431–442.
-
- A. A. Oraevsky, “Optoacoustic tomography of the breast,” in Photoaccoustic Imaging and Spectroscopy, L. V. Wang, ed. (CRC, 2009), pp. 411–429.
Publication types
MeSH terms
Substances
Grants and funding
LinkOut - more resources
Full Text Sources
Other Literature Sources
