. 2013 Nov;28(6):709-20.
doi: 10.1093/mutage/get051.

Comet assay in reconstructed 3D human epidermal skin models--investigation of intra- and inter-laboratory reproducibility with coded chemicals

Affiliations

Comet assay in reconstructed 3D human epidermal skin models--investigation of intra- and inter-laboratory reproducibility with coded chemicals

Astrid A Reus et al. Mutagenesis. 2013 Nov.

Abstract

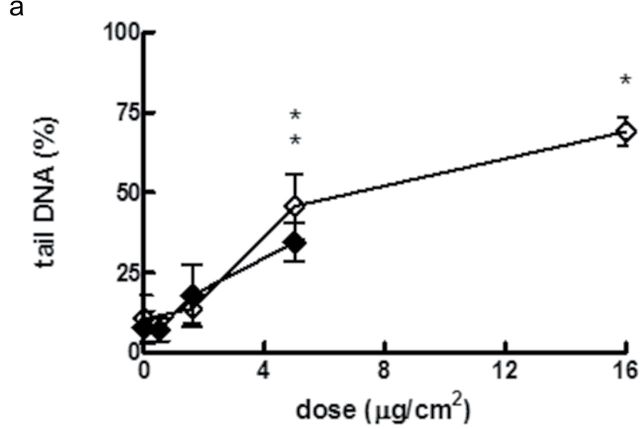
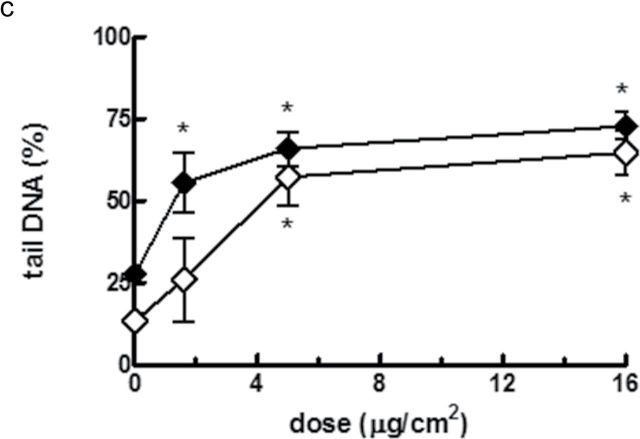
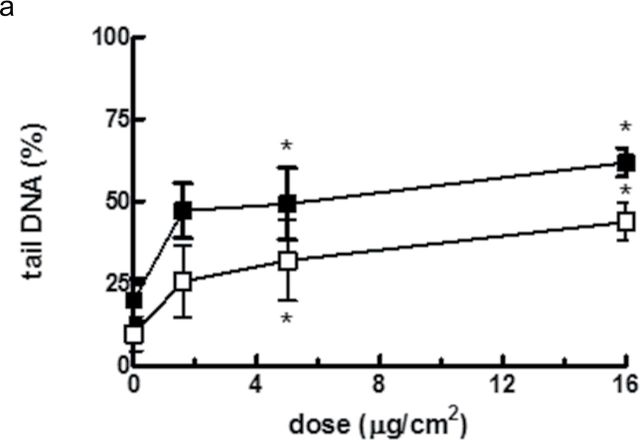
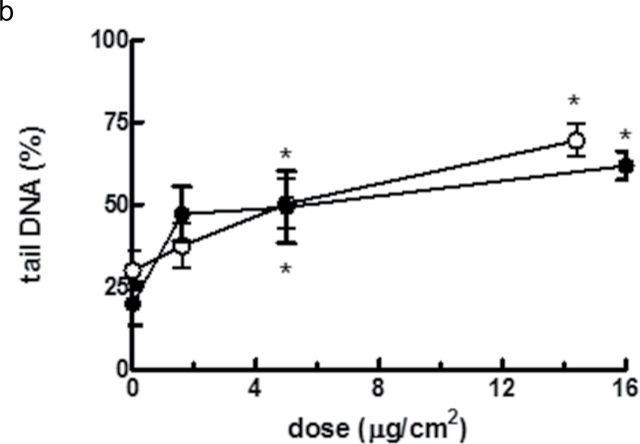
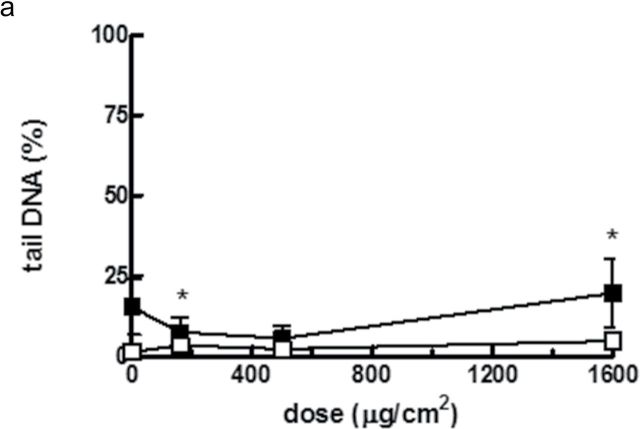
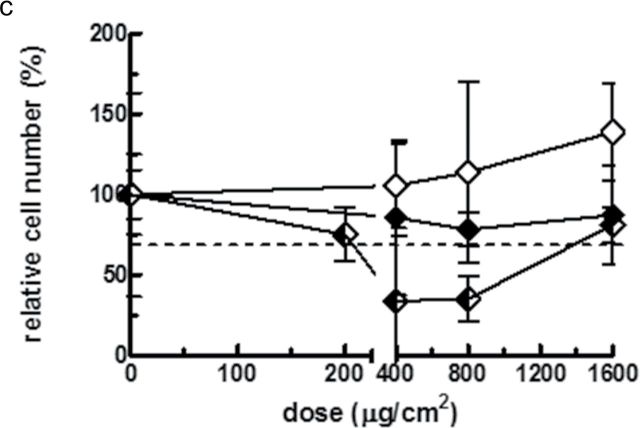
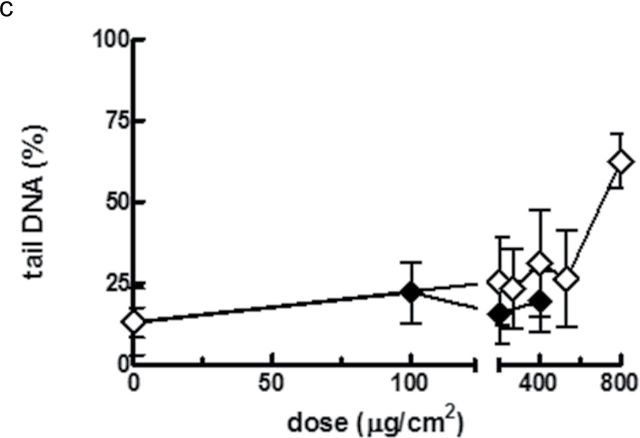
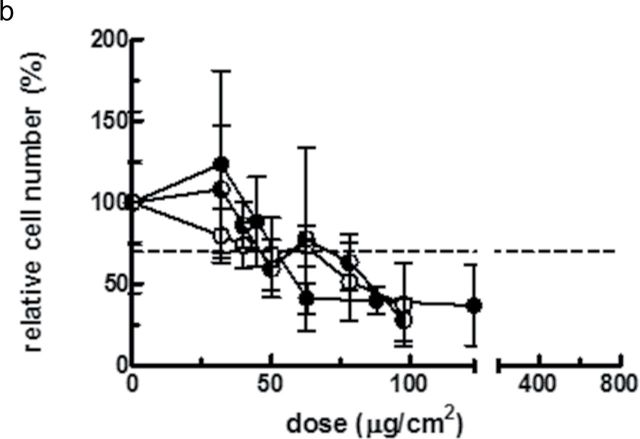
Reconstructed 3D human epidermal skin models are being used increasingly for safety testing of chemicals. Based on EpiDerm™ tissues, an assay was developed in which the tissues were topically exposed to test chemicals for 3h followed by cell isolation and assessment of DNA damage using the comet assay. Inter-laboratory reproducibility of the 3D skin comet assay was initially demonstrated using two model genotoxic carcinogens, methyl methane sulfonate (MMS) and 4-nitroquinoline-n-oxide, and the results showed good concordance among three different laboratories and with in vivo data. In Phase 2 of the project, intra- and inter-laboratory reproducibility was investigated with five coded compounds with different genotoxicity liability tested at three different laboratories. For the genotoxic carcinogens MMS and N-ethyl-N-nitrosourea, all laboratories reported a dose-related and statistically significant increase (P < 0.05) in DNA damage in every experiment. For the genotoxic carcinogen, 2,4-diaminotoluene, the overall result from all laboratories showed a smaller, but significant genotoxic response (P < 0.05). For cyclohexanone (CHN) (non-genotoxic in vitro and in vivo, and non-carcinogenic), an increase compared to the solvent control acetone was observed only in one laboratory. However, the response was not dose related and CHN was judged negative overall, as was p-nitrophenol (p-NP) (genotoxic in vitro but not in vivo and non-carcinogenic), which was the only compound showing clear cytotoxic effects. For p-NP, significant DNA damage generally occurred only at doses that were substantially cytotoxic (>30% cell loss), and the overall response was comparable in all laboratories despite some differences in doses tested. The results of the collaborative study for the coded compounds were generally reproducible among the laboratories involved and intra-laboratory reproducibility was also good. These data indicate that the comet assay in EpiDerm™ skin models is a promising model for the safety assessment of compounds with a dermal route of exposure.


Figures

Fig. 1.
Fig. 1.
Overview of the standard operating procedure for slide analysis. Even if a slide shows a homogenous distribution of cells, do not concentrate on one region but move across the slide along the arrow-defined manner (follow the dotted arrow in case there are not enough cells in one horizontal movement) (a), if many cells are present on the slide, randomly select three to four regions to represent the whole slide and (b), three examples of cells that fulfil the criteria of a round-shaped head, which is intense and homogenously stained (ce). Overlapping cells (f), cells outside the red frame that are too close to the border of the slide (g), cells with an irregular shaped, leaky head (h and i) or ghost cells (j) should not be analysed.
Fig. 2.
Fig. 2.
Percentage tail DNA in epidermal cells from EpiDerm™ after 3-h treatment with MMS at (a) Henkel, (b) P&G and (c) TNO. Within each set of results, separate studies are represented with different symbol shapes. Values are mean ± SD. *Significant increase over concurrent solvent control (P < 0.05).
Fig. 2.
Fig. 2.
Percentage tail DNA in epidermal cells from EpiDerm™ after 3-h treatment with MMS at (a) Henkel, (b) P&G and (c) TNO. Within each set of results, separate studies are represented with different symbol shapes. Values are mean ± SD. *Significant increase over concurrent solvent control (P < 0.05).
Fig. 3.
Fig. 3.
Percentage tail DNA in epidermal cells from EpiDerm™ after 3-h treatment with 4NQO at (a) Henkel, (b) P&G and (c) TNO. Within each set of results, separate studies are represented with different symbol shapes. Values are mean ± SD. *Significant increase over concurrent solvent control (P < 0.05).
Fig. 3.
Fig. 3.
Percentage tail DNA in epidermal cells from EpiDerm™ after 3-h treatment with 4NQO at (a) Henkel, (b) P&G and (c) TNO. Within each set of results, separate studies are represented with different symbol shapes. Values are mean ± SD. *Significant increase over concurrent solvent control (P < 0.05).
Fig. 4.
Fig. 4.
Percentage tail DNA in epidermal cells of EpiDerm™ after 3-h treatment with MMS at (a) Henkel, (b) P&G and (c) TNO. Within each set of results, separate studies are represented with different symbol shapes. Values are mean ± SD. *Significant increase over concurrent solvent control (P < 0.05).
Fig. 4.
Fig. 4.
Percentage tail DNA in epidermal cells of EpiDerm™ after 3-h treatment with MMS at (a) Henkel, (b) P&G and (c) TNO. Within each set of results, separate studies are represented with different symbol shapes. Values are mean ± SD. *Significant increase over concurrent solvent control (P < 0.05).
Fig. 5.
Fig. 5.
Percentage tail DNA in epidermal cells of EpiDerm™ after 3-h treatment with ENU at (a) Henkel, (b) P&G and (c) TNO. Within each set of results, separate studies are represented with different symbol shapes. Values are mean ± SD. *Significant increase over concurrent solvent control (P < 0.05).
Fig. 5.
Fig. 5.
Percentage tail DNA in epidermal cells of EpiDerm™ after 3-h treatment with ENU at (a) Henkel, (b) P&G and (c) TNO. Within each set of results, separate studies are represented with different symbol shapes. Values are mean ± SD. *Significant increase over concurrent solvent control (P < 0.05).
Fig. 6.
Fig. 6.
Percentage tail DNA in epidermal cells of EpiDerm™ after 3-h treatment with CHN at (a) Henkel, (b) P&G and (c) TNO. Within each set of results, separate studies are represented with different symbol shapes. Values are mean ± SD. *Significant increase over concurrent solvent control (P < 0.05).
Fig. 6.
Fig. 6.
Percentage tail DNA in epidermal cells of EpiDerm™ after 3-h treatment with CHN at (a) Henkel, (b) P&G and (c) TNO. Within each set of results, separate studies are represented with different symbol shapes. Values are mean ± SD. *Significant increase over concurrent solvent control (P < 0.05).
Fig. 7.
Fig. 7.
Relative epidermal cell numbers (%) of EpiDerm™ after 3-h treatment with 2,4-DAT at (a) Henkel, (b) P&G and (c) TNO. Within each set of results, separate studies are represented with different symbol shapes. Values are mean ± SD. The dashed line represents the 70% reference line.
Fig. 7.
Fig. 7.
Relative epidermal cell numbers (%) of EpiDerm™ after 3-h treatment with 2,4-DAT at (a) Henkel, (b) P&G and (c) TNO. Within each set of results, separate studies are represented with different symbol shapes. Values are mean ± SD. The dashed line represents the 70% reference line.
Fig. 7.
Fig. 7.
Relative epidermal cell numbers (%) of EpiDerm™ after 3-h treatment with 2,4-DAT at (a) Henkel, (b) P&G and (c) TNO. Within each set of results, separate studies are represented with different symbol shapes. Values are mean ± SD. The dashed line represents the 70% reference line.
Fig. 8.
Fig. 8.
Percentage tail DNA in epidermal cells of EpiDerm™ after 3-h treatment with 2,4-DAT at (a) Henkel, (b) P&G and (c) TNO. Within each set of results, separate studies are represented with different symbol shapes. Values are mean ± SD. *Significant increase over concurrent solvent control (P < 0.05).
Fig. 8.
Fig. 8.
Percentage tail DNA in epidermal cells of EpiDerm™ after 3-h treatment with 2,4-DAT at (a) Henkel, (b) P&G and (c) TNO. Within each set of results, separate studies are represented with different symbol shapes. Values are mean ± SD. *Significant increase over concurrent solvent control (P < 0.05).
Fig. 9.
Fig. 9.
Percentage tail DNA in epidermal cells of EpiDerm™ after 3-h treatment with p-NP at (a) Henkel, (b) P&G and (c) TNO. Within each set of results, separate studies are represented with different symbol shapes. Values are mean ± SD. *Significant increase over concurrent solvent control (P < 0.05).
Fig. 9.
Fig. 9.
Percentage tail DNA in epidermal cells of EpiDerm™ after 3-h treatment with p-NP at (a) Henkel, (b) P&G and (c) TNO. Within each set of results, separate studies are represented with different symbol shapes. Values are mean ± SD. *Significant increase over concurrent solvent control (P < 0.05).
Fig. 10.
Fig. 10.
Relative epidermal cell numbers (%) of EpiDerm™ after 3-h treatment with p-NP at (a) Henkel, (b) P&G and (c) TNO. Within each set of results, separate studies are represented with different symbol shapes. Values are mean ± SD. The dashed line represents the 70% reference line.
Fig. 10.
Fig. 10.
Relative epidermal cell numbers (%) of EpiDerm™ after 3-h treatment with p-NP at (a) Henkel, (b) P&G and (c) TNO. Within each set of results, separate studies are represented with different symbol shapes. Values are mean ± SD. The dashed line represents the 70% reference line.
Fig. 10.
Fig. 10.
Relative epidermal cell numbers (%) of EpiDerm™ after 3-h treatment with p-NP at (a) Henkel, (b) P&G and (c) TNO. Within each set of results, separate studies are represented with different symbol shapes. Values are mean ± SD. The dashed line represents the 70% reference line.

Similar articles

Cited by

  • Three dimensional and microphysiological bone marrow models detect in vivo positive compounds.
    David R, Gee S, Khan K, Wilson A, Doherty A. David R, et al. Sci Rep. 2021 Nov 9;11(1):21959. doi: 10.1038/s41598-021-01400-5. Sci Rep. 2021. PMID: 34754012 Free PMC article.
  • Extracellular signal-regulated kinases 1/2 and Akt contribute to triclosan-stimulated proliferation of JB6 Cl 41-5a cells.
    Wu Y, Beland FA, Chen S, Fang JL. Wu Y, et al. Arch Toxicol. 2015 Aug;89(8):1297-311. doi: 10.1007/s00204-014-1308-5. Epub 2014 Jul 18. Arch Toxicol. 2015. PMID: 25033989 Free PMC article.
  • State-of-the-art of 3D cultures (organs-on-a-chip) in safety testing and pathophysiology.
    Alépée N, Bahinski A, Daneshian M, De Wever B, Fritsche E, Goldberg A, Hansmann J, Hartung T, Haycock J, Hogberg H, Hoelting L, Kelm JM, Kadereit S, McVey E, Landsiedel R, Leist M, Lübberstedt M, Noor F, Pellevoisin C, Petersohn D, Pfannenbecker U, Reisinger K, Ramirez T, Rothen-Rutishauser B, Schäfer-Korting M, Zeilinger K, Zurich MG. Alépée N, et al. ALTEX. 2014;31(4):441-77. doi: 10.14573/altex.1406111. Epub 2014 Jul 14. ALTEX. 2014. PMID: 25027500 Free PMC article. Review.
  • Measuring DNA modifications with the comet assay: a compendium of protocols.
    Collins A, Møller P, Gajski G, Vodenková S, Abdulwahed A, Anderson D, Bankoglu EE, Bonassi S, Boutet-Robinet E, Brunborg G, Chao C, Cooke MS, Costa C, Costa S, Dhawan A, de Lapuente J, Bo' CD, Dubus J, Dusinska M, Duthie SJ, Yamani NE, Engelward B, Gaivão I, Giovannelli L, Godschalk R, Guilherme S, Gutzkow KB, Habas K, Hernández A, Herrero O, Isidori M, Jha AN, Knasmüller S, Kooter IM, Koppen G, Kruszewski M, Ladeira C, Laffon B, Larramendy M, Hégarat LL, Lewies A, Lewinska A, Liwszyc GE, de Cerain AL, Manjanatha M, Marcos R, Milić M, de Andrade VM, Moretti M, Muruzabal D, Novak M, Oliveira R, Olsen AK, Owiti N, Pacheco M, Pandey AK, Pfuhler S, Pourrut B, Reisinger K, Rojas E, Rundén-Pran E, Sanz-Serrano J, Shaposhnikov S, Sipinen V, Smeets K, Stopper H, Teixeira JP, Valdiglesias V, Valverde M, van Acker F, van Schooten FJ, Vasquez M, Wentzel JF, Wnuk M, Wouters A, Žegura B, Zikmund T, Langie SAS, Azqueta A. Collins A, et al. Nat Protoc. 2023 Mar;18(3):929-989. doi: 10.1038/s41596-022-00754-y. Epub 2023 Jan 27. Nat Protoc. 2023. PMID: 36707722 Free PMC article. Review.
  • Genetic toxicity testing using human in vitro organotypic airway cultures: Assessing DNA damage with the CometChip and mutagenesis by Duplex Sequencing.
    Wang Y, Mittelstaedt RA, Wynne R, Chen Y, Cao X, Muskhelishvili L, Davis K, Robison TW, Sun W, Schmidt EK, Smith TH, Norgaard ZK, Valentine CC, Yaplee J, Williams LN, Salk JJ, Heflich RH. Wang Y, et al. Environ Mol Mutagen. 2021 Jun;62(5):306-318. doi: 10.1002/em.22444. Epub 2021 Jun 14. Environ Mol Mutagen. 2021. PMID: 34050964 Free PMC article.

References

    1. Kirkland D., Aardema M., Henderson L., Müller L. (2005). Evaluation of the ability of a battery of three in vitro genotoxicity tests to discriminate rodent carcinogens and non-carcinogens I. Sensitivity, specificity and relative predictivity. Mutat. Res., 584, 1–256 - PubMed
    1. Kirkland D., Aardema M., Müller L., Makoto H. (2006). Evaluation of the ability of a battery of three in vitro genotoxicity tests to discriminate rodent carcinogens and non-carcinogens II. Further analysis of mammalian cell results, relative predictivity and tumour profiles. Mutat. Res., 608, 29–42 - PubMed
    1. Kirkland D., Pfuhler S., Tweats D., et al. (2007). How to reduce false positive results when undertaking in vitro genotoxicity testing and thus avoid unnecessary follow-up animal tests: report of an ECVAM Workshop. Mutat. Res., 628, 31–55 - PubMed
    1. Matthews E. J., Kruhlak N. L., Cimino M. C., Benz R. D., Contrera J. F. (2006). An analysis of genetic toxicity, reproductive and developmental toxicity, and carcinogenicity data: I. Identification of carcinogens using surrogate endpoints. Regul. Toxicol. Pharmacol., 44, 83–96 - PubMed
    1. EC 1907/2006. (2006). Regulation (EC) No 1907/2006 of the European Parliament and the Council of 18 December 2006, concerning the Registration, Evaluation, Authorization and Restriction of Chemicals (REACH), establishing a European Chemical Agency, amending Directive 1999/45/EC and repealing Council Regulation (EEC) No 793/03 and Commission Regulation (EC) No 1488/94 as well as Council Directive 76/769/EEC and Commission Directives 91/155/EC, 93/67/EC, 93/105/EC and 2000/21/EC. Official J. Eur. Union, 49, 1–849

Publication types