

Computational analysis of local membrane properties
- PMID: 24150904
- PMCID: PMC3882000
- DOI: 10.1007/s10822-013-9684-0
Computational analysis of local membrane properties
Abstract
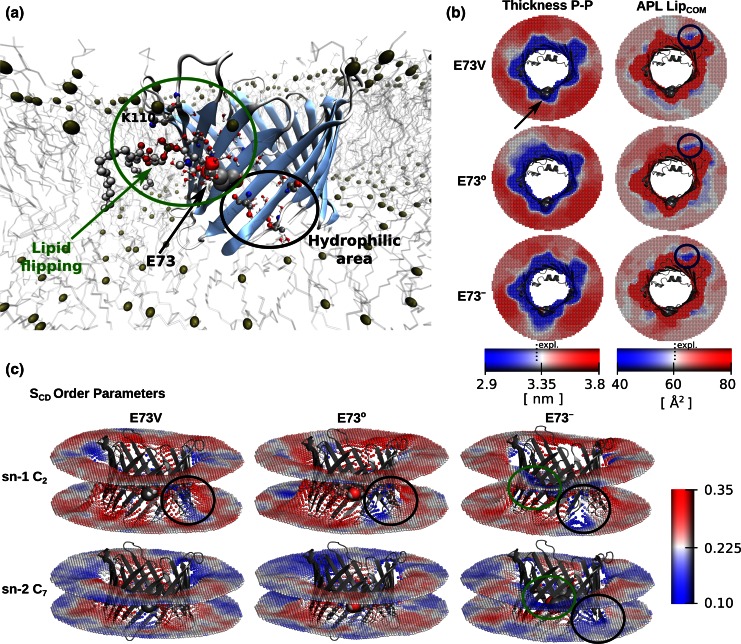
In the field of biomolecular simulations, dynamics of phospholipid membranes is of special interest. A number of proteins, including channels, transporters, receptors and short peptides are embedded in lipid bilayers and tightly interact with phospholipids. While the experimental measurements report on the spatial and/or temporal average membrane properties, simulation results are not restricted to the average properties. In the current study, we present a collection of methods for an efficient local membrane property calculation, comprising bilayer thickness, area per lipid, deuterium order parameters, Gaussian and mean curvature. The local membrane property calculation allows for a direct mapping of the membrane features, which subsequently can be used for further analysis and visualization of the processes of interest. The main features of the described methods are highlighted in a number of membrane systems, namely: a pure dimyristoyl-phosphatidyl-choline (DMPC) bilayer, a fusion peptide interacting with a membrane, voltage-dependent anion channel protein embedded in a DMPC bilayer, cholesterol enriched bilayer and a coarse grained simulation of a curved palmitoyl-oleoyl-phosphatidyl-choline lipid membrane. The local membrane property analysis proves to provide an intuitive and detailed view on the observables that are otherwise interpreted as averaged bilayer properties.
Figures


Similar articles
-
A systematically coarse-grained solvent-free model for quantitative phospholipid bilayer simulations.J Phys Chem B. 2010 Sep 2;114(34):11207-20. doi: 10.1021/jp102543j. J Phys Chem B. 2010. PMID: 20695631 Free PMC article.
-
The effects of oxidised phospholipids and cholesterol on the biophysical properties of POPC bilayers.Biochim Biophys Acta Biomembr. 2019 Jan;1861(1):210-219. doi: 10.1016/j.bbamem.2018.07.012. Epub 2018 Jul 25. Biochim Biophys Acta Biomembr. 2019. PMID: 30053406
-
The interaction of phospholipase A2 with a phospholipid bilayer: coarse-grained molecular dynamics simulations.Biophys J. 2008 Aug;95(4):1649-57. doi: 10.1529/biophysj.107.123190. Epub 2008 May 9. Biophys J. 2008. PMID: 18469074 Free PMC article.
-
Membrane simulations: bigger and better?Curr Opin Struct Biol. 2000 Apr;10(2):174-81. doi: 10.1016/s0959-440x(00)00066-x. Curr Opin Struct Biol. 2000. PMID: 10753807 Review.
-
Acyl chain order parameter profiles in phospholipid bilayers: computation from molecular dynamics simulations and comparison with 2H NMR experiments.Eur Biophys J. 2007 Nov;36(8):919-31. doi: 10.1007/s00249-007-0192-9. Epub 2007 Jun 28. Eur Biophys J. 2007. PMID: 17598103 Review.
Cited by
-
From complex data to clear insights: visualizing molecular dynamics trajectories.Front Bioinform. 2024 Apr 11;4:1356659. doi: 10.3389/fbinf.2024.1356659. eCollection 2024. Front Bioinform. 2024. PMID: 38665177 Free PMC article. Review.
-
Bayesian nonparametric analysis of residence times for protein-lipid interactions in Molecular Dynamics simulations.bioRxiv [Preprint]. 2025 Mar 4:2024.11.07.622502. doi: 10.1101/2024.11.07.622502. bioRxiv. 2025. Update in: J Chem Theory Comput. 2025 Apr 22;21(8):4203-4220. doi: 10.1021/acs.jctc.4c01522. PMID: 40093144 Free PMC article. Updated. Preprint.
-
Bayesian Nonparametric Analysis of Residence Times for Protein-Lipid Interactions in Molecular Dynamics Simulations.J Chem Theory Comput. 2025 Apr 22;21(8):4203-4220. doi: 10.1021/acs.jctc.4c01522. Epub 2025 Apr 2. J Chem Theory Comput. 2025. PMID: 40172093
-
The determination of the effect(s) of solute carrier family 22-member 2 (SLC22A2) haplotype variants on drug binding via molecular dynamic simulation systems.Sci Rep. 2022 Oct 8;12(1):16936. doi: 10.1038/s41598-022-21291-4. Sci Rep. 2022. PMID: 36209293 Free PMC article.
-
Elastic moduli of normal and cancer cell membranes revealed by molecular dynamics simulations.Phys Chem Chem Phys. 2022 Mar 9;24(10):6225-6237. doi: 10.1039/d1cp04836h. Phys Chem Chem Phys. 2022. PMID: 35229839 Free PMC article.
References
-
- Valiyaveetil F, Zhou Y, MacKinnon R (2002) Lipids in the structure, folding, and function of the KcsA K+ channel. Biochem Cell Biol 41(35):10771–10777 - PubMed
Publication types
MeSH terms
Substances
LinkOut - more resources
Full Text Sources
Other Literature Sources
