. 2014 Feb;82 Suppl 2(0 2):164-74.
doi: 10.1002/prot.24448. Epub 2013 Dec 17.

CASP10 results compared to those of previous CASP experiments

Affiliations

CASP10 results compared to those of previous CASP experiments

Andriy Kryshtafovych et al. Proteins. 2014 Feb.

Abstract

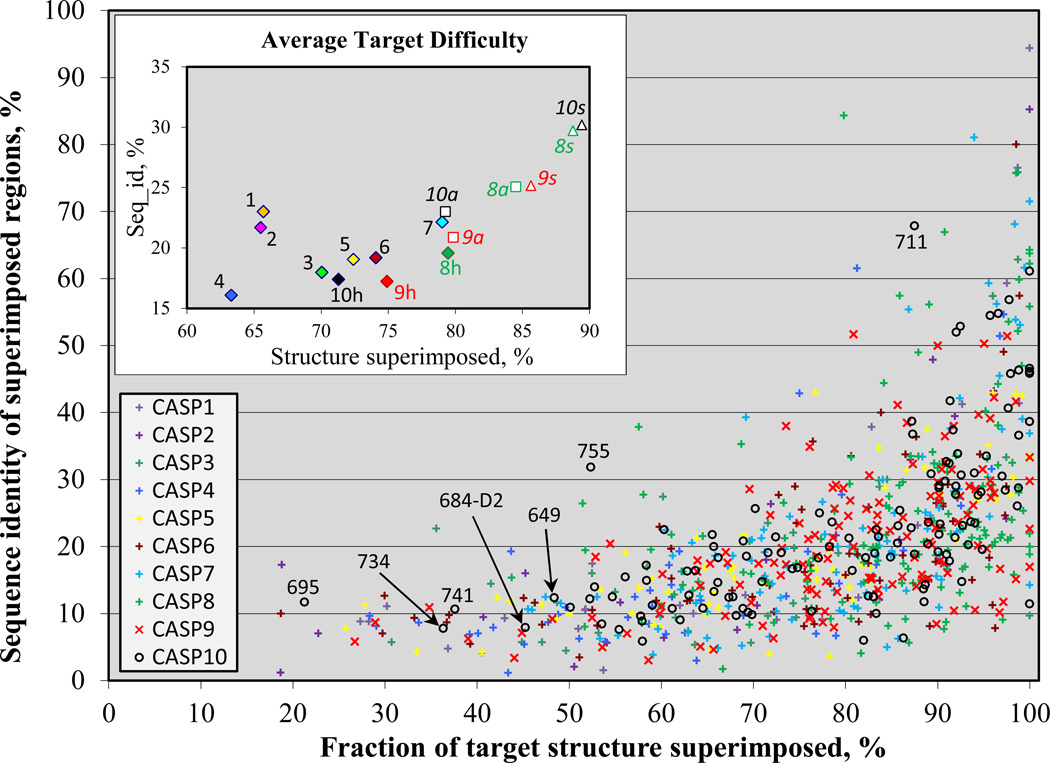
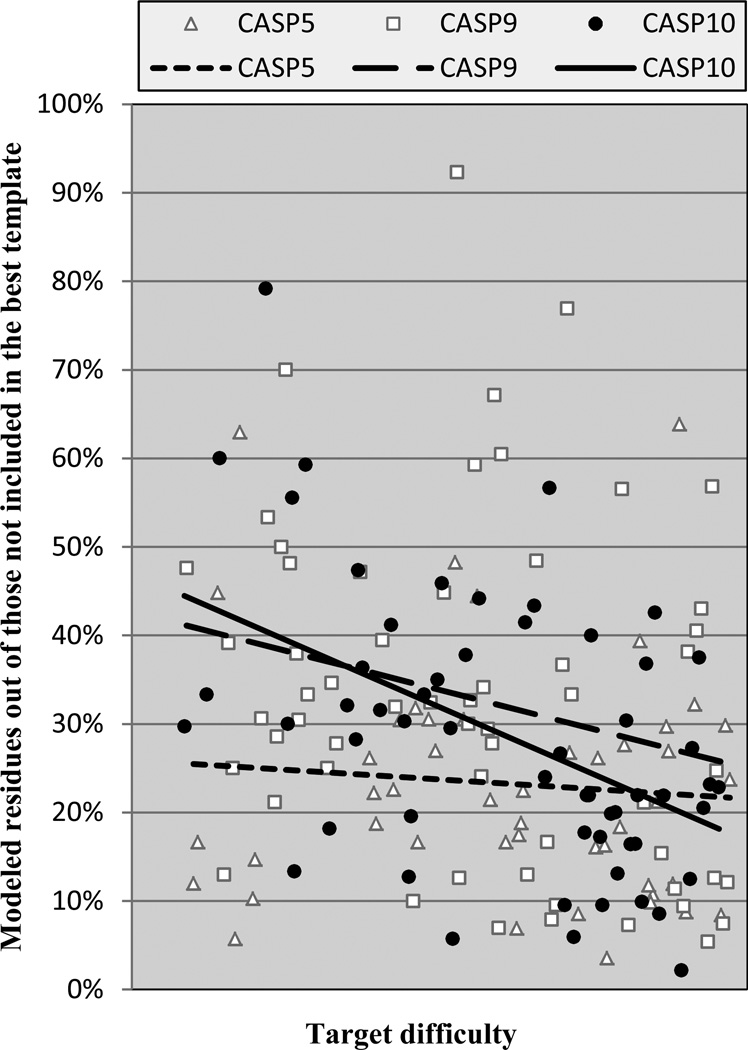
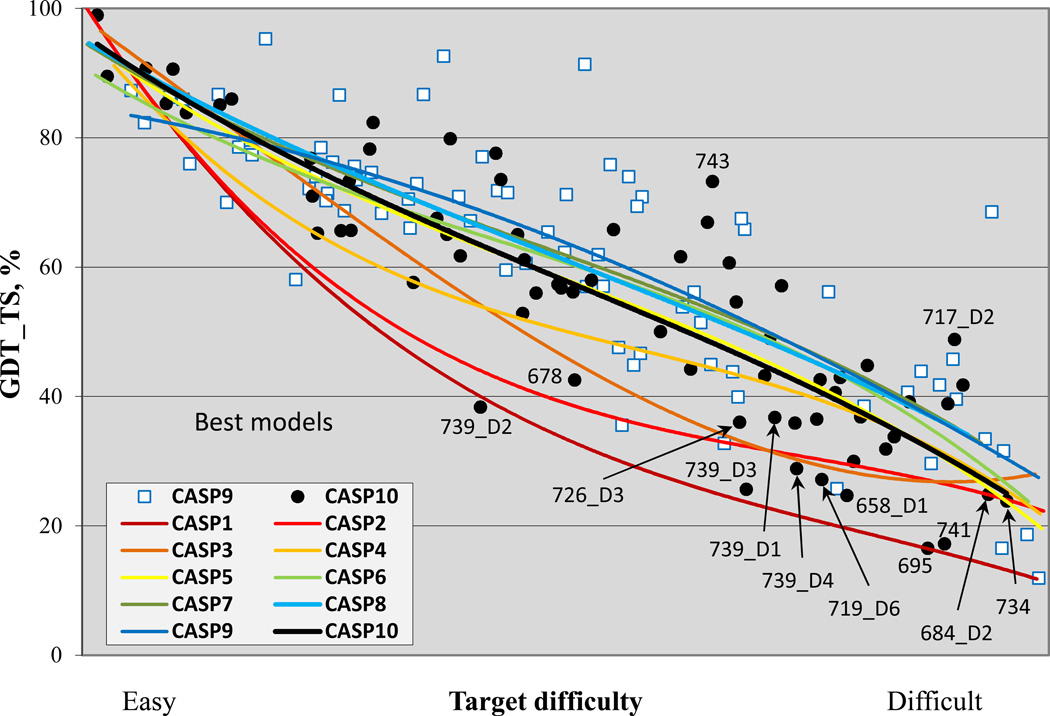
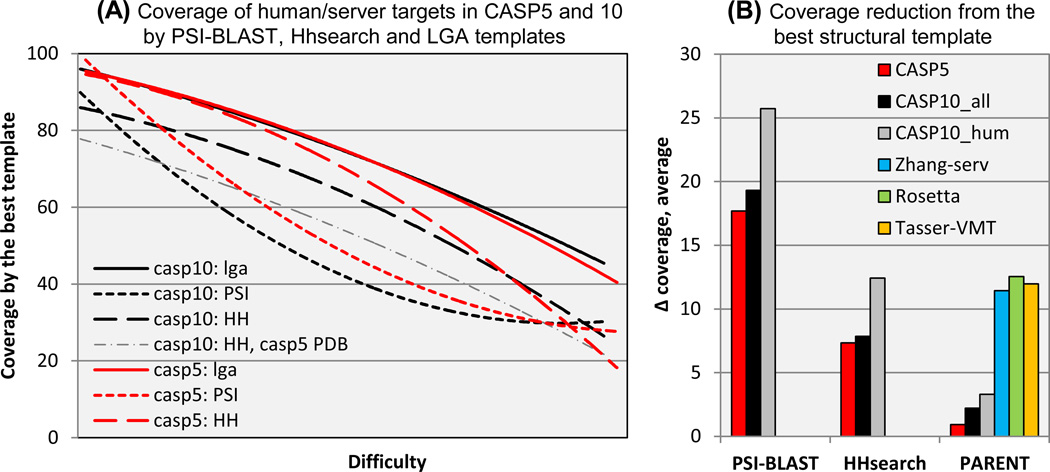
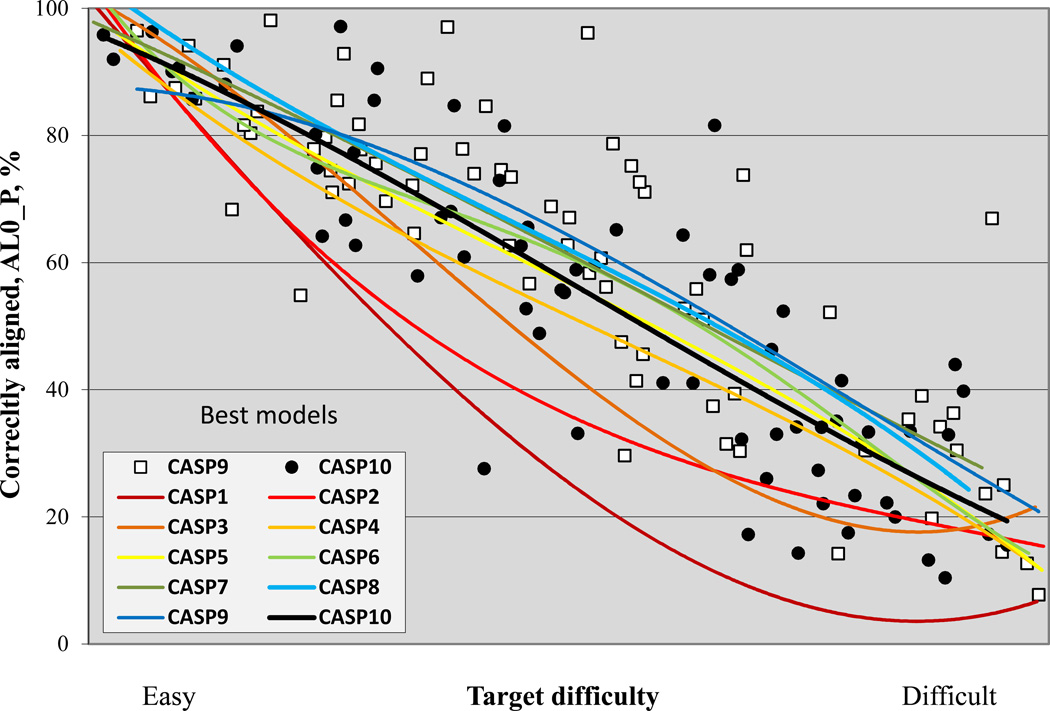
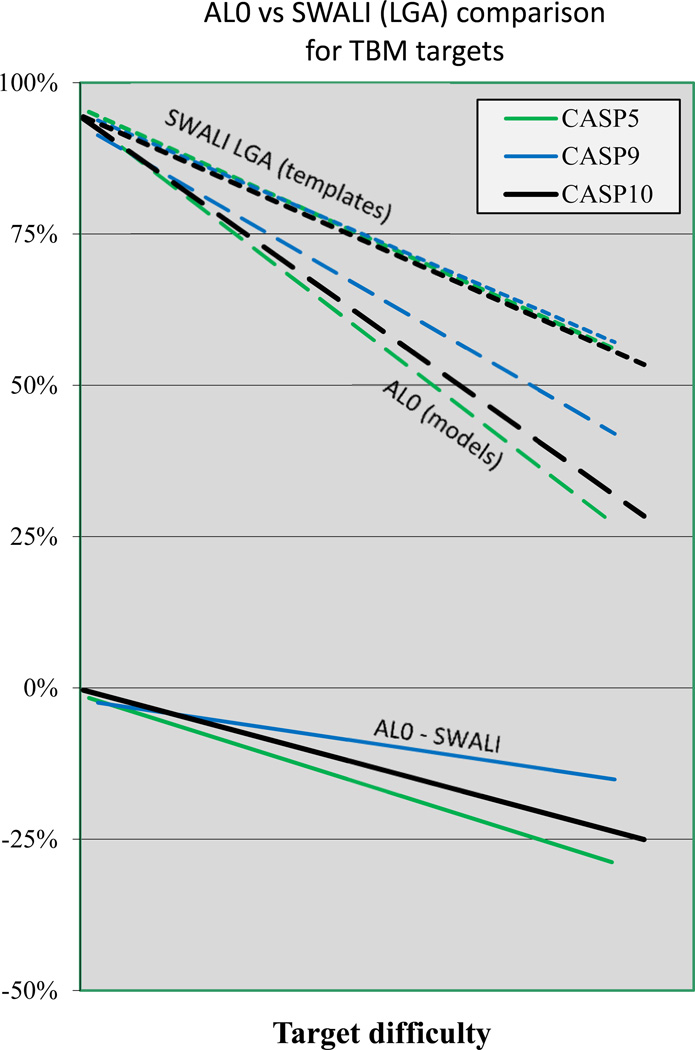
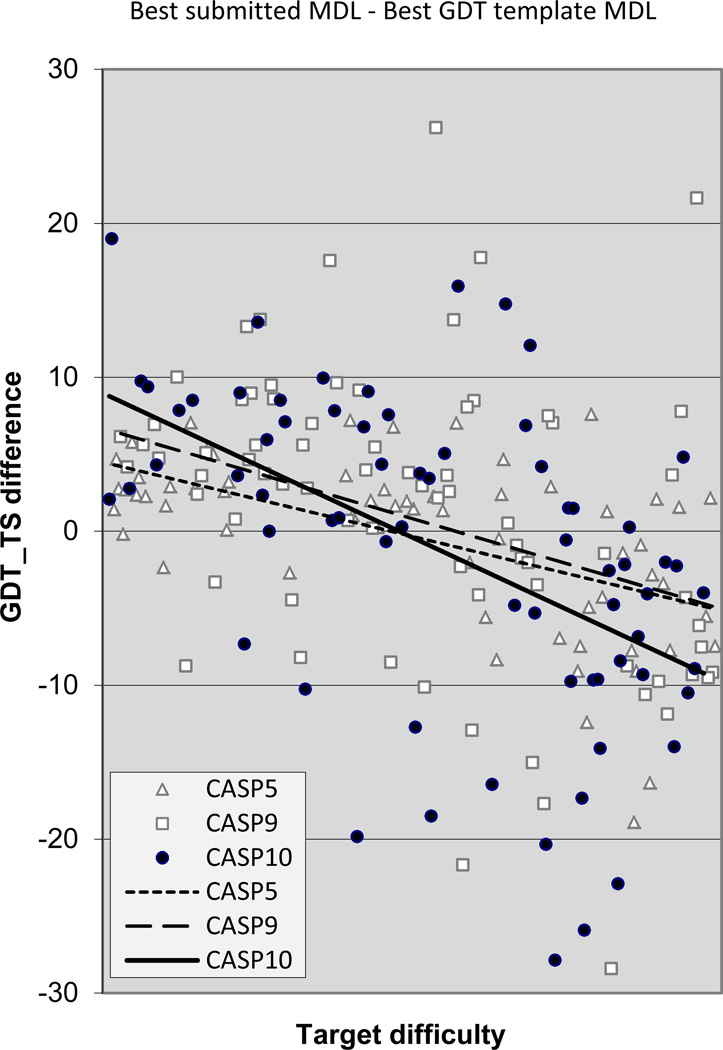
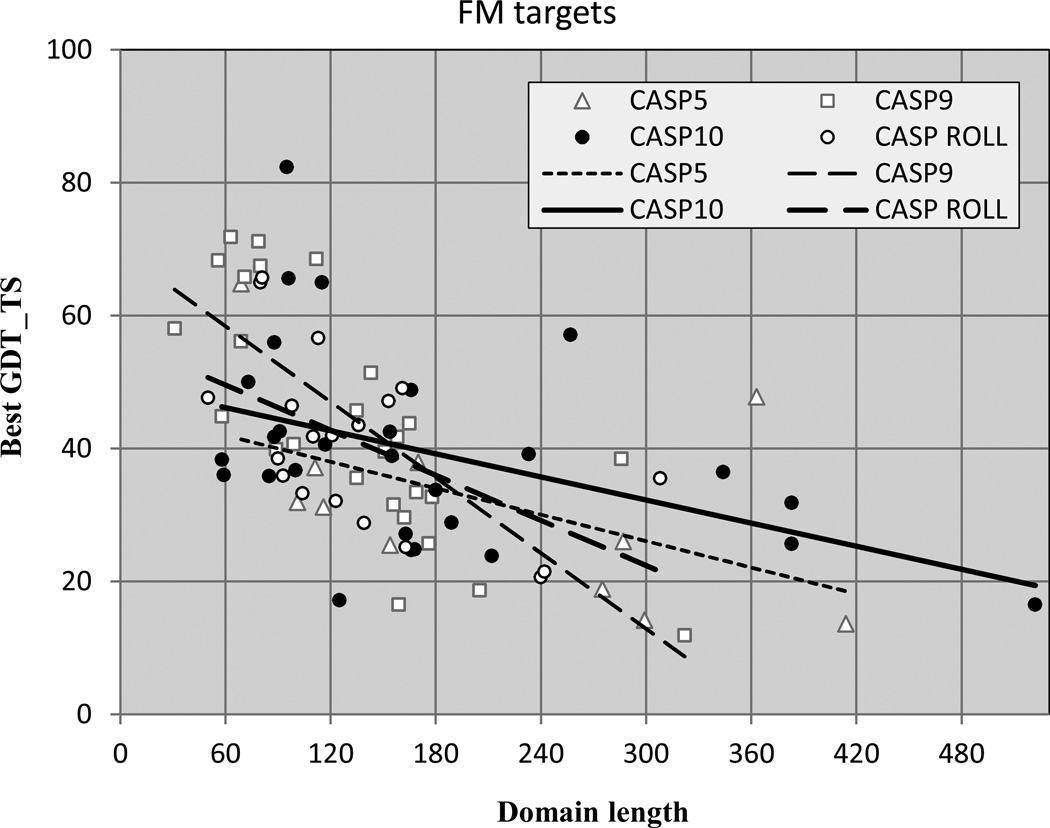
We compare results of the community efforts in modeling protein structures in the tenth CASP experiment, with those in earlier CASPs particularly in CASP5, a decade ago. There is a substantial improvement in template based model accuracy as reflected in more successful modeling of regions of structure not easily derived from a single experimental structure template, most likely reflecting intensive work within the modeling community in developing methods that make use of multiple templates, as well as the increased number of experimental structures available. Deriving structural information not obvious from a template is the most demanding as well as one of the most useful tasks that modeling can perform. Thus this is gratifying progress. By contrast, overall backbone accuracy of models appears little changed in the last decade. This puzzling result is explained by two factors--increased database size in some ways makes it harder to choose the best available templates, and the increased intrinsic difficulty of CASP targets as experimental work has progressed to larger and more unusual structures. There is no detectable recent improvement in template-free modeling, but again, this may reflect the changing nature of CASP targets.

Keywords: CASP; community wide experiment; protein structure prediction.


Figures

Figure 1
Figure 1
Relative modeling difficulty of CASP targets, as a function of the fraction of each target that can be superimposed on a known structure (horizontal axis) and the sequence identity between target and template for the superimposed region (vertical axis). Each point represents one target. Inset shows the average values for each CASP. For recent CASPs, averages are shown for server only targets (marked with an “_s” suffix), human/server targets (“_h”), and complete set of targets (“_all”). CASP10 human/server targets are on average of similar difficulty to those of CASP5, by these measures.
Figure 2
Figure 2
% of residues successfully modeled that were not available from the single best template. Each point represents the best model for a human/server target for CASPs 9 and 10, and all targets for CASP5. CASP10 performance is similar to that found in CASP9, and markedly improved over CASP5.
Figure 3
Figure 3
Best GDT_TS scores of submitted models for targets in all CASPs, as a function of target difficulty. For recent CASPs, human/server targets are included, and in earlier CASPs, all targets. Trend lines show little significant change in this measure since CASP5.
Figure 4
Figure 4
Radius of gyration of CASP targets as a function of target length. Dashed lines mark the boundaries +/−2.5Å on either side of a line (not shown) derived from fitting to high resolution crystal structures. CASP10 has a number of unusually high radius targets (one at 60Å, not shown).
Figure 5
Figure 5
(A): Target coverage provided by three classes of template: best available (solid lines), best detectable using HHsearch (long dashes), and best using PSI-BLAST (short dashes). With both sequence-based methods, achievable coverage is substantially lower than the provided by the best available template, and lower in CASP10 (black lines) than in CASP5 (red lines), showing that good templates are harder to find in recent CASPs. The dash-dotted line shows coverage of CASP10 targets obtained using HHsearch and the CASP5 structure database. The low coverage indicates that increased database size is not the primary cause of increased difficulty in finding good templates in CASP10. (B): Average loss of coverage relative to the best available template for the best templates found with the methods shown in panel (A) and for templates declared by three of the best performing CASP10 servers. With both PSI-BLAST and HHsearch, loss of coverage is substantial and larger for the CASP10 human targets than for those of CASP5. Declared parent lists for best models do contain near optimal templates, but typically amongst many others. Best templates for CASP10 human targets returned by the selected servers have similar coverage to HHsearch. This view of the data further supports the conclusion that identification of near optimal templates has become substantially harder since CASP5.
Figure 6
Figure 6
% of residues correctly aligned for the best model of each target in all CASPs. Trend lines are similar to those in the equivalent GDT_TS plot (Figure 3), indicating that for many targets, alignment accuracy, together with the fraction of residues that can be aligned to a single template, dominate model quality.
Figure 7
Figure 7
Alignment accuracy relative to the maximum that could be obtained using the single best template. Top: trend lines as a function of target difficulty for the maximum % of alignable residues (‘SWALI’) and for the fraction aligned for submitted best models (‘AL0’), for CASPs 5, 9 and 10. Alignment accuracy is similar in these three CASPs. Bottom: % difference between aligned residues (AL0) and maximum alignable residues (SWALI). The average fraction of residues not aligned ranges from a few percent for easy targets to ~25% at the difficult end of the scale.
Figure 8
Figure 8
Difference in GDT_TS score between the best submitted model for each target and a naïve model based on knowledge of the best single template. Values greater than zero indicate added value in the best model. In CASPs 9 and 10 there are number of targets with a net gain of greater than 10% over the naïve model, but none in CASP5. There are also models with loss of greater than 20% in CASPs 9 and 10, but none in CASP5, indicating the difficult nature of some recent CASP targets.
Figure 9
Figure 9
Accuracy of the best models for template free targets, as a function of target length. In CASPs 9, 10 and in CASP ROLL, there are a number of models of short targets with high GDT_TS scores, but only one in CASP5. Methods are not currently effective for bigger targets.

References

    1. Moult J. A decade of CASP: progress, bottlenecks and prognosis in protein structure prediction. Curr Opin Struct Biol. 2005;15:285–289. - PubMed
    1. Kryshtafovych A, Venclovas C, Fidelis K, Moult J. Progress over the first decade of CASP experiments. Proteins. 2005;61(Suppl 7):225–236. - PubMed
    1. Kryshtafovych A, Fidelis K, Moult J. CASP9 results compared to those of previous CASP experiments. Proteins. 2011;79(Suppl 10):196–207. - PMC - PubMed
    1. Kryshtafovych A, Fidelis K, Moult J. CASP8 results in context of previous experiments. Proteins. 2009;77(Suppl 9):217–228. - PMC - PubMed
    1. Kryshtafovych A, Fidelis K, Moult J. Progress from CASP6 to CASP7. Proteins. 2007;69:194–207. - PubMed

LinkOut - more resources