. 2013 Oct;25(10):4209-26.
doi: 10.1105/tpc.113.117390. Epub 2013 Oct 22.

A mediator of singlet oxygen responses in Chlamydomonas reinhardtii and Arabidopsis identified by a luciferase-based genetic screen in algal cells

Affiliations

A mediator of singlet oxygen responses in Chlamydomonas reinhardtii and Arabidopsis identified by a luciferase-based genetic screen in algal cells

Ning Shao et al. Plant Cell. 2013 Oct.

Abstract

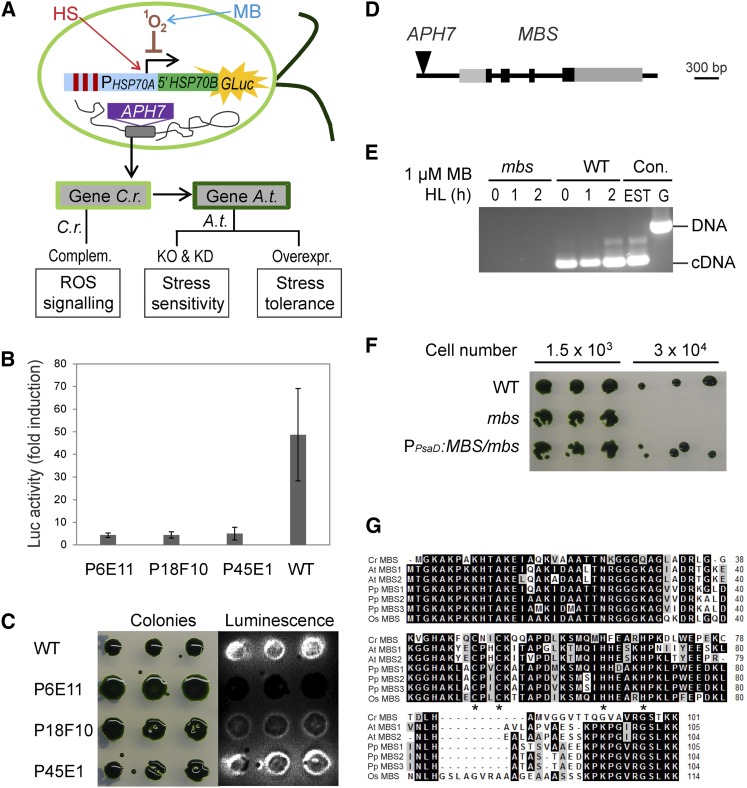
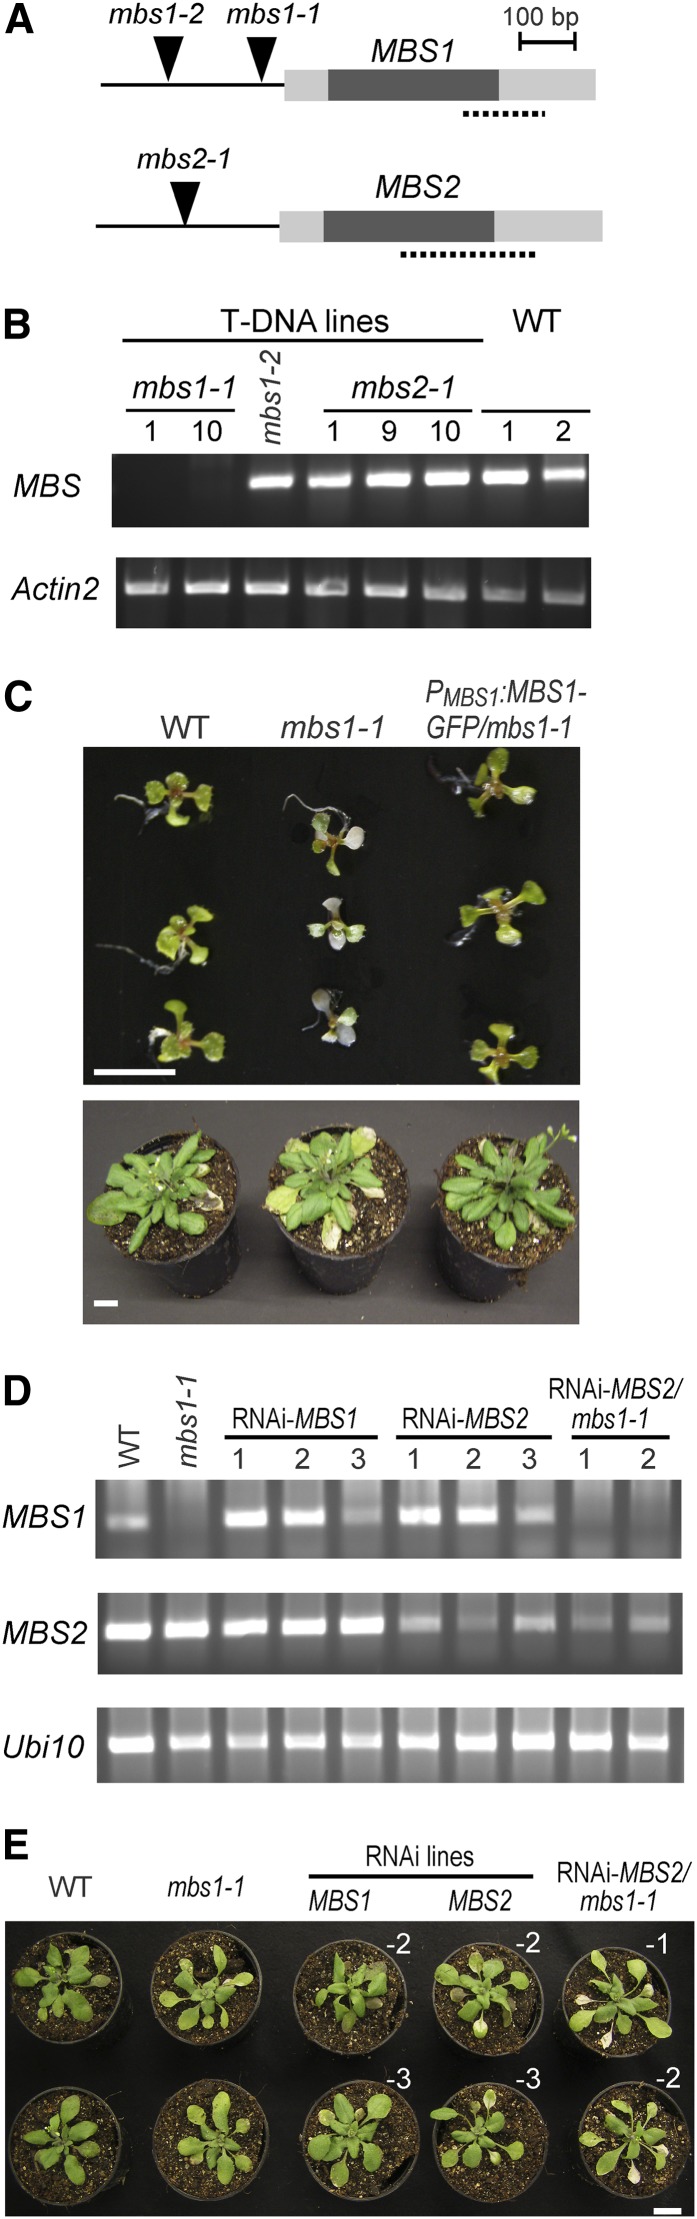
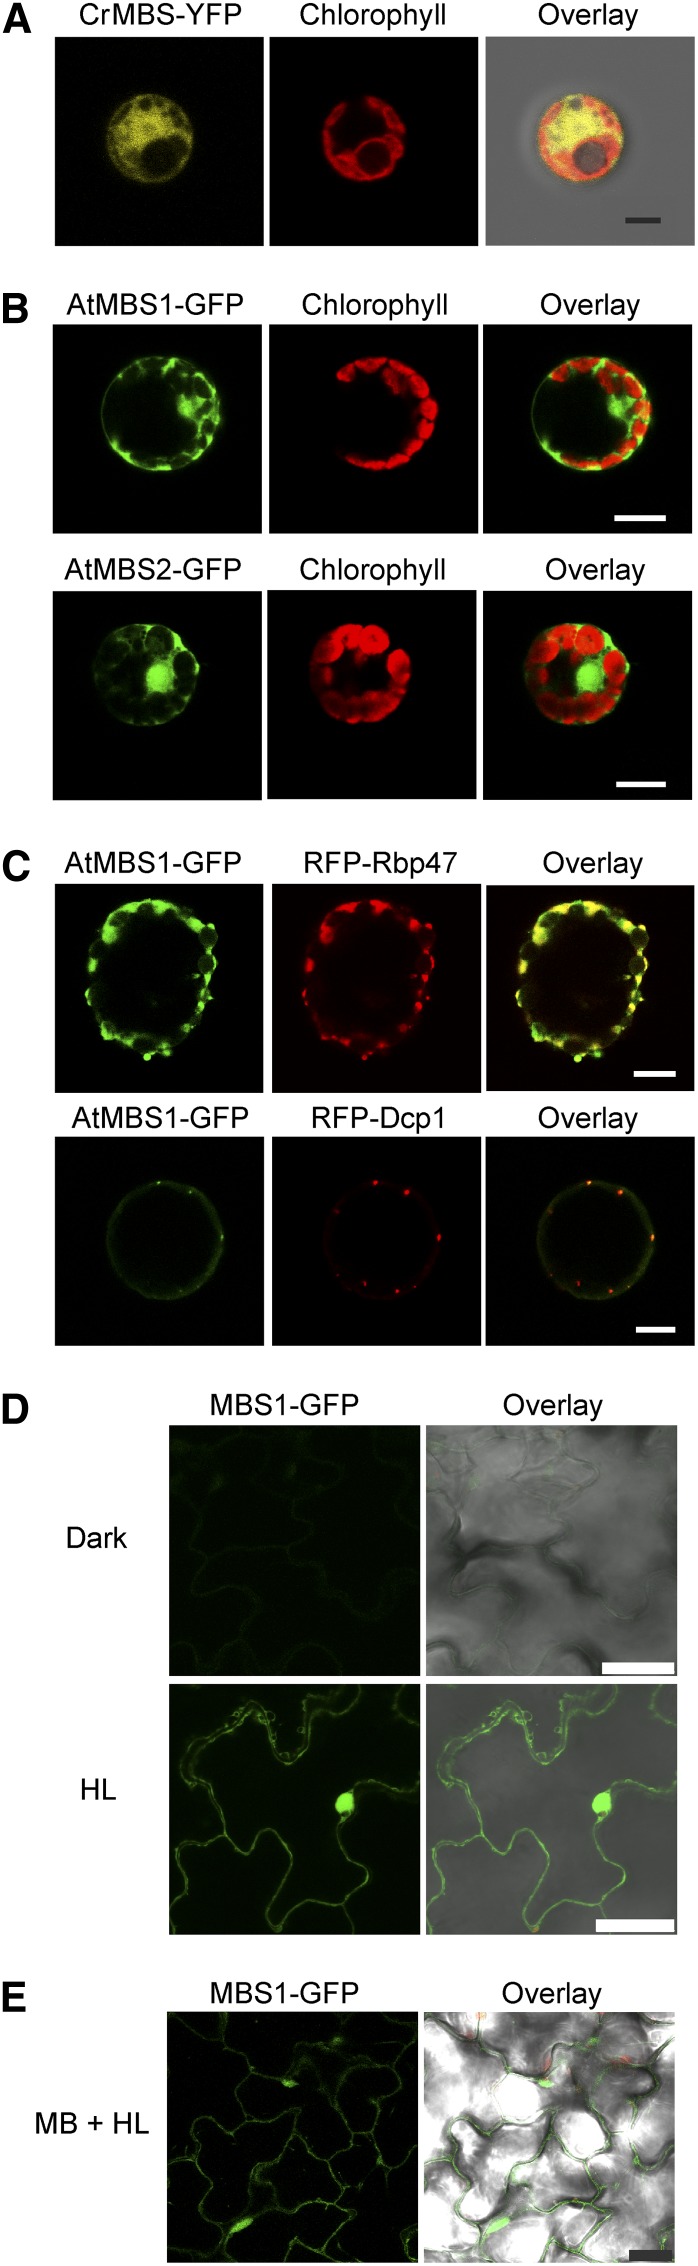
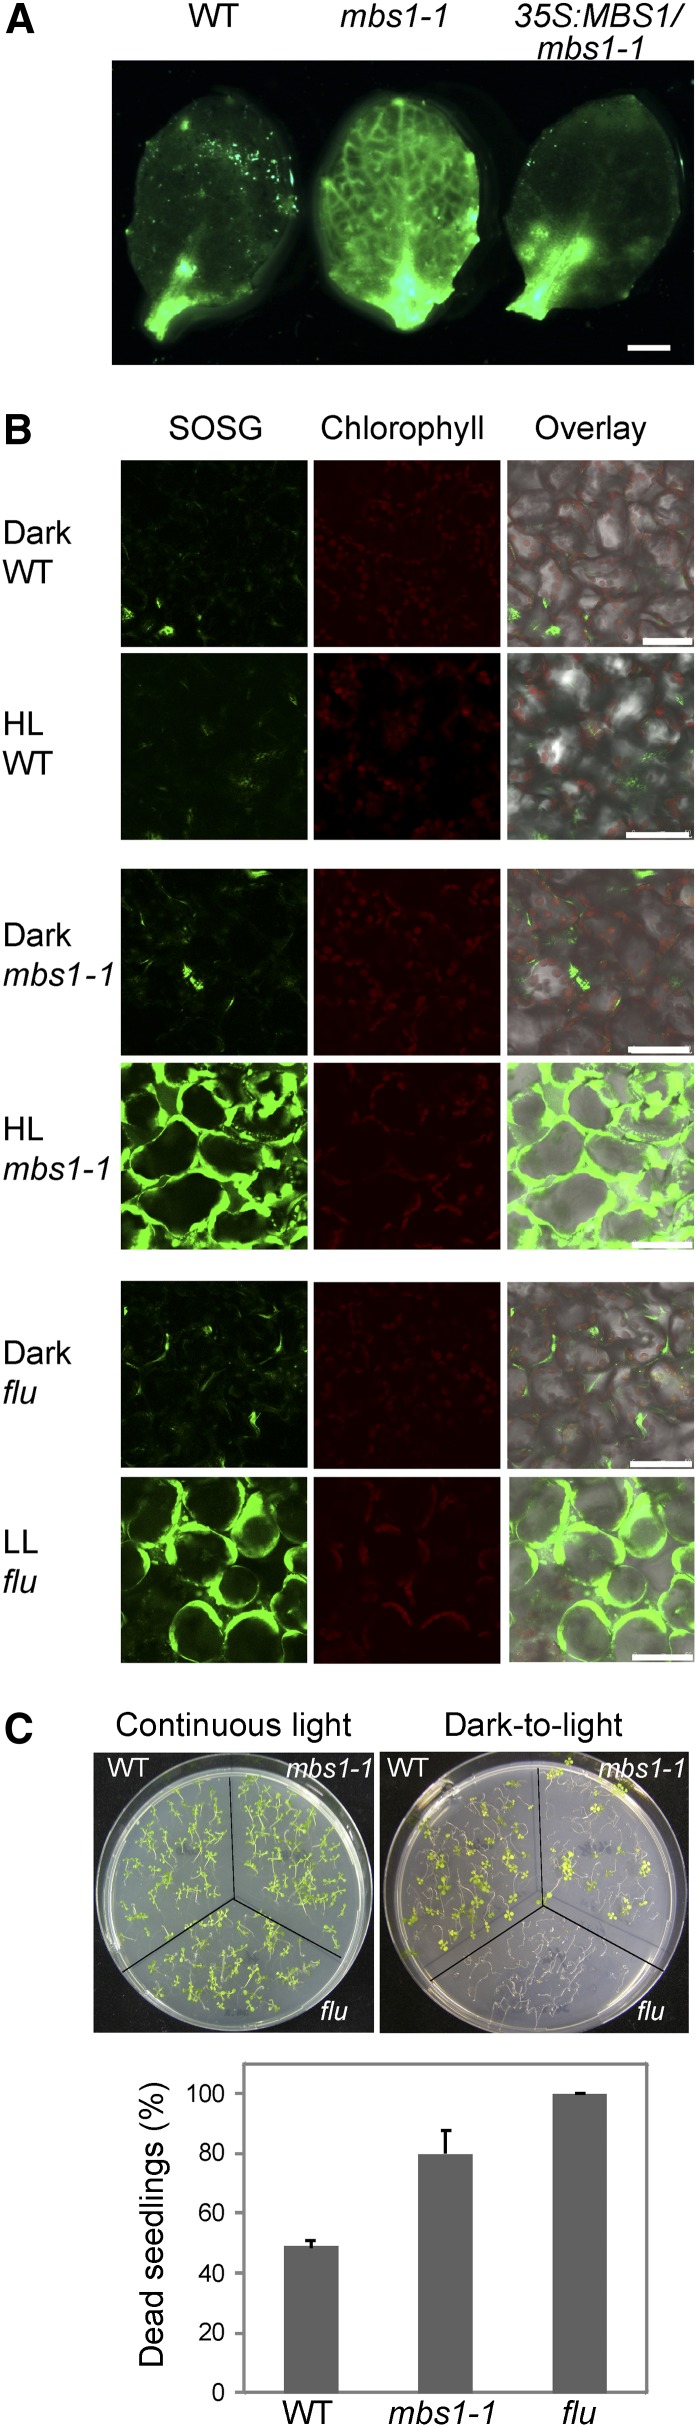
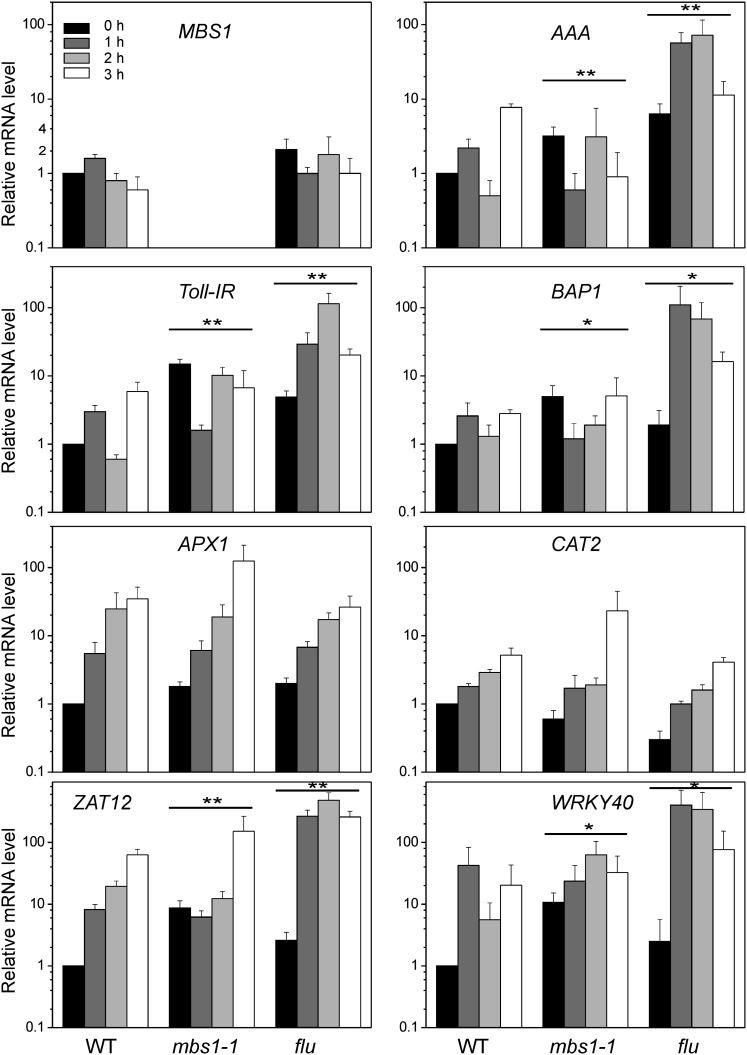
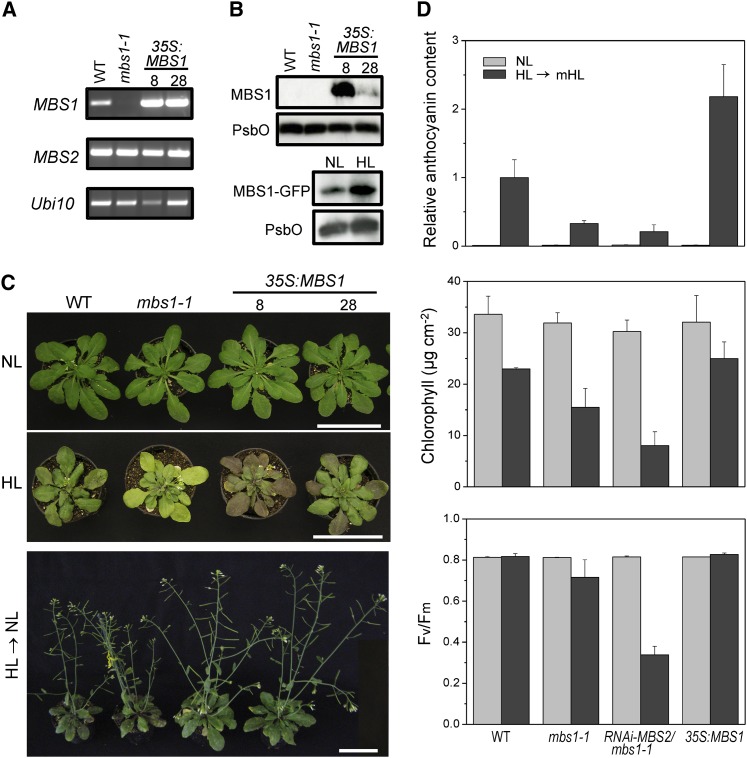
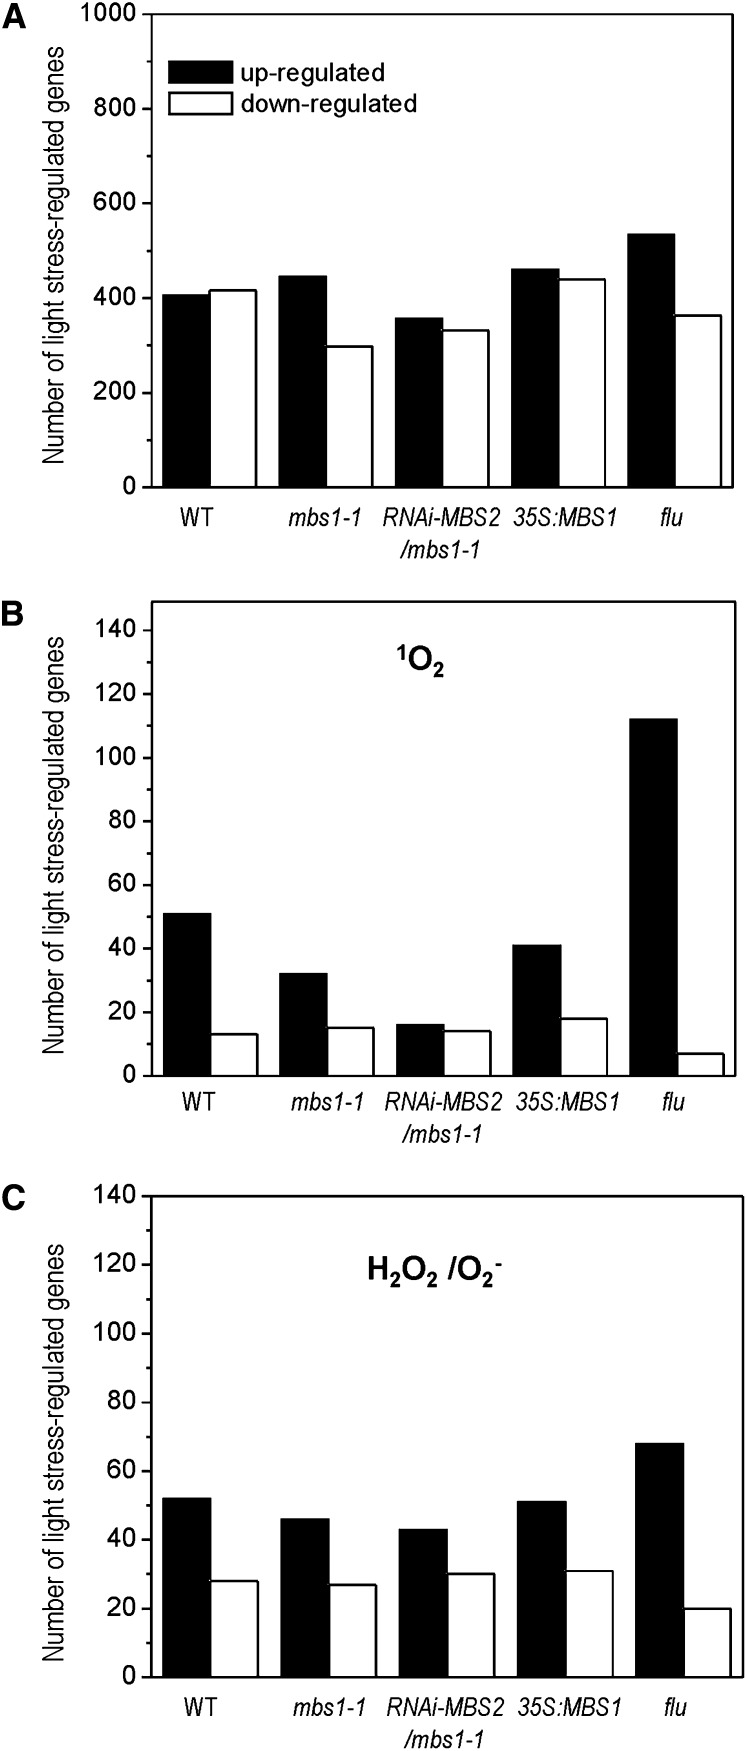
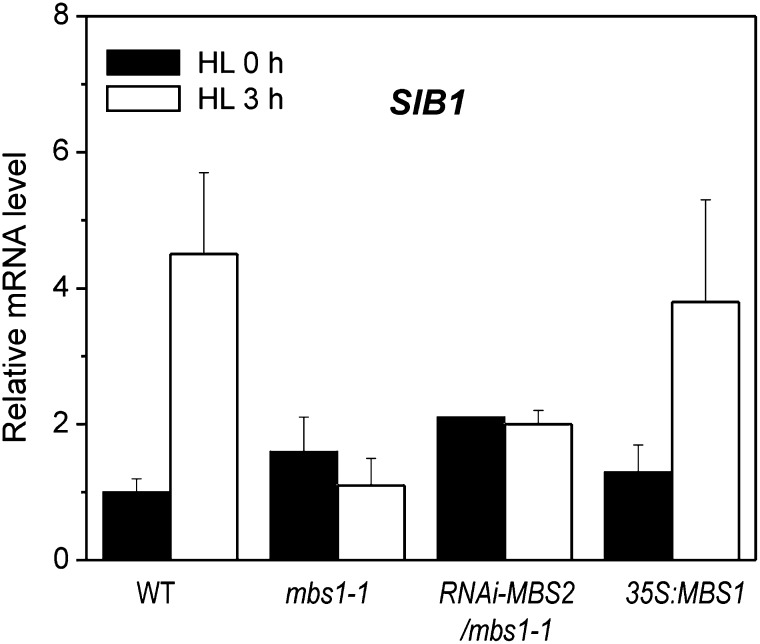
All cells produce reactive oxygen species (ROS) as by-products of their metabolism. In addition to being cytotoxic, ROS act as regulators of a wide range of developmental and physiological processes. Little is known about the molecular mechanisms underlying the perception of ROS and initiation of cellular responses in eukaryotes. Using the unicellular green alga Chlamydomonas reinhardtii, we developed a genetic screen for early components of singlet oxygen signaling. Here, we report the identification of a small zinc finger protein, methylene blue sensitivity (MBS), that is required for induction of singlet oxygen-dependent gene expression and, upon oxidative stress, accumulates in distinct granules in the cytosol. Loss-of-function mbs mutants produce singlet oxygen but are unable to fully respond to it at the level of gene expression. Knockout or knockdown of the homologous genes in the higher plant model Arabidopsis thaliana results in mutants that are hypersensitive to photooxidative stress, whereas overexpression produces plants with elevated stress tolerance. Together, our data indicate an important and evolutionarily conserved role of the MBS protein in ROS signaling and provide a strategy for engineering stress-tolerant plants.


Figures

Figure 1.
Figure 1.
Screen for ROS Signaling Mutants in C. reinhardtii and Identification of the MBS Gene. (A) Schematic overview of the experimental strategy for isolating regulators of ROS signaling. High-throughput genetic screens with a ROS-inducible reporter gene in C. reinhardtii are combined with reverse genetic analyses in Arabidopsis. An algal strain expressing a 1O2-inducible luciferase reporter gene (PHSP70A-5′HSP70B-GLuc; Shao and Bock, 2008) was subjected to insertional mutagenesis with the hygromycin resistance gene APH7 (Berthold et al., 2002). Screening for mutants defective in 1O2-mediated signaling was performed by treatment of cultures with the photosensitizer MB that generates 1O2 in the light. As the HSP70A promoter also responds to heat stress (HS; heat stress elements indicated as red bars), ROS signaling mutants can be identified as strains displaying luciferase induction upon heat stress, but lacking induction upon exposure to 1O2 stress. Assays performed on mutants and transgenic lines are indicated in the boxes at the bottom of the panel. C.r., C. reinhardtii; A.t., Arabidopsis; Complem., complementation; KO, knockout; KD, knockdown; Overexpr., overexpression. (B) Example of three insertion mutants (P6E11, P18F10, and P45E1) that do not respond to 1O2 stress generated by HL (1000 µE m−2 s−1) in the presence of 1 µM MB (monitored by luciferase bioluminescence). Data are mean values ± sd of three biological replicates. WT, wild type. (C) Heat stress response in the three insertion mutants P6E11, P18F10, and P45E1. Growing algal colonies were shifted from 23 to 40°C for 1 h. While the P45E1 mutant has a normal heat stress response (as evidenced by induction of luciferase luminescence), the P6E11 and P18F10 mutants show an impaired response to heat stress compared with the wild type. (D) Model of the MBS gene and insertion site of the APH7 marker in the mbs mutant of C. reinhardtii. Black boxes represent exons, and gray boxes represent 5′ and 3′ untranslated regions as confirmed by EST sequencing. (E) RT-PCR analysis demonstrating the absence of MBS transcripts in mutant P45E1 (mbs). The 300-bp MBS gene-specific RT-PCR product is obtained with wild-type cDNA as template after 0, 1, and 2 h of HL treatment (1000 µE m−2 s−1) in the presence of 1 µM MB but cannot be amplified from cDNA of the mbs mutant. PCR products amplified from an EST clone (AV621044) and genomic DNA (G) of the wild type are shown as controls (Con.). (F) MB-sensitive phenotype of the mbs mutant (P45E1) compared with the wild type and the complemented PPsaD:MBS/mbs strain. (G) Alignment of the amino acid sequences of the MBS proteins from the alga C. reinhardtii (Cr), the moss P. patens (Pp), and the higher plants Arabidopsis (At) and rice (Os). Putative MBS sequences were retrieved from the full genome sequences and the alignment was produced using BioEdit (http://www.mbio.ncsu.edu/bioedit/bioedit.html). The asterisks indicate the zinc finger motif of the C2H2 type. Amino acids highlighted in black indicate identical residues in all sequences, and residues in gray denote similar amino acids.
Figure 2.
Figure 2.
Characterization of Arabidopsis MBS Genes, Isolation of mbs Mutants, and Generation of RNAi Lines. (A) Schematic structure of the MBS1 and MBS2 genes in Arabidopsis and identification of T-DNA insertion sites (arrowheads) in mbs1 and mbs2 mutant alleles. Dark boxes indicate coding regions, and gray boxes denote the 5′ and 3′ untranslated regions. The dotted lines indicate the gene-specific tags used for the construction of RNAi lines. (B) Expression analysis of MBS1 and MBS2 in T-DNA insertion mutants. RT-PCR analysis demonstrates the absence of MBS1 transcripts from the mbs1-1 T-DNA line (1 and 10 indicate two different homozygous plants isolated), whereas MBS1 transcripts are detectable in the homozygous mbs1-2 line and MBS2 transcripts are detectable in the mbs2-1 plants. Actin2 was used as an internal control. WT, wild type. (C) Sensitivity of mbs1-1 mutant plants to HL stress. Twelve-day-old seedlings grown on synthetic medium were exposed to 900 µE m−2 s−1 for 2 d (top panel), and 4-week-old plants grown in soil were exposed to 1000 µE m−2 s−1 for 3 d and then transferred back to 600 µE m−2 s−1 for 4 d (bottom panel; cf. Supplemental Figure 2 online). The wild type, the mbs1-1 mutant, and the complemented line PMBS1:MBS1-GFP/mbs1-1 were analyzed (for three additional independently generated complemented lines, see Supplemental Figure 2 online). Bars = 1 cm. (D) RT-PCR analysis of MBS1 and MBS2 mRNA accumulation in the wild type, RNAi-MBS1 lines, RNAi-MBS2 lines, and RNAi-MBS2 mbs1-1 double mutant lines. The Ubi10 mRNA served as internal control. (E) Increased sensitivity of the RNAi-MBS2 mbs1-1 double mutant to HL stress compared with the mbs1-1 single mutant and the RNAi lines against MBS1 and MBS2. Plants were exposed to 1000 µE m−2 s−1 for 3 d and then transferred back to 600 µE m−2 s−1 for 2 d. Independently generated lines are indicated by white Roman numerals. Bar = 1 cm.
Figure 3.
Figure 3.
Subcellular Localization of MBS1 under Normal Conditions and under 1O2 Stress. (A) Localization of a Cr-MBS-YFP fusion protein in stably transformed C. reinhardtii cells. MBS is localized in the cytosol and the nucleus. YFP fluorescence, chlorophyll fluorescence, and the overlay of YFP fluorescence, chlorophyll fluorescence, and the bright-field image are shown. Bar = 3 µm. (B) Localization of At-MBS1-GFP and At-MBS2-GFP fusion proteins in transiently transformed tobacco protoplasts. Both proteins are localized in the cytoplasm and the nucleus under nonstressed conditions. Images were obtained 48 h after protoplast transformation. Bars = 10 μm. (C) At-MBS1 localizes to cytoplasmic SGs and PBs under 1O2 stress. AtMBS1-GFP was transiently coexpressed in tobacco protoplasts with either the SG marker Rbp47 or the PB marker Dcp1 (Weber et al., 2008). Colocalization in cytoplasmic foci was observed 30 min after induction of 1O2 stress by exposure to HL (500 µE m−2 s−1) in the presence of 1 µM MB. Note that PBs are much smaller than SGs, which is an observation that was consistently made in all protoplasts showing PB staining (cf. Supplemental Figure 3 online). The smaller size of the PBs correlates with lower levels of MBS1-GFP accumulation, possibly due to reduced stability of the protein molecules that are not incorporated into PBs. Bars = 10 μm. (D) MBS1-associated cytoplasmic foci induced in cells of the upper epidermis by HL treatment (1000 µE m−2 s−1) for 3 h after 2 d of preincubation in the dark. The assays were performed with Arabidopsis seedlings that stably express the PMBS1:MBS1-GFP fusion gene in the mbs1-1 mutant background. Bars = 25 μm. (E) Image from a movie of MBS1-associated cytoplasmic foci trafficking under 1O2 stress in PMBS1:MBS1-GFP/mbs1-1 seedlings (cf. Supplemental Movie 1 online). Bar = 25 μm.
Figure 4.
Figure 4.
1O2 Accumulation in the Arabidopsis mbs1-1 Mutant under Light Stress. (A) 1O2 imaging of light-stressed Arabidopsis seedlings by staining of leaves with SOSG. Leaves of the wild type (WT), the mbs1-1 mutant, and the 35S:MBS1/mbs1-1 transgenic line were analyzed. For quantitation of SOSG fluorescence, see Supplemental Figure 9 online. Bar = 1 mm. (B) Accumulation of 1O2 in chloroplasts of mesophyll cells in the wild type, the mbs1-1 mutant, and the flu mutant of Arabidopsis in response to light stress. Cells were stained with SOSG, and fluorescence was detected by confocal laser scanning microscopy. As a control, the flu mutant, which generates 1O2 upon transition from dark to light (op den Camp et al., 2003), was exposed to low light (LL). Bars = 50 μm. (C) Light induction of the cell death response in seedlings of the mbs1-1 mutant and the flu mutant. Seedlings were either grown in continuous light (top left panel) or kept in the dark for 5 d followed by transfer to the light (8-h-dark/16-h-light diurnal cycle; top right panel) to trigger 1O2 production. The graph (bottom panel) shows the death rates of seedlings as scored in three independent dark-to-light shift experiments. Values represent means ± sd.
Figure 5.
Figure 5.
Deregulation of 1O2-Inducible Genes in the mbs1-1 Mutant under Light Stress. Expression of marker genes of oxidative stress responses in mbs1-1 is compared with the wild type (WT) and the flu mutant. The expression levels of ROS-responsive genes were measured over four time points by qRT-PCR using specific primers for the 1O2 marker genes AAA (At3g28580), BAP1 (At3g61190), and Toll-IR (At3g50970), the H2O2 marker genes APX1 (At1g07890) and CAT2 (At4g35090), and the two ROS-responsive transcription factors ZAT12 (At5g59820) and WRKY40 (At1g80840). mRNA levels were determined by the 2−ΔΔCT method relative to the wild-type sample at time point 0 h, which was assigned a value of 1. Data are mean values ± sd of three biological replicates. Statistical analysis of the data was performed by two-way analysis of variance. Differences between expression patterns in the mutants and the wild type that are significant at the level of **P ≤ 0.001 or *P ≤ 0.01.
Figure 6.
Figure 6.
MBS1 Expression Levels Determine the HL Tolerance of Plants. (A) MBS transcript levels in the wild type (WT), the mbs1-1 mutant, and two MBS1 overexpression lines (8 and 28). RT-PCR analysis demonstrates overexpression of MBS1 in the 35S:MBS1 transgenic lines. MBS2 and Ubi10 served as internal controls. (B) MBS1 protein levels in the wild type, the mbs1-1 mutant, and the MBS1-overexpressing lines. While in the wild type, the 11.3-kD MBS1 protein is not expressed to levels detectable with the sensitivity of our anti-MBS1 antibody, the protein is readily detected in the 35S:MBS1 overexpression lines (top panel). The protein is also detectable in one of the complemented lines expressing MBS1-GFP from the endogenous MBS1 promoter (bottom panel). To measure expression in response to HL stress, 4-week-old PMBS1:MBS1-GFP plants grown in soil were treated with HL (1000 μE m−2 s−1) for 3 h and then transferred to normal light (NL; 120 μE m−2 s−1) for 45 min. Untreated plants were maintained in normal light (120 μE m−2 s−1). Fifteen micrograms of total protein per sample was loaded. The PSII protein PsbO was used as loading control. (C) Comparison of the phenotypes of wild-type plants, the mbs1-1 mutant, and two 35S:MBS1 overexpression lines under normal light conditions (µE m−2 s−1; 5-week-old plants; top panel), under HL stress (4-week-old plants exposed to light stress at 1000 µE m−2 s−1 for 5 d in a 16-h-HL/8-h-dark cycle; middle panel), and after recovery from HL and continued growth for 21 d under normal light (HL → NL; bottom panel). Bars = 6 cm. (D) Light stress acclimation in Arabidopsis MBS mutants and overexpression plants. Anthocyanin contents, chlorophyll contents, and PSII activities were compared under light stress conditions (HL → mHL; 1000 µE m−2 s−1 for 3 d and then transfer to 600 µE m−2 s−1 for 3 d; 16-h-light/8-h-dark regime) and normal light (120 µE m−2 s−1). The wild type, the mbs1-1 and RNAi-MBS2 mbs1-1 mutants, and a transgenic 35S:MBS1 overexpression line were analyzed. Anthocyanin contents are displayed as relative values to the wild type after the stress treatment, which was assigned a value of 1. Data represent mean values ± sd of three biological replicates.
Figure 7.
Figure 7.
Light Stress–Responsive Gene Expression in the Wild Type, the mbs1-1 Mutant, the RNAi-MBS2 mbs1-1 Double Mutant, the 35S:MBS1 Overexpression Line and the flu Mutant. The genome-wide response of the transcriptome to a sudden shift from low-light to HL conditions was determined by microarray analysis. (A) Light stress response of all genes represented on the ATH1 arrays. Total numbers of genes in the five plant lines that displayed a significant and greater than fourfold change 3 h after the onset of light stress. WT, wild type. (B) Light stress response of the subset of genes previously reported as responsive to 1O2 (op den Camp et al., 2003; Gadjev et al., 2006). Panel shows number of genes in the subset showing significant and greater than fourfold response in the microarray analysis (see Supplemental Data Set 2 online). (C) Light stress response of the subset of genes previously reported as responsive to H2O2/O2 (Gadjev et al., 2006). Panel shows number of genes in the subset showing significant and greater than fourfold response in the microarray analysis (see Supplemental Data Set 2 online).
Figure 8.
Figure 8.
MBS1 Inactivation Affects the Light Stress Response of the Chloroplast-Localized SIB1. Expression of SIB1 (At3g56710) was measured by qRT-PCR analysis in Arabidopsis wild-type plants (WT), the mbs1-1 mutant, the RNAi-MBS2 mbs1-1 mutant, and the 35S:MBS1 overexpression line. Twelve-day-old seedlings incubated under continuous light of 10 µE m−2 s−1 for 7 d on agar plates were exposed to HL stress (1000 µE m−2 s−1). Samples were collected prior to the onset of light stress (HL 0 h) and 3 h after transfer to HL (HL 3 h). The relative mRNA levels of SIB1 were quantified relative to the expression level in the wild type at 0 h, to which a value of 1 was assigned. Data are mean values ± sd of three biological replicates.

Similar articles

Cited by

References

    1. Adhikari N.D., Froehlich J.E., Strand D.D., Buck S.M., Kramer D.M., Larkin R.M. (2011). GUN4-porphyrin complexes bind the ChlH/GUN5 subunit of Mg-Chelatase and promote chlorophyll biosynthesis in Arabidopsis. Plant Cell 23: 1449–1467 - PMC - PubMed
    1. Antoni R., Rodriguez L., Gonzalez-Guzman M., Pizzio G.A., Rodriguez P.L. (2011). News on ABA transport, protein degradation, and ABFs/WRKYs in ABA signaling. Curr. Opin. Plant Biol. 14: 547–553 - PubMed
    1. Apel K., Hirt H. (2004). Reactive oxygen species: Metabolism, oxidative stress, and signal transduction. Annu. Rev. Plant Biol. 55: 373–399 - PubMed
    1. Baruah A., Simková K., Apel K., Laloi C. (2009). Arabidopsis mutants reveal multiple singlet oxygen signaling pathways involved in stress response and development. Plant Mol. Biol. 70: 547–563 - PubMed
    1. Benjamini Y., Hochberg Y. (1995). Controlling the false discovery rate: A practical and powerful approach to multiple testing. J. R. Stat. Soc. B 57: 289–300

Publication types

MeSH terms

Associated data