. 2013 Dec;64(18):5721-35.
doi: 10.1093/jxb/ert347. Epub 2013 Oct 22.

In vitro binding of Sorghum bicolor transcription factors ABI4 and ABI5 to a conserved region of a GA 2-OXIDASE promoter: possible role of this interaction in the expression of seed dormancy

Affiliations

In vitro binding of Sorghum bicolor transcription factors ABI4 and ABI5 to a conserved region of a GA 2-OXIDASE promoter: possible role of this interaction in the expression of seed dormancy

Renata Cantoro et al. J Exp Bot. 2013 Dec.

Abstract

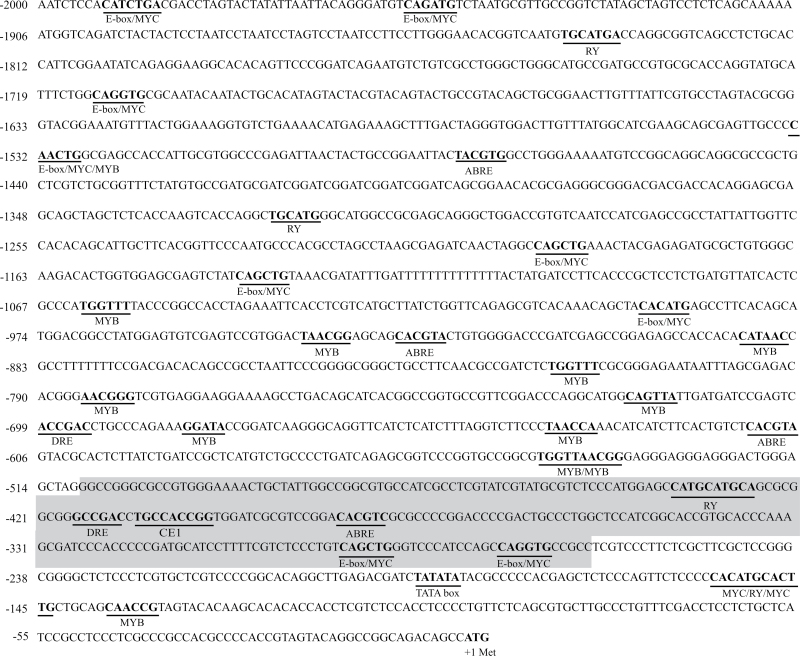
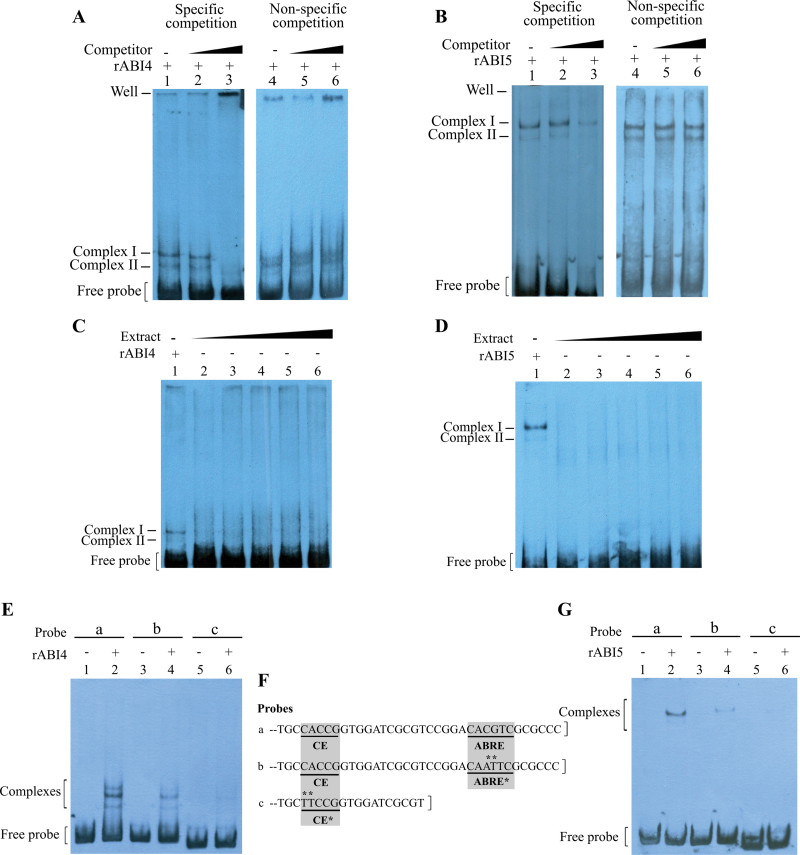
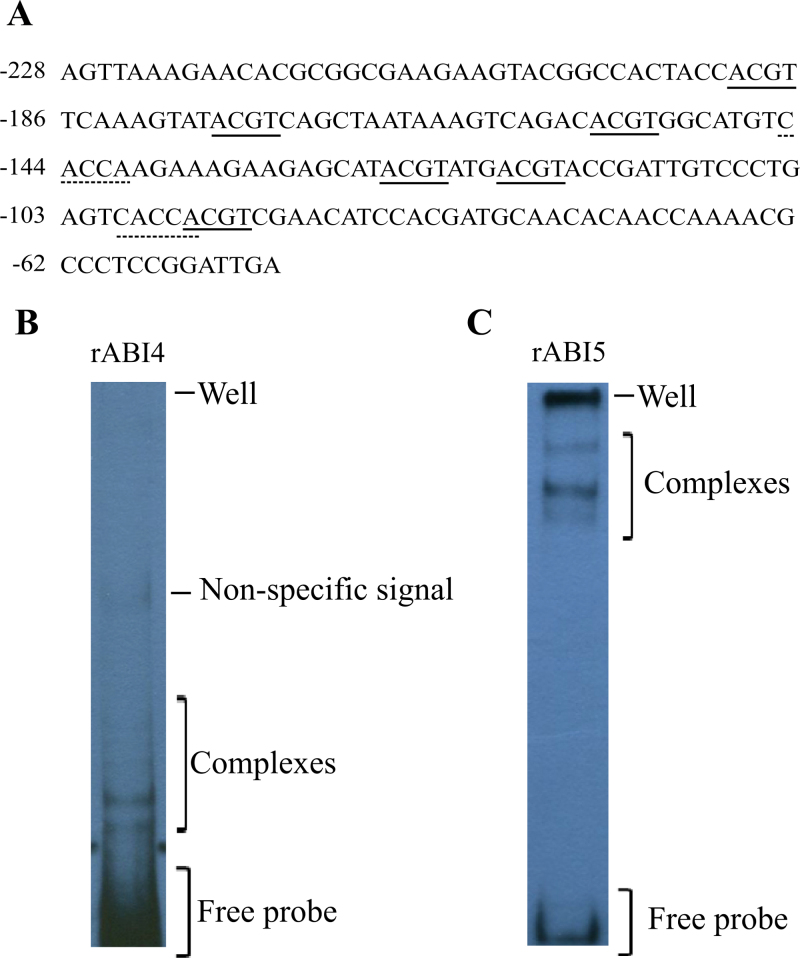
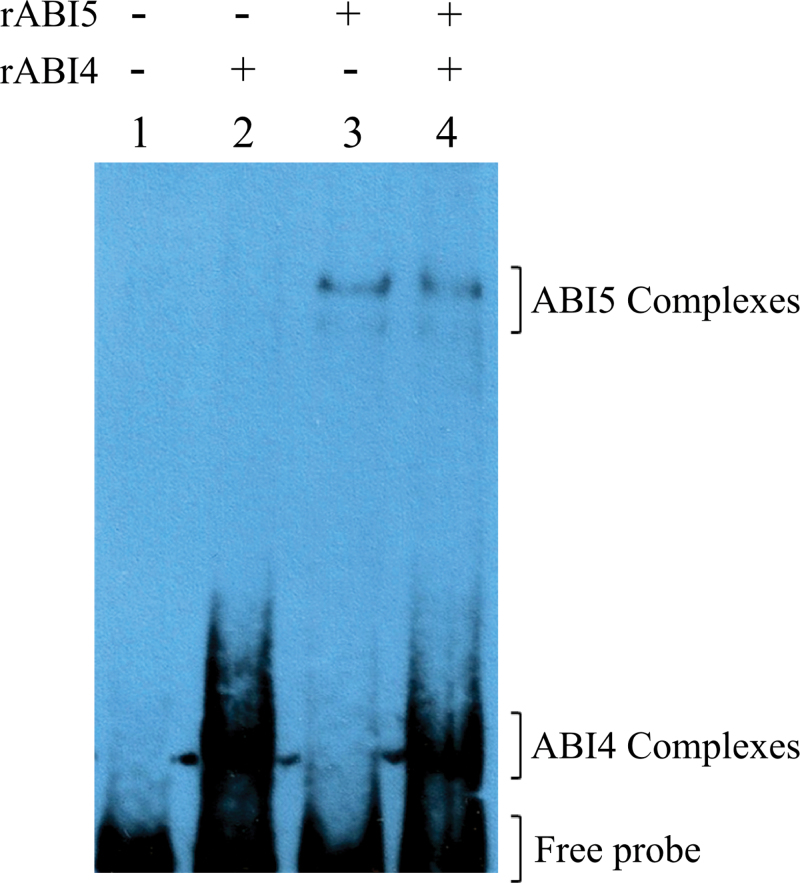
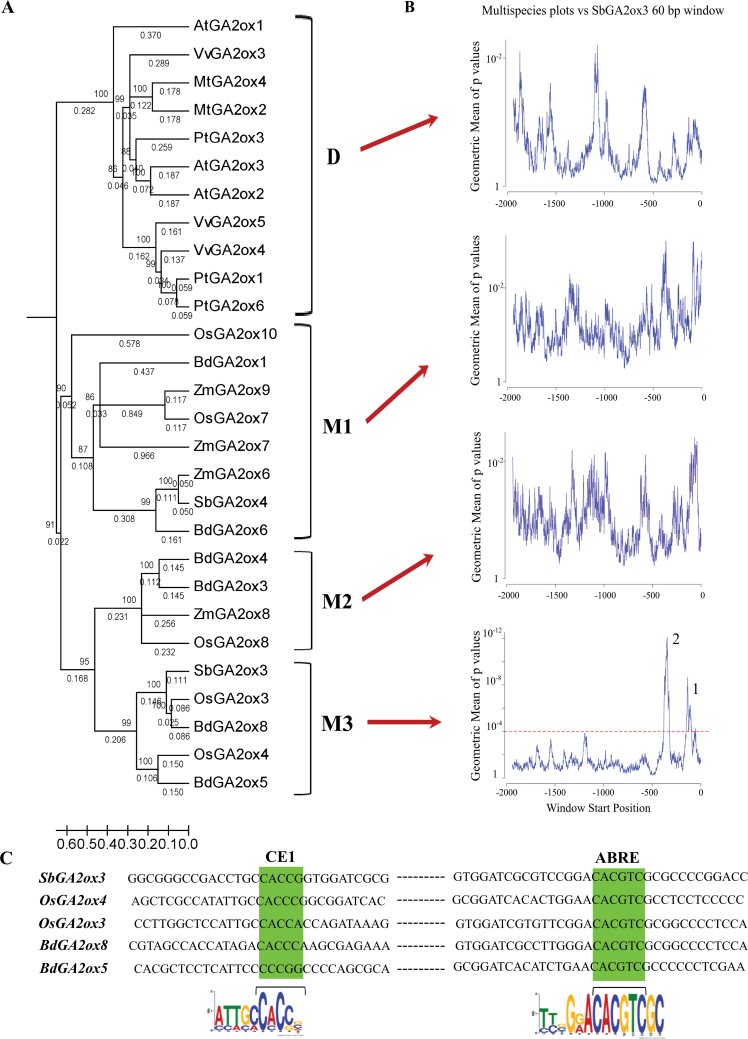
The precise adjustment of the timing of dormancy release according to final grain usage is still a challenge for many cereal crops. Grain sorghum [Sorghum bicolor (L.) Moench] shows wide intraspecific variability in dormancy level and susceptibility to pre-harvest sprouting (PHS). Both embryo sensitivity to abscisic acid (ABA) and gibberellin (GA) metabolism play an important role in the expression of dormancy of the developing sorghum grain. In previous works, it was shown that, simultaneously with a greater embryo sensitivity to ABA and higher expression of SbABA-INSENSITIVE 4 (SbABI4) and SbABA-INSENSITIVE 5 (SbABI5), dormant grains accumulate less active GA4 due to a more active GA catabolism. In this work, it is demonstrated that the ABA signalling components SbABI4 and SbABI5 interact in vitro with a fragment of the SbGA 2-OXIDASE 3 (SbGA2ox3) promoter containing an ABA-responsive complex (ABRC). Both transcription factors were able to bind the promoter, although not simultaneously, suggesting that they might compete for the same cis-acting regulatory sequences. A biological role for these interactions in the expression of dormancy of sorghum grains is proposed: either SbABI4 and/or SbABI5 activate transcription of the SbGA2ox3 gene in vivo and promote SbGA2ox3 protein accumulation; this would result in active degradation of GA4, thus preventing germination of dormant grains. A comparative analysis of the 5'-regulatory region of GA2oxs from both monocots and dicots is also presented; conservation of the ABRC in closely related GA2oxs from Brachypodium distachyon and rice suggest that these species might share the same regulatory mechanism as proposed for grain sorghum.

Keywords: ABI4; ABI5; GA 2-oxidase; Sorghum bicolor.; abscisic acid; germination; gibberellins; seed dormancy.


Figures

Fig. 1.
Fig. 1.
SbGA2ox3 putative 5′-regulatory region sequence, comprising 2000bp upstream from the ATG (in bold). Positions are given relative to the first base of the initiating methionine. Potential transcription binding motifs ABRE, CE, DRE, RY, MYB, and E-box/MYC are underlined and named below. The 242bp biotinylated fragment used as probe in electrophoretic mobility shift assay (EMSA) experiments is highlighted in grey. (This figure is available in colour at JXB online.)
Fig. 2.
Fig. 2.
DNA binding activity of recombinant S. bicolor ABI4 and ABI5 (rABI4 and rABI5). EMSA experiments were performed with 40ng of a 242bp (–505bp to –263bp) SbGA2ox3 promoter biotinylated probe and increasing amounts of recombinant proteins rABI4 and rABI5. Complexes detected, well position, and free probe are indicated. (A) Band shift pattern for rABI4. The protein amount in each reaction was as follows: lane 1, no protein; lane 2, 0.045 μg; lane 3, 0.075 μg; lane 4, 0.15 μg; lane 5, 0.225 μg; lane 6, 0.3 μg. (B) Band shift pattern for rABI5. The protein amount in each reaction was as follows: lane 1, no protein; lane 2, 0.03 μg; lane 3, 0.06 μg; lane 4, 0.15 μg; lane 5, 0.3 μg; lane 6, 0.375 μg; lane 7, 0.47 μg; lane 8, 0.6 μg. (This figure is available in colour at JXB online.)
Fig. 3.
Fig. 3.
(A and B) Competition EMSAs for rABI4 and rABI5 performed with a 242bp SbGA2ox3 fragment (–505bp to –263bp) as biotinylated probe. For all lanes, 40ng of biotinylated probe and 0.225 μg of rABI4 (A) or 0.375 μg of rABI5 (B) were used. For specific competitions, the mass of unlabelled competitor DNA (SbGA2ox3 unlabelled fragment) in each reaction was as follows: lane 1, no competitor; lane 2, 200ng; lane 3, 600ng. For non-specific competitions, the mass of unlabelled competitor (SbGAMyb 183bp fragment) was as follows: lane 4, no competitor; lane 5, 200ng; lane 6, 600ng. (C and D) Control EMSAs for rABI4 (C) and rABI5 (D) performed with increasing concentrations of protein extract from E. coli cultures (transformed with empty pET24a) and 40ng of SbGA2ox3 biotinylated probe. For both C and D, the protein extract amount in each lane was as follows: lane 2, 10.74 μg; lane 3, 14.32 μg; lane 4, 17.9 μg; lane 5, 21.48 μg; lane 6, 25.06 μg. Lane 1 shows the positive control incubation reaction with 40ng of SbGA2ox3 biotinylated probe and 0.225 μg of rABI4 (C) and 0.375 μg of rABI5 (D). (E and G) EMSAs carried out with rABI4 (E) or rABI5 (G) and shorter SbGA2ox3 probes a, b, and c. For all lanes, 40ng of biotinylated probe was used. The protein amount was as follows: lanes 1, 3, and 5, no protein; lanes 2, 4, and 6, 0.225 μg of rABI4 (E) and 0.375 μg of rABI5 (G). (F) Sequences of probes a, b, and c with highlighted CEs and ABREs. Probe a, wild-type probe (intact ABRE and CE); probe b, mutated ABRE; probe c, mutated CE and no ABRE included. Asterisks in probes b and c indicate mutated bases and elements. Probe size was 131bp for a and b, and 114bp for c. (This figure is available in colour at JXB online.)
Fig. 4.
Fig. 4.
rABI4 and rABI5 binding affinity for an AtEm6 promoter biotinylated probe. (A) AtEm6 biotinylated probe sequence (186bp). Positions are given relative to the first base of the initiating methionine (ATG). ACGT cores for putative ABREs (solid lines) and CE-like (dashed lines) motifs are indicated. (B) Band shift pattern for rABI4. A 40ng aliquot of AtEm6 biotinylated probe was incubated with 0.225 μg of rABI4. (C) Band shift pattern for rABI5. A 40ng aliquot of AtEm6 biotinylated probe was incubated with 0.375 μg of rABI5. In all cases, complexes detected, well position, and free probe are indicated. (This figure is available in colour at JXB online.)
Fig. 5.
Fig. 5.
EMSA performed with rABI4 and rABI5 co-incubations with 40ng of SbGA2ox3 biotinylated probe. Protein amounts in the reactions were as follows: lane 1, no protein; lane 2, 0.225 μg of rABI4; lane 3, 0.375 μg of rABI5; lane 4, 0.225 μg of rABI4 and 0.375 μg of rABI5. Complexes and free probe are indicated. (This figure is available in colour at JXB online.)
Fig. 6.
Fig. 6.
Comparative analysis of regulatory regions of GA2ox promoters. (A) Phylogenetic relationships for group I GA2oxs. The 28 GA2ox proteins were grouped into four subgroups: D, dicots; M1, monocots 1; M2, monocots 2; and M3, monocots 3. At, Arabidopsis thaliana; Bd, Brachypodium distachyon; Mt, Medicago truncatula; Os, Oryza sativa; Pt, Populus trichocarpa; Sb, Sorghum bicolor; Vv, Vitis vinifera; Zm, Zea mays. Bootstrap support values are indicated and scale bars specify the number of changes per position for a unit branch length. Identification codes for sequences are listed in Supplementary Table S1 at JXB online. (B) Multispecies plots showing comparative analysis of the SbGA2ox3 promoter versus promoters of each subgroup (D, M1, M2, and M3), performed with the EARS tool. The red dashed line indicates the selected cut-off P-value (0.0001), suggesting that only in the case of M3 were two significant peaks detected. (C) Sequence alignments of significant peak sequences of M3 members (SbGA2ox3, OsGA2ox3, OsGA2ox4, BdGA2ox5, and BdGA2ox8). Conserved regions are highlighted in green: ABRE (CACGTC) and CE (CACCG). The MEME software (Bailey and Elkan, 1994) was used to find common motif logos in the promoters of subgroup M3 members. CE and ABRE motif logos are shown below each conserved sequence.

References

    1. Bailey T, Bodén M, Buske FA, Frith M, Grant CE, Clementi L, Ren J, Li WW, Noble WS. 2009. MEME SUITE: tools for motif discovery and searching. Nucleic Acids Research 37, W202–W208 - PMC - PubMed
    1. Bailey TL, Elkan C. 1994. Fitting a mixture model by expectation maximization to discover motifs in biopolymers. Proceedings of the Second International Conference on Intelligent Systems for Molecular Biology. AAAI Press, 28–36 - PubMed
    1. Barrero JM, Jacobsen JV, Talbot MJ, White RG, Swain SM, Garvin DF, Gubler F. 2012. Grain dormancy and light quality effects on germination in the model grass Brachypodium distachyon. New Phytologist 193, 376–386 - PubMed
    1. Baumlein H, Nagyt I, Villarroel R, Inzé D, Wobus U. 1992. Cis-analysis of a seed protein gene promoter: the conservative RY repeat CATGCATG within the legumin box is essential for tissue-specific expression of a legumin gene. The Plant Journal 2, 233–239 - PubMed
    1. Benech-Arnold RL, Enciso S, Sánchez RA, Carrari F, Perez-Flores L, Iusem N, Steinbach HS, Lijavetzky D, Bottini R. 2000. Involvement of ABA and GAs in the regulation of dormancy in developing sorghum seeds. In: Black M, Bradford KJ, Vázquez Ramos J, eds. Seed biology: advances and applications. Wallingford, UK, CAB International, 101–111

Publication types