. 2013 Nov 12;110(46):E4316-24.
doi: 10.1073/pnas.1308811110. Epub 2013 Oct 22.

Transcript processing and export kinetics are rate-limiting steps in expressing vertebrate segmentation clock genes

Affiliations

Transcript processing and export kinetics are rate-limiting steps in expressing vertebrate segmentation clock genes

Nathaniel P Hoyle et al. Proc Natl Acad Sci U S A. .

Abstract

Sequential production of body segments in vertebrate embryos is regulated by a molecular oscillator (the segmentation clock) that drives cyclic transcription of genes involved in positioning intersegmental boundaries. Mathematical modeling indicates that the period of the clock depends on the total delay kinetics of a negative feedback circuit, including those associated with the synthesis of transcripts encoding clock components [Lewis J (2003) Curr Biol 13(16):1398-1408]. Here, we measure expression delays for three transcripts [Lunatic fringe, Hes7/her1, and Notch-regulated-ankyrin-repeat-protein (Nrarp)], that cycle during segmentation in the zebrafish, chick, and mouse, and provide in vivo measurements of endogenous splicing and export kinetics. We show that mRNA splicing and export are much slower than transcript elongation, with the longest delay (about 16 min in the mouse) being due to mRNA export. We conclude that the kinetics of mRNA and protein production and destruction can account for much of the clock period, and provide strong support for delayed autorepression as the underlying mechanism of the segmentation clock.

Keywords: RNA export; RNA splicing; mRNA processing; somites; transcriptional delays.


Conflict of interest statement

The authors declare no conflict of interest.

Figures
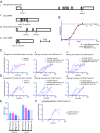
Fig. 1.
Fig. 1.
Ex vivo measurement of transcript elongation, splicing, and export delays of mouse Lfng and Hes7. (A) Schematic indicates the position of qRT-PCR target amplicons on Lfng pre-mRNA (i), Lfng mRNA (ii), Hes7 pre-mRNA (iii), and Hes7 mRNA (iv). (B) Graph illustrates RNA accumulation kinetics fitted to a sigmoidal curve (Materials and Methods). The red dashed line indicates how regression from the inflection point to the baseline expression level gives a proxy measure for expression onset (T0). Timings generated by this method are relatively insensitive to differences in expression levels and amplification efficiencies (with the latter being exemplified by Lfng introns 1 and 7). Graphs illustrate accumulation of the indicated species of mouse Lfng (C) or Hes7 (D) transcript measured by qRT-PCR after induction of expression. Representative examples from three biological replicates are shown. Error bars indicate SD from three technical replicates (also in E and F). (E) Chart shows delay between the onset of accumulation of pre-mRNA and spliced mRNA (splicing offset) and nuclear mRNA and cytoplasmic mRNA (export offset). (F) Accumulation of polyadenylated Hes7 exon 1,2 vs. total Hes7 exon 1,2.
Fig. 2.
Fig. 2.
In vivo Lfng transcript delays measured by multilabeled FISH. (A) FISH detection of unspliced Lfng (i) and spliced Lfng (ii) in E10.5 mouse PSM, with merge (iii). Nuclei are stained using SYTO13. In this and subsequent figures, anterior is upward. (Scale bar, 500 μm.) (iv) Due to slowing of the clock as cells mature, anterior cells are in an earlier phase (as shown by arrow direction in v) of the gene expression cycle than posterior cells. (v) Local synchrony leads to kinematic anterior progression of the expression domain. Red and yellow nuclear dots show sites of nascent unspliced and spliced nuclear transcripts, and shades of green represent levels of spliced transcript. (B) Segmentation of multicolor FISH images. The nuclear channel (i) was manually thresholded to a binary image (red and blue) (ii), and used with stacked images of unspliced (iii) and spliced (iv) RNA to generate images of the unspliced cytoplasmic (v), unspliced nuclear (vi), spliced cytoplasmic (vii), and spliced nuclear (viii) signals. Scale bar: 10 mm. (C) Z-average projections of multicolor Lfng FISH z-stacks generated after segmentation. (Scale bar: 100 μm unless otherwise defined.) (D) Lfng signal intensity plots of images in C measured from the posterior to anterior of the expression domain and averaged across the width of the PSM. The anterior inflection points of the various expression domains used to measure the mean splicing and export offset times are marked with vertical dashed lines show (also in subsequent graphs).
Fig. 3.
Fig. 3.
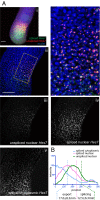
Estimation of transcript export and splicing delays of Hes7 in the mouse PSM. (A, i) Maximum z-projection of FISH against Mouse Hes7. Segmentation of higher magnification FISH images was conducted as in Fig. 2B. An example source image (ii) and detailed view of the source image indicated by the hatched area (ii′) are shown, along with the segmented images representing unspliced nuclear pre-mRNA (iii), spliced nuclear mRNA (iv), and spliced cytoplasmic mRNA (v). Average z-projections are shown. (Scale bar: 100 μm.) (B) Intensity plots of images in A, iiiv measured from the posterior to anterior of the expression domain, averaged across the width of the PSM.
Fig. 4.
Fig. 4.
Estimation of transcript export delays of Nrarp in the mouse PSM. (A, i) Maximum z-projection of FISH against Mouse Nrarp. Segmentation of higher magnification FISH images was conducted as in Fig. 2B. An example source image (ii) and detailed view of the source image indicated by the hatched area (ii′) are shown, along with the segmented images representing unspliced nuclear pre-mRNA (iii), spliced nuclear mRNA (iv), and spliced cytoplasmic mRNA (v). Average z-projections are shown. (B) Intensity plots of images in A, iiiv measured from the posterior to anterior of the expression domain, averaged across the width of the PSM.
Fig. 5.
Fig. 5.
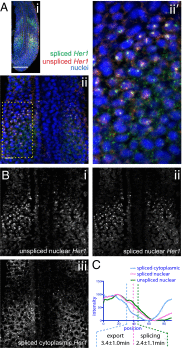
mRNA export and splicing delays measured in the chick PSM. Maximum z-projection of FISH for chick Lfng (A), Hairy1/Her1 (B), and Nrarp (C) shows (i) embryo posteriors. Higher magnification images (ii) were segmented as in Fig. 2B to generate images of unspliced nuclear RNA (iii), spliced nuclear RNA (iv), and spliced cytoplasmic RNA (v). Anteroposterior intensity profile graphs of one PSM are shown for each RNA species. Anterior inflection points are shown, along with average export and splicing offsets from Table 1. Maximum z-projection of FISH against chick Lfng (A), Hairy1/Her1 (B), and Nrarp (C) shows representative embryos at low (i) and higher (ii and ii′) magnification. Sets iiiv are as labeled, except that A, vi; B, vi; and C, v show the intensity graphs from which measurements were drawn.
Fig. 6.
Fig. 6.
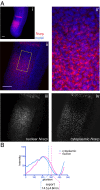
Estimation of mRNA export and splicing delays in the zebrafish PSM. (A) Maximum z-projection of FISH against zebrafish Her1. (B) Segmentation of higher magnification FISH against Her1 shows the source image (i), unspliced nuclear pre-mRNA (ii), spliced nuclear mRNA (iii), and spliced cytoplasmic mRNA (iv). (C) Intensity plots of images in B measured from the posterior to anterior of the expression domain, averaged across the width of the PSM, and corrected for skew (Materials and Methods). Anterior inflection points of the posterior expression domain are indicated with dashed lines for each RNA species.

References

    1. Cooke J, Zeeman EC. A clock and wavefront model for control of the number of repeated structures during animal morphogenesis. J Theor Biol. 1976;58(2):455–476. - PubMed
    1. Oates AC, Morelli LG, Ares S. Patterning embryos with oscillations: Structure, function and dynamics of the vertebrate segmentation clock. Development. 2012;139(4):625–639. - PubMed
    1. Palmeirim I, Henrique D, Ish-Horowicz D, Pourquié O. Avian hairy gene expression identifies a molecular clock linked to vertebrate segmentation and somitogenesis. Cell. 1997;91(5):639–648. - PubMed
    1. Pourquié O. Vertebrate segmentation: From cyclic gene networks to scoliosis. Cell. 2011;145(5):650–663. - PMC - PubMed
    1. Jiang YJ, et al. Notch signalling and the synchronization of the somite segmentation clock. Nature. 2000;408(6811):475–479. - PubMed

Publication types

Substances

LinkOut - more resources