. 2013:2013:354582.
doi: 10.1155/2013/354582. Epub 2013 Sep 12.

Comparative gene expression profiling in human cumulus cells according to ovarian gonadotropin treatments

Affiliations

Comparative gene expression profiling in human cumulus cells according to ovarian gonadotropin treatments

Said Assou et al. Biomed Res Int. 2013.

Abstract

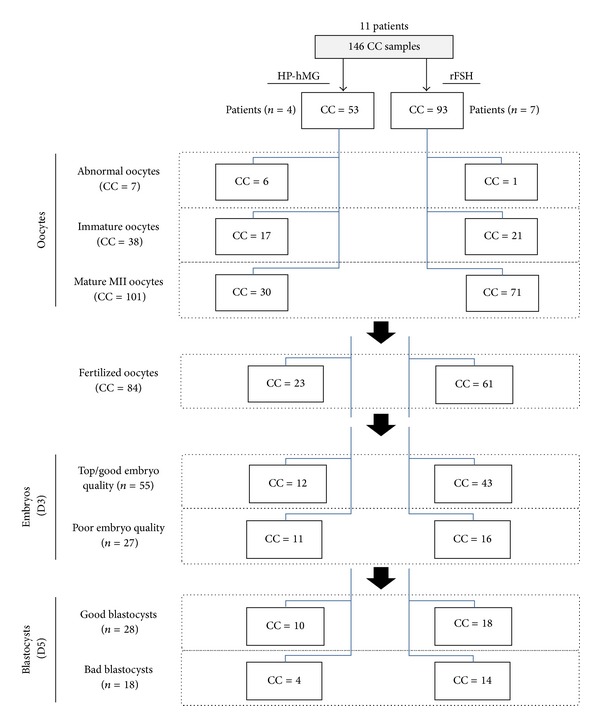
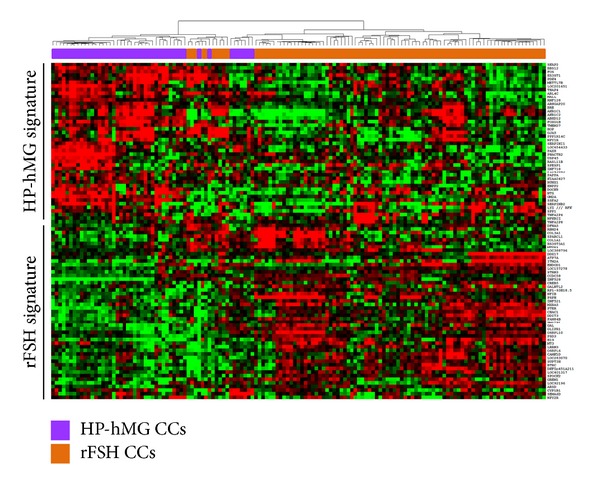
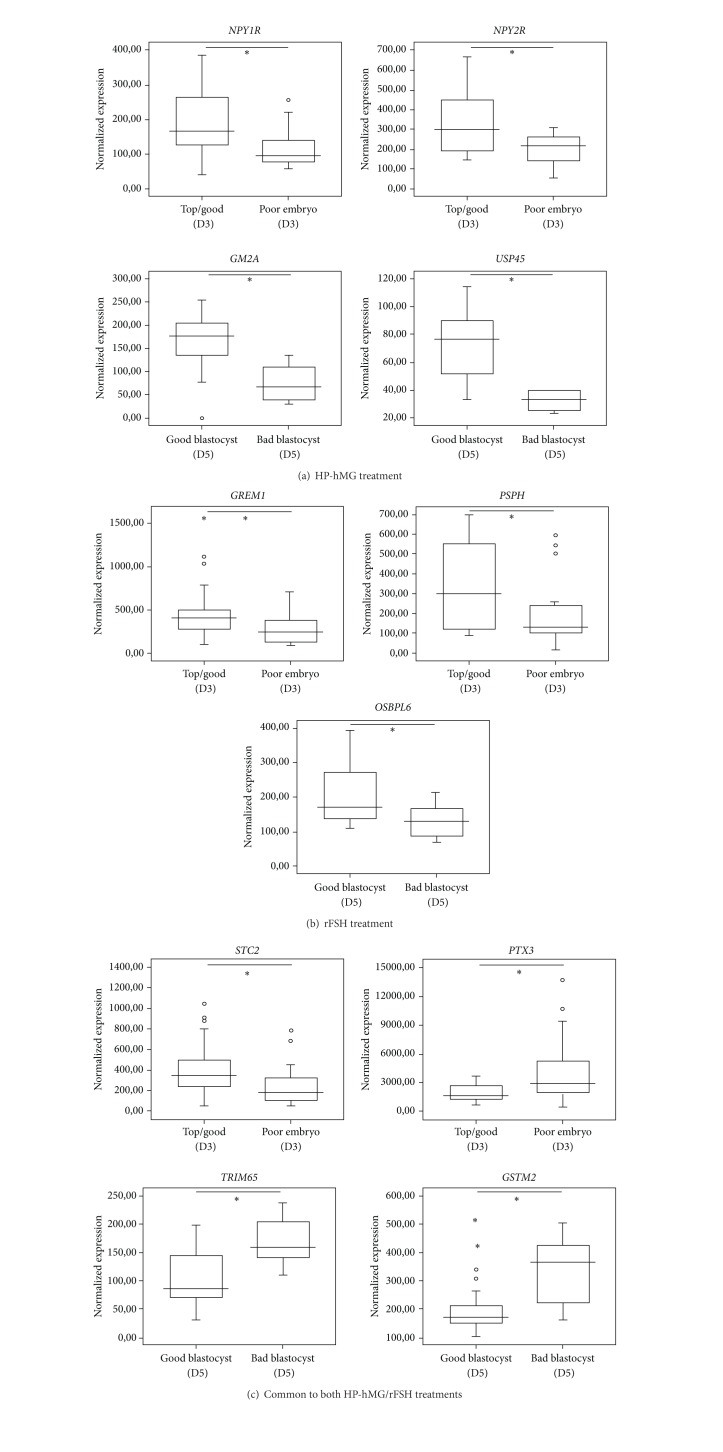
In in vitro fertilization cycles, both HP-hMG and rFSH gonadotropin treatments are widely used to control human follicle development. The objectives of this study are (i) to characterize and compare gene expression profiles in cumulus cells (CCs) of periovulatory follicles obtained from patients stimulated with HP-hMG or rFSH in a GnRH antagonist cycle and (ii) to examine their relationship with in vitro embryo development, using Human Genome U133 Plus 2.0 microarrays. Genes that were upregulated in HP-hMG-treated CCs are involved in lipid metabolism (GM2A) and cell-to-cell interactions (GJA5). Conversely, genes upregulated in rFSH-treated CCs are implicated in cell assembly and organization (COL1A1 and COL3A1). Interestingly, some genes specific to each gonadotropin treatment (NPY1R and GM2A for HP-hMG; GREM1 and OSBPL6 for rFSH) were associated with day 3 embryo quality and blastocyst grade at day 5, while others (STC2 and PTX3) were related to in vitro embryo quality in both gonadotropin treatments. These genes may prove valuable as biomarkers of in vitro embryo quality.


Figures

Figure 1
Figure 1
Distribution tree of cumulus cell (CC) samples and embryo outcome relative to the used COS protocol.
Figure 2
Figure 2
Gene expression patterns of the HP-hMG and rFSH CC samples. Supervised hierarchical clustering of CC samples based on the 94 genes that are differentially expressed between the two treatment groups (HP-hMG and rFSH). We can see a distinct signature in each CCs category. The color intensity indicates the level of gene expression (red for upregulated genes and green for downregulated genes).
Figure 3
Figure 3
Gonadotropin gene expression associated with in vitro embryo development. (a) and (b) Box-and-whisker plots comparing the expression level of gonadotropin-specific gene in CCs from oocytes that developed into top/good quality embryos (n = 43 in the rFSH and n = 12 in the HP-hMG group) or poor quality embryos (n = 16 in the rFSH and n = 11 in the HP-hMG group) and into good blastocysts (n = 18 in the rFSH and n = 10 in the HP-hMG group) or bad blastocysts (n = 14 in the rFSH and n = 4 in the HP-hMG group). (c) Box-and-whisker plots comparing the expression level of gonadotropin common genes in CCs from oocytes that developed into top/good quality embryos (n = 55 CCs) or poor quality embryos (n = 27 CCs) and into good blastocysts (n = 28 CCs) or bad blastocysts (n = 18 CCs). The signal intensity for each gene is shown on the y-axis as arbitrary units determined by the Affymetrix GCOS software. *A significant difference with FDR ≤0.05.
Figure 4
Figure 4
Relationship between amount of amplified CCs mRNA and blastocyst quality. Three groups of blastocysts (good, intermediary, or bad quality) were obtained from top and good 8-cell embryos at day 3. The Kruskal-Wallis test was used to indicate that at least one of the groups is different from the others (P = 0.011, Kruskal-Wallis test), and the Wilcoxon test was used to establish whether group AA-AB is significantly different from group BB and/or group CC. *A significant difference in the concentration of amplified CC mRNA between two groups of blastocysts. CC samples (n = 17) were from oocytes that developed in top and good 8-cell embryos at day 3. AA-AB: good blastocyst grades (n = 7); BB: intermediary blastocyst grades (n = 6); CC and others: bad blastocyst grades (n = 4). Bars represent the mean ± SEM.

References

    1. Trew GH, Brown AP, Gillard S, et al. In vitro fertilisation with recombinant follicle stimulating hormone requires less IU usage compared with highly purified human menopausal gonadotrophin: results from a European retrospective observational chart review. Reproductive Biology and Endocrinology. 2010;8, article 137 - PMC - PubMed
    1. van Wely M, Kwan I, Burt AL, et al. Recombinant versus urinary gonadotrophin for ovarian stimulation in assisted reproductive technology cycles. A cochrane review. Human Reproduction Update. 2012;18(2):p. 111. - PubMed
    1. van Wely M, Kwan I, Burt AL, et al. Recombinant versus urinary gonadotrophin for ovarian stimulation in assisted reproductive technology cycles. Cochrane Database of Systematic Reviews. 2011;(2)CD005354 - PMC - PubMed
    1. Hutt KJ, Albertini DF. An oocentric view of folliculogenesis and embryogenesis. Reproductive BioMedicine Online. 2007;14(6):758–764. - PubMed
    1. Albertini DF, Combelles CMH, Benecchi E, Carabatsos MJ. Cellular basis for paracrine regulation of ovarian follicle development. Reproduction. 2001;121(5):647–653. - PubMed

Publication types

MeSH terms