

Inhibition of hepatitis C virus by the cyanobacterial protein Microcystis viridis lectin: mechanistic differences between the high-mannose specific lectins MVL, CV-N, and GNA
- PMID: 24152340
- PMCID: PMC3907190
- DOI: 10.1021/mp400399b
Inhibition of hepatitis C virus by the cyanobacterial protein Microcystis viridis lectin: mechanistic differences between the high-mannose specific lectins MVL, CV-N, and GNA
Abstract
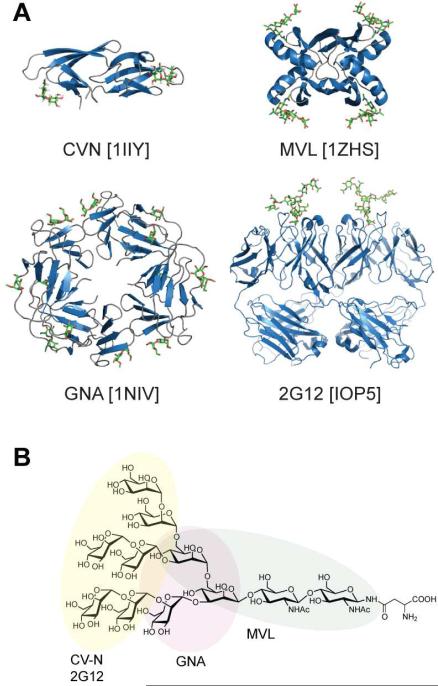
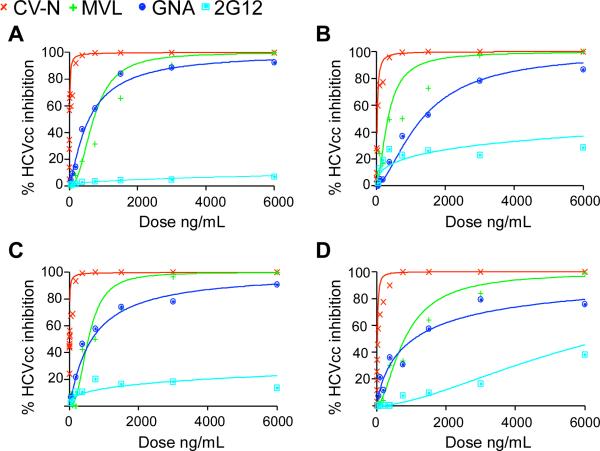
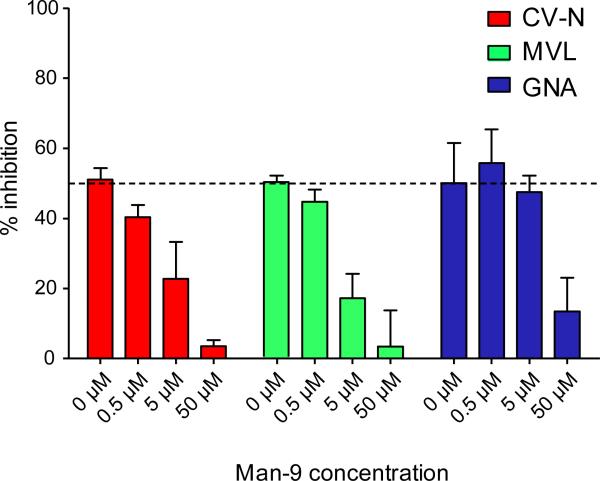
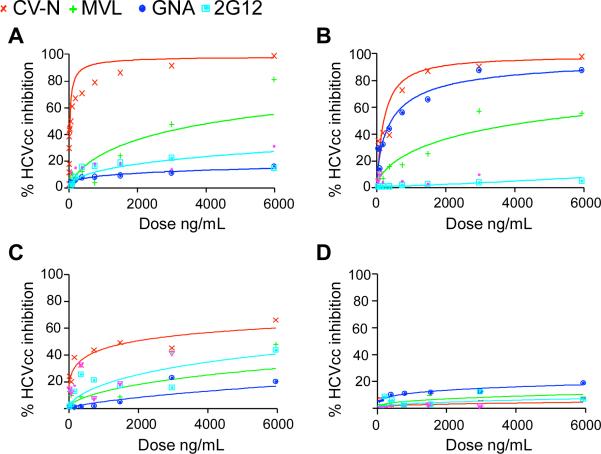
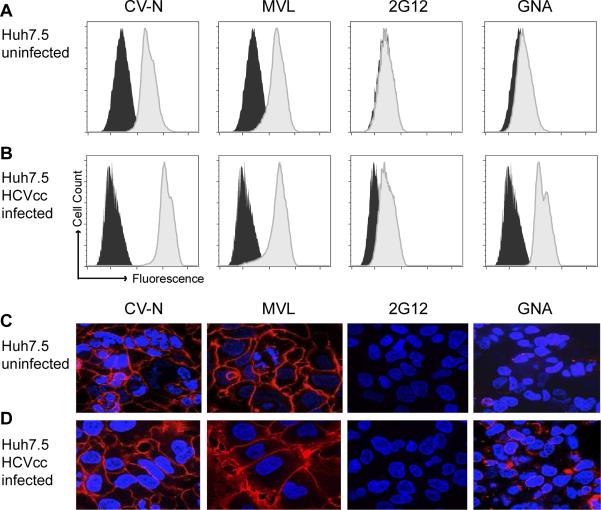
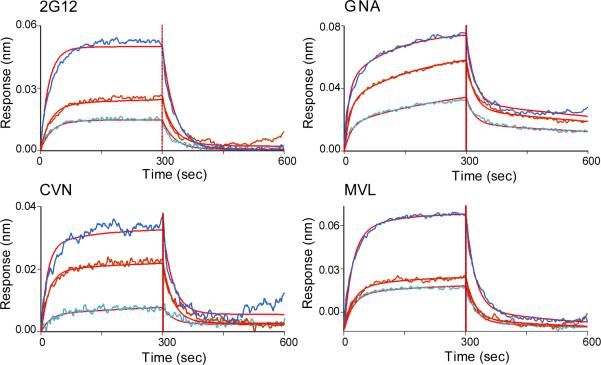
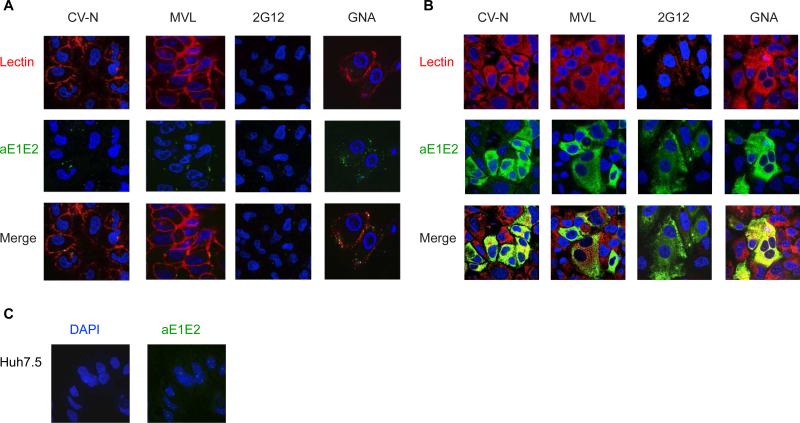
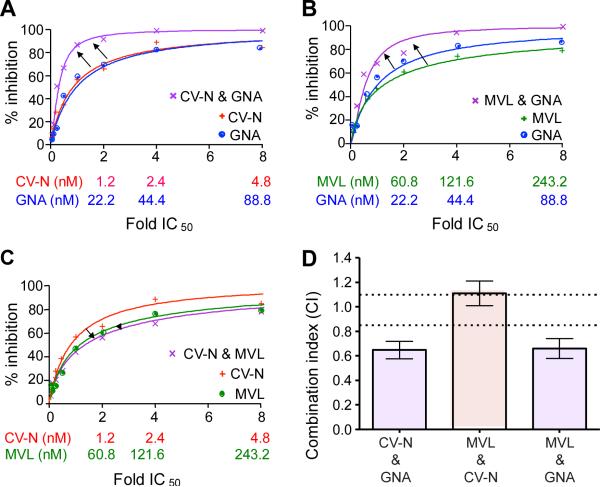
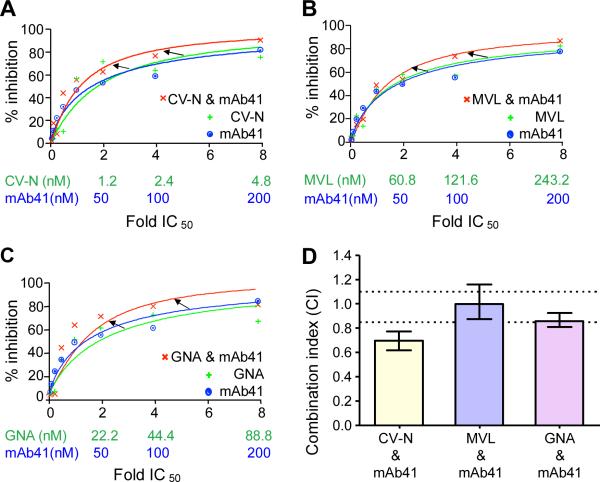
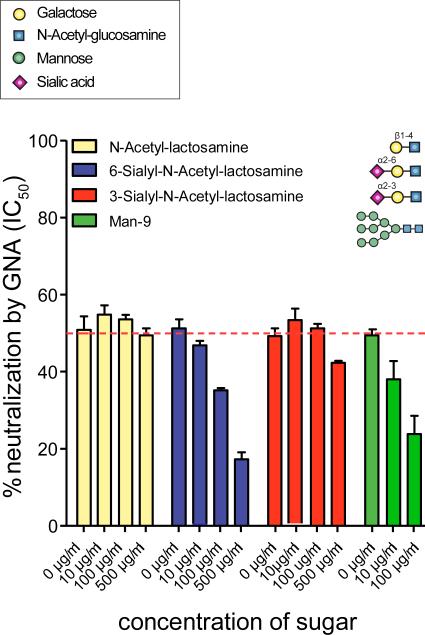
Plant or microbial lectins are known to exhibit potent antiviral activities against viruses with glycosylated surface proteins, yet the mechanism(s) by which these carbohydrate-binding proteins exert their antiviral activities is not fully understood. Hepatitis C virus (HCV) is known to possess glycosylated envelope proteins (gpE1E2) and to be potently inhibited by lectins. Here, we tested in detail the antiviral properties of the newly discovered Microcystis viridis lectin (MVL) along with cyanovirin-N (CV-N) and Galanthus nivalis agglutinin (GNA) against cell culture HCV, as well as their binding properties toward viral particles, target cells, and recombinant HCV glycoproteins. Using infectivity assays, CV-N, MVL, and GNA inhibited HCV with IC50 values of 0.6 nM, 30.4 nM, and 11.1 nM, respectively. Biolayer interferometry analysis demonstrated a higher affinity of GNA to immobilized recombinant HCV glycoproteins compared to CV-N and MVL. Complementary studies, including fluorescence-activated cell sorting (FACS) analysis, confocal microscopy, and pre- and post-virus binding assays, showed a complex mechanism of inhibition for CV-N and MVL that includes both viral and cell association, while GNA functions by binding directly to the viral particle. Combinations of GNA with CV-N or MVL in HCV infection studies revealed synergistic inhibitory effects, which can be explained by different glycan recognition profiles of the mainly high-mannoside specific lectins, and supports the hypothesis that these lectins inhibit through different and complex modes of action. Our findings provide important insights into the mechanisms by which lectins inhibit HCV infection. Overall, the data suggest MVL and CV-N have the potential for toxicity due to interactions with cellular proteins while GNA may be a better therapeutic agent due to specificity for the HCV gpE1E2.
Figures
Similar articles
-
Microcystis viridis NIES-102 Cyanobacteria Lectin (MVL) Interacts with SARS-CoV-2 Spike Protein Receptor Binding Domains (RBDs) via Protein-Protein Interaction.Int J Mol Sci. 2024 Jun 18;25(12):6696. doi: 10.3390/ijms25126696. Int J Mol Sci. 2024. PMID: 38928400 Free PMC article.
-
Microvirin, a novel alpha(1,2)-mannose-specific lectin isolated from Microcystis aeruginosa, has anti-HIV-1 activity comparable with that of cyanovirin-N but a much higher safety profile.J Biol Chem. 2010 Aug 6;285(32):24845-54. doi: 10.1074/jbc.M110.128546. Epub 2010 May 27. J Biol Chem. 2010. PMID: 20507987 Free PMC article.
-
Differential in vitro inhibitory activity against HIV-1 of alpha-(1-3)- and alpha-(1-6)-D-mannose specific plant lectins: implication for microbicide development.J Transl Med. 2007 Jun 12;5:28. doi: 10.1186/1479-5876-5-28. J Transl Med. 2007. PMID: 17565674 Free PMC article.
-
Anti-tumor and anti-viral activities of Galanthus nivalis agglutinin (GNA)-related lectins.Glycoconj J. 2013 Apr;30(3):269-79. doi: 10.1007/s10719-012-9440-z. Epub 2012 Aug 15. Glycoconj J. 2013. PMID: 22893111 Review.
-
Antiviral Cyanometabolites-A Review.Biomolecules. 2021 Mar 22;11(3):474. doi: 10.3390/biom11030474. Biomolecules. 2021. PMID: 33810129 Free PMC article. Review.
Cited by
-
Algal and Cyanobacterial Lectins and Their Antimicrobial Properties.Mar Drugs. 2021 Dec 1;19(12):687. doi: 10.3390/md19120687. Mar Drugs. 2021. PMID: 34940686 Free PMC article. Review.
-
Biolayer interferometry provides a robust method for detecting DNA binding small molecules in microbial extracts.Anal Bioanal Chem. 2021 Feb;413(4):1159-1171. doi: 10.1007/s00216-020-03079-5. Epub 2020 Nov 25. Anal Bioanal Chem. 2021. PMID: 33236226
-
Anti-influenza virus activity of high-mannose binding lectins derived from genus Pseudomonas.Virus Res. 2016 Sep 2;223:64-72. doi: 10.1016/j.virusres.2016.06.020. Epub 2016 Jun 29. Virus Res. 2016. PMID: 27374061 Free PMC article.
-
Legume Lectins with Different Specificities as Potential Glycan Probes for Pathogenic Enveloped Viruses.Cells. 2022 Jan 20;11(3):339. doi: 10.3390/cells11030339. Cells. 2022. PMID: 35159151 Free PMC article. Review.
-
Glycan Shielding and Modulation of Hepatitis C Virus Neutralizing Antibodies.Front Immunol. 2018 Apr 27;9:910. doi: 10.3389/fimmu.2018.00910. eCollection 2018. Front Immunol. 2018. PMID: 29755477 Free PMC article. Review.
References
-
- Bowen DG, Walker CM. Adaptive immune responses in acute and chronic hepatitis C virus infection. Nature. 2005;436:946–952. - PubMed
-
- Pileri P, Uematsu Y, Campagnoli S, Galli G, Falugi F, Petracca R, Weiner AJ, Houghton M, Rosa D, Grandi G, Abrignani S. Binding of hepatitis C virus to CD81. Science. 1998;282:938–941. - PubMed
-
- Evans MJ, von HT, Tscherne DM, Syder AJ, Panis M, Wolk B, Hatziioannou T, McKeating JA, Bieniasz PD, Rice CM. Claudin-1 is a hepatitis C virus co-receptor required for a late step in entry. Nature. 2007;446:801–805. - PubMed
Publication types
MeSH terms
Substances
Grants and funding
LinkOut - more resources
Full Text Sources
Other Literature Sources
