. 2013 Dec;24(24):3857-68.
doi: 10.1091/mbc.E13-06-0333. Epub 2013 Oct 23.

The Rac-GAP Bcr is a novel regulator of the Par complex that controls cell polarity

Affiliations

The Rac-GAP Bcr is a novel regulator of the Par complex that controls cell polarity

Anjana S Narayanan et al. Mol Biol Cell. 2013 Dec.

Abstract

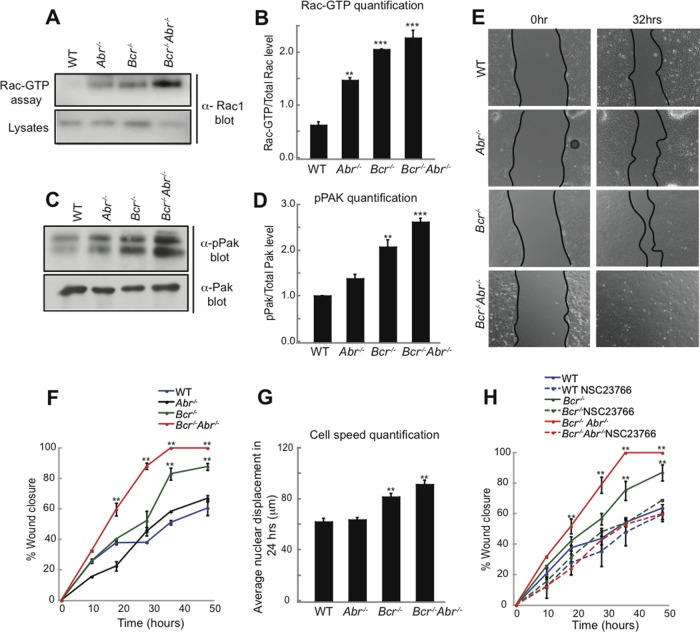
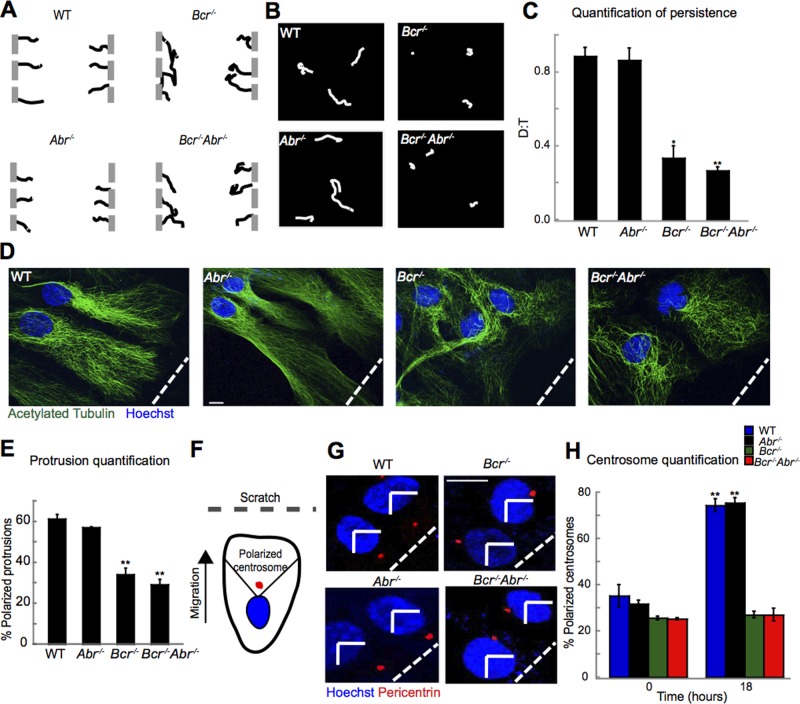
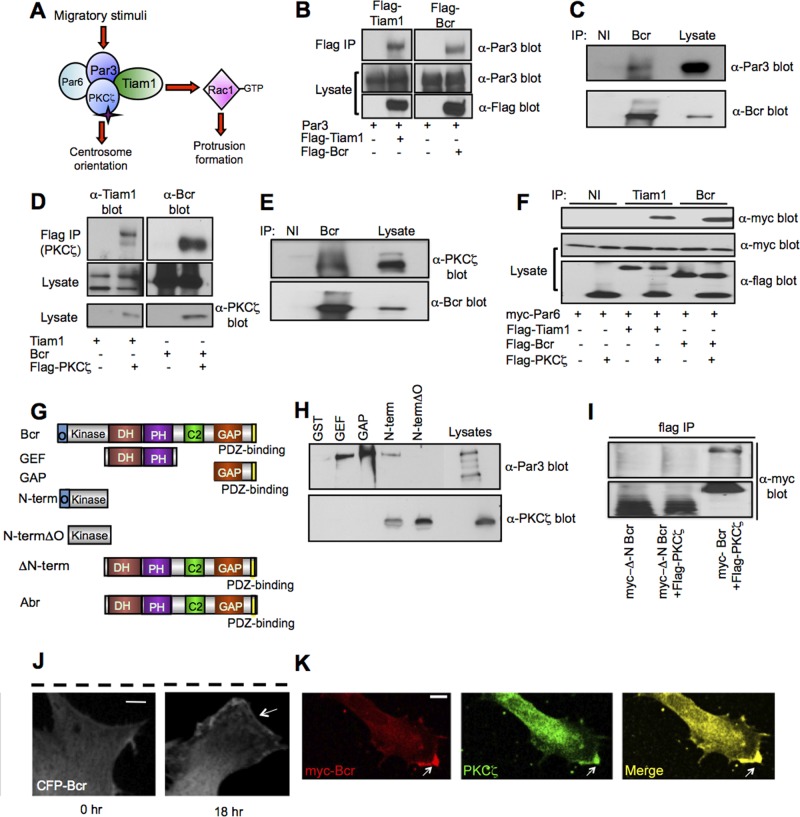
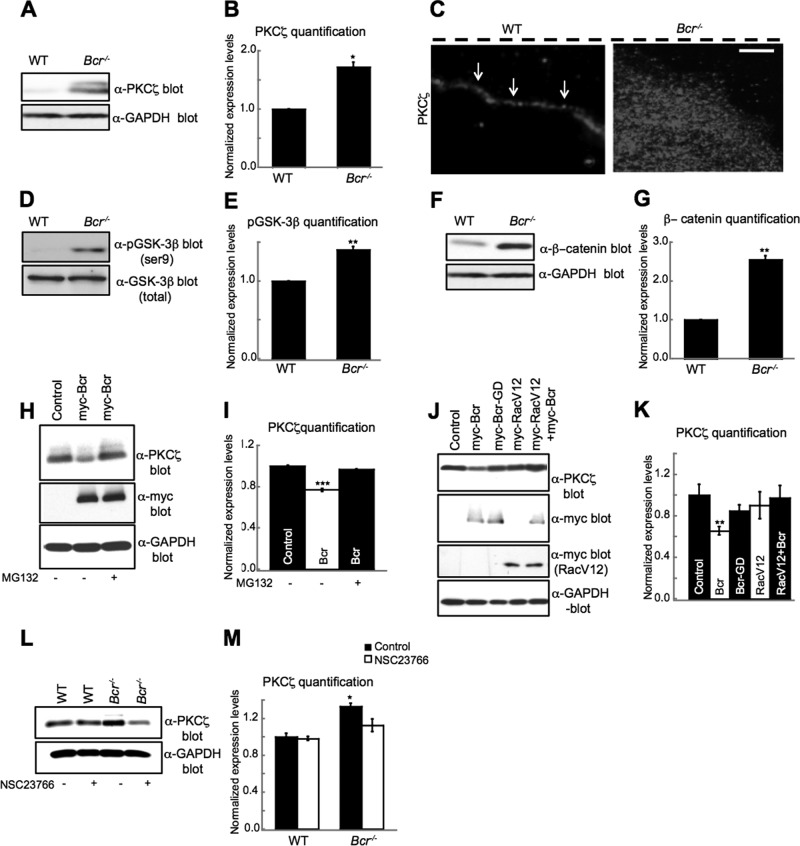
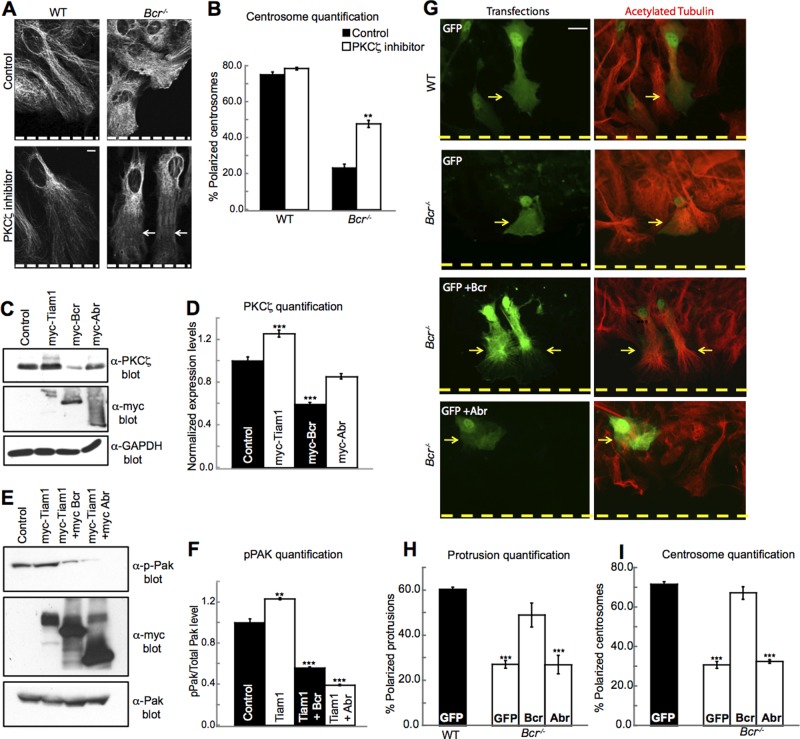
Cell polarization is essential for many biological processes, including directed cell migration, and loss of polarity contributes to pathological conditions such as cancer. The Par complex (Par3, Par6, and PKCζ) controls cell polarity in part by recruiting the Rac-specific guanine nucleotide exchange factor T-lymphoma invasion and metastasis 1 (Tiam1) to specialized cellular sites, where Tiam1 promotes local Rac1 activation and cytoskeletal remodeling. However, the mechanisms that restrict Par-Tiam1 complex activity to the leading edge to maintain cell polarity during migration remain unclear. We identify the Rac-specific GTPase-activating protein (GAP) breakpoint cluster region protein (Bcr) as a novel regulator of the Par-Tiam1 complex. We show that Bcr interacts with members of the Par complex and inhibits both Rac1 and PKCζ signaling. Loss of Bcr results in faster, more random migration and striking polarity defects in astrocytes. These polarity defects are rescued by reducing PKCζ activity or by expressing full-length Bcr, but not an N-terminal deletion mutant or the homologous Rac-GAP, Abr, both of which fail to associate with the Par complex. These results demonstrate that Bcr is an integral member of the Par-Tiam1 complex that controls polarized cell migration by locally restricting both Rac1 and PKCζ function.


Figures

FIGURE 1:
FIGURE 1:
Bcr loss results in increased Rac1 signaling and faster migration in astrocytes. (A) Western blot analysis of the Rac1 activation assay. Activated Rac1 was affinity-purified from WT, Abr−/−, Bcr−/−, and Bcr−/− Abr−/− cortical astrocyte lysates using GST-PBD, and then immunoblotted with α-Rac1 antibodies. Total lysates were also probed for Rac1 to show protein loading. Mutant astrocytes displayed elevated levels of activated Rac1 relative to WT astrocytes.(B) Quantification of Rac1 activation assay. N = 3. (C) Western blot analysis of Pak phosphorylation (pPak). Total levels of Pak are also shown. Loss of the Rac-GAPs Bcr and/or Abr results in increased Pak phosphorylation in cortical astrocytes. (D) Quantification of Pak phosphorylation. N = 3. (E) Representative images of a scratch assay performed on mouse cortical astrocytes. Astrocytes from WT, Abr−/−, Bcr−/−, and Bcr−/−Abr−/− mice were scratched and imaged over a time period of 48 h. Bcr−/− and Bcr−/−Abr−/− astrocytes closed the wound faster than WT or Abr−/− astrocytes, as shown by the representative images at the 32-h time point. (F) Quantification of the scratch assays. Percentage of wound closure was quantified over 48 h in scratch assays performed on WT, Abr−/−, Bcr−/−, and Bcr−/−Abr−/− astrocytes. N = 4. (G) Quantification of cell speed. Nuclear displacements of WT, Abr−/−, Bcr−/−, and Bcr−/−Abr−/− astrocytes were measured over 24 h during the scratch assay. N = 3. (H) Quantification of scratch assays done in the absence or presence of the Tiam1-Rac1 small-molecule inhibitor NSC23766. Percentage of wound closure was quantified over 48 h in scratch assays performed on WT, Abr−/−, Bcr−/−, and Bcr−/−Abr−/− astrocytes treated with PBS (control) or 50 μM NSC23766. Treatment with NSC23766 slowed down Bcr-deficient astroctyes to WT levels. N = 4. Data are shown ± SEM.
FIGURE 2:
FIGURE 2:
Loss of Bcr impairs persistent polarized migration in astrocytes. (A) Representative individual migration tracks of WT, Abr−/−, Bcr−/−, and Bcr−/−Abr−/− cortical astrocytes from the wound-healing assay. N = 3. (B) Representative individual migration tracks of WT Abr−/−, Bcr−/−, and Bcr−/−Abr−/− astrocytes plated at low density. N = 3. (C) Quantification of average persistence (D:T ratio) of migrating WT, Abr−/−, Bcr−/−, and Bcr−/−Abr−/− astrocytes derived from the tracks depicted in (B). A persistence of 1 indicates completely linear migration. N = 3. (D) Protrusion assay. WT, Abr−/−, Bcr−/−, and Bcr−/−Abr−/− astrocyte monolayers were scratched at time 0, and then fixed 18 h postscratch and stained with α-acetylated tubulin antibodies to mark microtubules (green) and Hoechst to mark nuclei (blue). WT and Abr−/− astrocytes formed polarized protrusions perpendicular to the scratch (indicated by the white dashed line), while Bcr−/− and Bcr−/−Abr−/− astrocytes failed to form polarized protrusions. Scale bar: 10 μm. (E) Quantification of the protrusion assay shown as percent of cells with polarized protrusions. n = ∼100; N = 3. (F) Centrosome reorientation assay. Cortical astrocytes were scratched and fixed at 0 and 18 h postscratch and stained with Hoechst (nuclei: blue) and α-pericentrin antibodies (centrosomes: red). Cells with centrosomes in the front marked quadrant were quantified as having polarized centrosomes. (G) Representative images of centrosome reorientation assay. By 18 h, most WT and Abr−/− astrocytes possessed correctly polarized centrosomes, while Bcr−/− and Bcr−/−Abr−/− astrocytes failed to reorient their centrosomes in the polarized direction. Scale bar: 5 μm. (H) Quantification of the centrosome reorientation assay. N = 3. Data are shown ± SEM.
FIGURE 3:
FIGURE 3:
Bcr is a novel interaction partner of the Par-Tiam1 complex. (A) Schematic depicting the role of the Par-Tiam1 complex in polarized cell migration. Tiam1-mediated Rac1 activation promotes cytoskeletal remodeling important for protrusion formation, whereas PKCζ regulates the reorientation of the centrosome. (B) Bcr interacts with Par3 in COS7 cells. Lysates from COS7 cells expressing Par3 in the presence or absence of Flag-tagged Bcr or Tiam1 (positive control) were immunoprecipitated (IP) with an α-Flag antibody, and then immunoblotted with an α-Par3 antibody. Lysates were also immunoblotted with α-Par3 and α-Flag antibodies to demonstrate protein expression. N = 3. (C) Bcr interacts with Par3 in astrocytes. Lysates from cultured rat cortical astrocytes (DIV21) were immunoprecipitated with control immunoglobulin G (IgG; nonimmune: NI) or α-Bcr antibodies, and then immunoblotted with the α-Par3 or α-Bcr antibody. N = 3. (D) Bcr interacts with PKCζ in COS7 cells. Lysates from COS7 cells expressing Tiam1 (positive control) or Bcr alone or in combination with Flag-PKCζ were immunoprecipitated with α-Flag antibody, and then immunoblotted with α-Tiam1 or α-Bcr antibodies. Lysates were also blotted with α-Tiam1, α-Bcr, or α-Flag antibodies to confirm protein expression. N = 3. (E) Bcr interacts with PKCζ in cortical astrocytes. Lysates from cultured rat cortical astrocytes (DIV21) were immunoprecipitated with control IgG (NI) or α-Bcr antibodies, and then immunoblotted with α-PKCζ or α-Bcr antibodies. N = 3. (F) Bcr and Tiam1 require PKCζ to interact with Par6 in COS7 cells. Flag-tagged Tiam1 or Bcr was coexpressed alone or in combination with myc-Par6 in the absence or presence of Flag-PKCζ. Tiam1 and Bcr were immunoprecipitated with α-Tiam1 or α-Bcr antibodies, respectively, and then immunoblotted with anti-myc antibody to assess Par6 association. Lysates were blotted with α-Flag antibody to confirm protein expression. N = 3. (G) Domain structures of full-length Bcr and Abr as well as truncated Bcr constructs used in the domain-mapping experiments. GEF: Dbl homology and pleckstrin homology (DH-PH) domain; GAP: GTPase-activating protein domain; O: oligomerization domain; Kinase: serine/threonine kinase domain; C2: calcium-dependent lipid-binding domain. (H) The N-terminus of Bcr is important for mediating its interaction with members of the Par complex. Lysates from HEK293T cells expressing full-length Par3 or PKCζ were incubated with recombinant Bcr GST-fusion proteins (GEF, GAP, N-term, and N-termΔO) or GST control protein immobilized on beads. Precipitated proteins were then analyzed by immunoblotting with α-Par3 and α-PKCζ antibodies. N = 3. (I) Deletion of the Bcr N-terminus prevents binding of Bcr to PKCζ. Western blot analysis of lysates from COS7 cells transfected with myc-ΔN-Bcr with or without Flag-PKCζ or myc-Bcr and Flag-PKCζ (positive control). Lysates were immunoprecipitated with α-Flag antibody, and then immunoblotted with α-myc antibody. N = 3. (J) Representative confocal images showing the localization of CFP-Bcr before and 18 h after wounding in a scratch assay. White arrows point to CFP-Bcr at the leading edge of a polarized migrating astrocyte; the black dashed line indicates the scratch. Scale bar: 10 μm. n = 20; N = 3. (K) Representative confocal image demonstrating the colocalization of myc-Bcr with endogenous PKCζ at the leading edge of a polarized migrating astrocyte. Scale bar: 10 μm. n = 20; N = 3.
FIGURE 4:
FIGURE 4:
Bcr negatively regulates PKCζ signaling by facilitating its degradation. (A) Western blot analysis of lysates obtained from WT and Bcr−/− mouse cortical astrocytes. Bcr-deficient astrocytes showed an increase in total PKCζ levels. Lysates were also immunoblotted with α-GAPDH antibodies for a loading control. (B) Quantification of PKCζ levels. N = 3. (C) Representative images showing the localization of PKCζ in WT and Bcr−/− astrocytes migrating in a scratch assay. PKCζ is localized to the leading edge (white arrows) in WT cells, whereas PKCζ immunostaining was increased and more diffuse in Bcr−/− cells. Dashed black line shows scratch location. Scale bar: 10 μm. (D) Western blot analysis of lysates obtained from WT and Bcr−/− mouse cortical astrocytes. Bcr-deficient astrocytes showed an increase in p-GSK-3β levels. Lysates were also blotted with total GSK-3β antibodies for a loading control. (E) Quantification of p-GSK-3β levels. N = 3. (F) Western blot analysis of lysates obtained from WT and Bcr−/− mouse cortical astrocytes. Bcr-deficient astrocytes showed an increase in β-catenin levels. Lysates were also blotted with α-GAPDH antibodies for a loading control. (G) Quantification of β-catenin levels. N = 3. (H) Western blot analysis of lysates from COS7 cells expressing myc (control) or myc-Bcr and treated with DMSO (control) or 10 μM of the proteasomal inhibitor MG132. Bcr overexpression reduces PKCζ levels, which is blocked by treating cells with MG132. Lysates were blotted with α-GAPDH antibodies for a loading control. (I) Quantification of PKCζ levels from (H). N = 3. (J) The ability of Bcr to reduce PKCζ levels depends on its Rac-GAP activity. Lysates from COS7 cells expressing myc (control) or myc-tagged Bcr, GAP-dead Bcr (BcrGD), constitutively active Rac (RacV12), or RacV12 plus myc-Bcr were immunoblotted with an α-PKCζ antibody. Lysates were also blotted with α-GAPDH antibodies for a loading control. (K) Quantification of PKCζ levels from (J). N = 3. (L) Bcr reduces PKCζ levels in a Rac-dependent manner. Western blot analysis of lysates obtained from WT and Bcr−/− cortical mouse astrocytes treated overnight with PBS (control) or 50 μM of the Tiam1/Rac inhibitor NSC23766. Lysates were blotted with α-GAPDH for a loading control. (M) Quantification of PKCζ levels from (L). N = 3. Data are shown ± SEM.
FIGURE 5:
FIGURE 5:
Bcr regulates polarity by restricting PKCζ function. (A) PKCζ inhibitor can partially rescue protrusion formation in Bcr−/− cortical mouse astrocytes. Representative images showing WT and Bcr−/− astrocytes treated overnight with PBS (control) or 10 μM of PKCζ pseudosubstrate inhibitor and then fixed and immunostained for acetylated tubulin. Dashed white line represents the scratch. Scale bar: 10 μm. n = ∼100; N = 3. (B) PKCζ inhibitor can partially rescue centrosome reorientation in Bcr−/− cortical mouse astrocytes. Quantification of polarized centrosomes in WT and Bcr−/− cortical mouse astrocytes treated overnight with PBS (control) or 10 μM of PKCζ pseudosubstrate inhibitor. n = ∼100; N = 3. (C) Overexpression of Bcr, but not Abr, negatively regulates PKCζ levels. Western blot analysis was performed on lysates from COS7 cells expressing control (empty vector) or myc-tagged Tiam1, Bcr, or Abr. Lysates were immunoblotted with α-PKCζ antibodies to assess PKCζ levels and α-GAPDH for a loading control. N = 3. (D) Quantification of PKCζ levels from (C). N = 3. (E) Bcr and Abr overexpression reduces Pak phosphorylation in COS7 cells. Western blot analysis of lysates from COS7 cells expressing control (myc) or myc-tagged Tiam1, Tiam1 and Bcr, or Tiam1 and Abr, immunoblotted for PKCζ. Lysates were blotted with an α-GAPDH antibody for a loading control. (F) Quantification of PKCζ levels from (E). N = 3. (G) Expression of Bcr, but not Abr, rescues protrusion defects in Bcr−/− cortical mouse astrocytes. WT astrocytes were transfected with eGFP as a positive control. Bcr−/− astrocytes were transfected with eGFP alone or in combination with Bcr or Abr expression plasmids, and then astrocytes were subjected to scratch assays. Cells were then fixed 18 h postscratch and immunostained for acetylated tubulin (red). Yellow dashed line represents scratch. Scale bar: 10 μm. (H) Quantification of the protrusion assay. n = ∼100; N = 3. (I) Expression of Bcr, but not Abr, can rescue centrosome reorientation defects in Bcr−/− cortical mouse astrocytes. Quantification of polarized centrosomes in WT astrocytes transfected with eGFP (positive control) or Bcr−/− cortical mouse astrocytes transfected with eGFP, eGFP and Bcr, or eGFP and Abr. n = ∼100; N = 3. Data are shown ± SEM.

References

    1. Aranda V, Nolan ME, Muthuswamy SK. Par complex in cancer: a regulator of normal cell polarity joins the dark side. Oncogene. 2008;27:6878–6887. - PMC - PubMed
    1. Cau J, Hall A. Cdc42 controls the polarity of the actin and microtubule cytoskeletons through two distinct signal transduction pathways. J Cell Sci. 2005;118:2579–2587. - PubMed
    1. Chan JR, Jolicoeur C, Yamauchi J, Elliott J, Fawcett JP, Ng BK, Cayouette M. The polarity protein Par-3 directly interacts with p75NTR to regulate myelination. Science. 2006;314:832–836. - PubMed
    1. Chen X, Macara IG. Par-3 controls tight junction assembly through the Rac exchange factor Tiam1. Nat Cell Biol. 2005;7:262–269. - PubMed
    1. Cho YJ, Cunnick JM, Yi SJ, Kaartinen V, Groffen J, Heisterkamp N. Abr and Bcr, two homologous Rac GTPase-activating proteins, control multiple cellular functions of murine macrophages. Mol Cell Biol. 2007;27:899–911. - PMC - PubMed

Publication types

MeSH terms