. 2013 Dec;24(24):3869-80.
doi: 10.1091/mbc.E13-06-0307. Epub 2013 Oct 23.

Emerin organizes actin flow for nuclear movement and centrosome orientation in migrating fibroblasts

Affiliations

Emerin organizes actin flow for nuclear movement and centrosome orientation in migrating fibroblasts

Wakam Chang et al. Mol Biol Cell. 2013 Dec.

Abstract

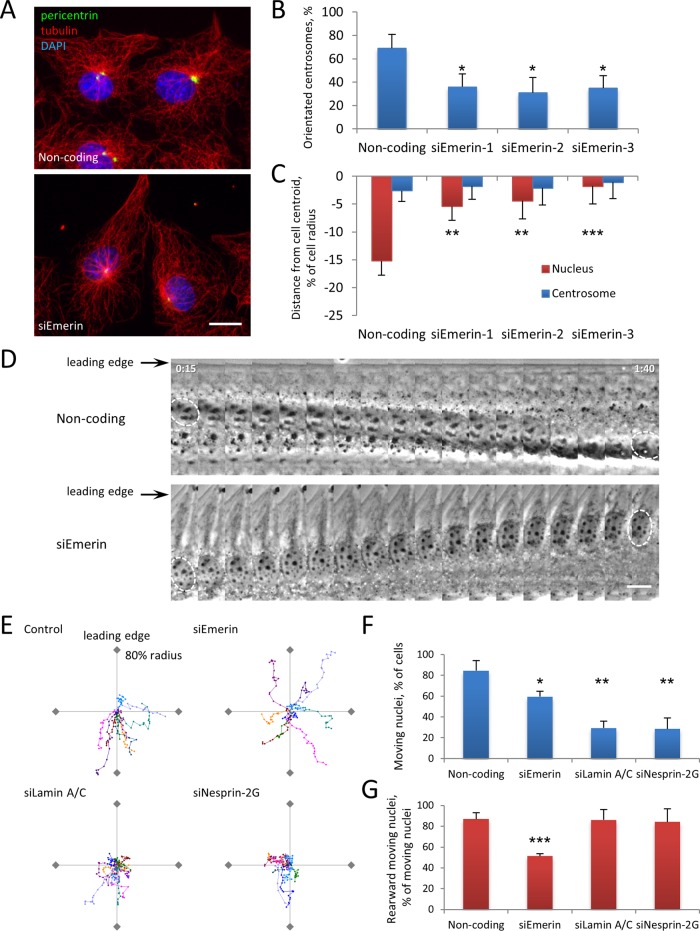
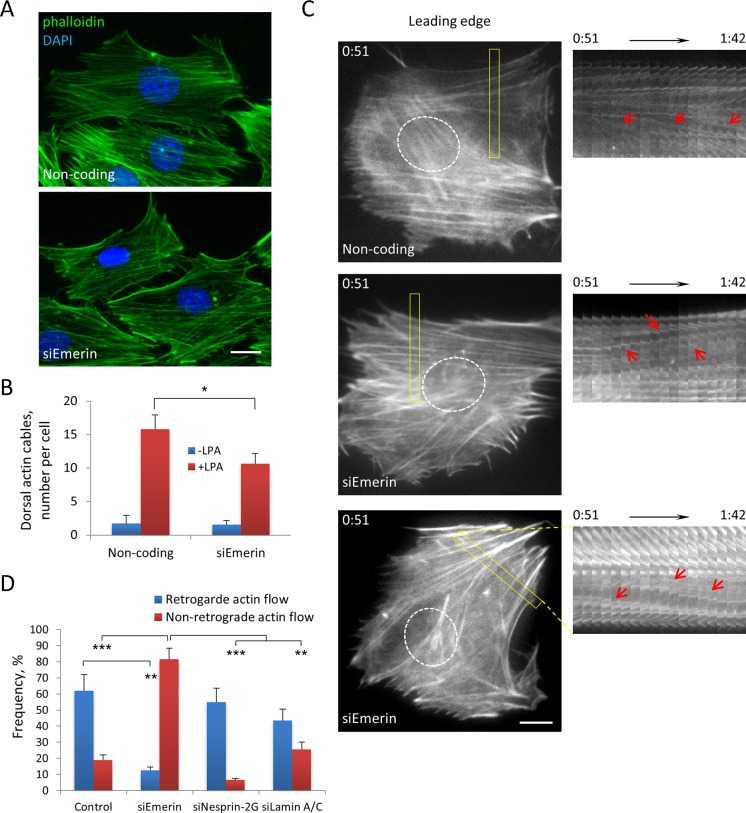
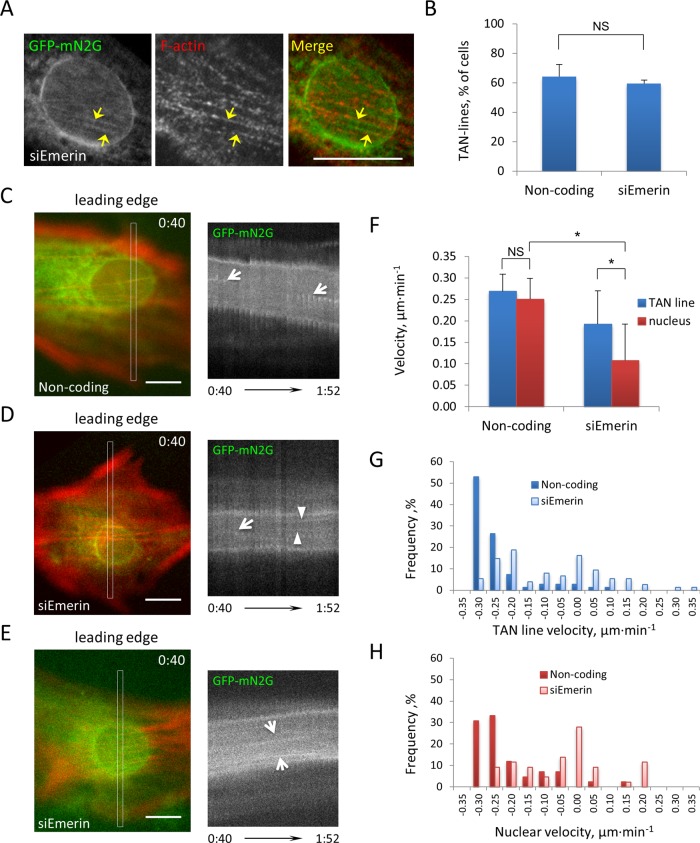
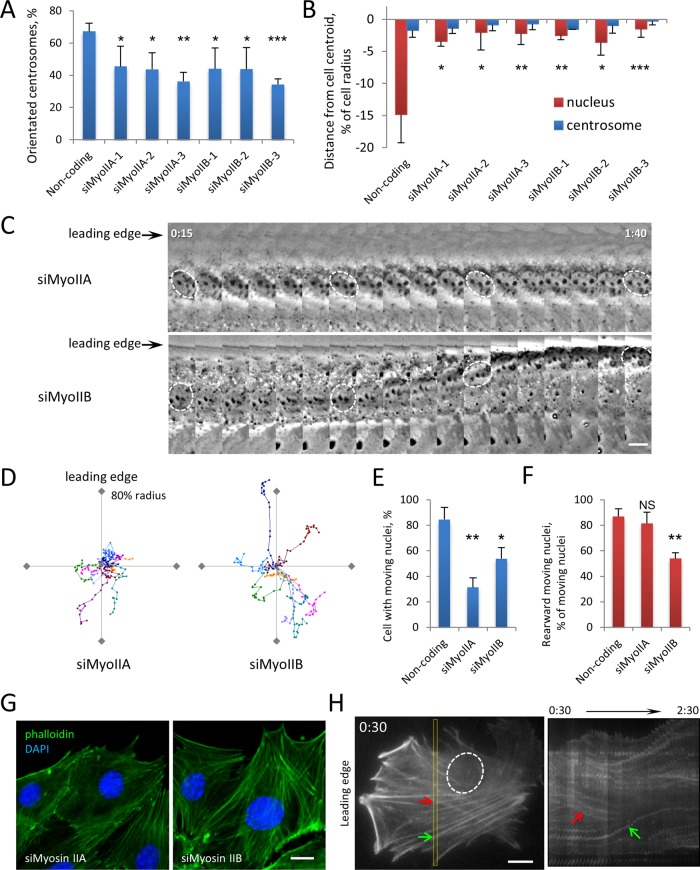
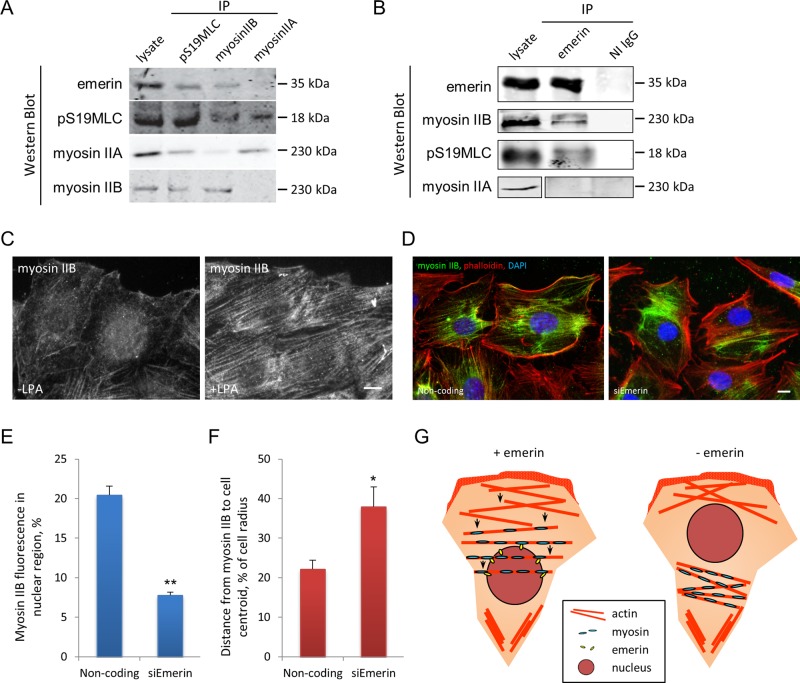
In migrating fibroblasts, rearward movement of the nucleus orients the centrosome toward the leading edge. Nuclear movement results from coupling rearward-moving, dorsal actin cables to the nucleus by linear arrays of nesprin-2G and SUN2, termed transmembrane actin-associated nuclear (TAN) lines. A-type lamins anchor TAN lines, prompting us to test whether emerin, a nuclear membrane protein that interacts with lamins and TAN line proteins, contributes to nuclear movement. In fibroblasts depleted of emerin, nuclei moved nondirectionally or completely failed to move. Consistent with these nuclear movement defects, dorsal actin cable flow was nondirectional in cells lacking emerin. TAN lines formed normally in cells lacking emerin and were coordinated with the erratic nuclear movements, although in 20% of the cases, TAN lines slipped over immobile nuclei. Myosin II drives actin flow, and depletion of myosin IIB, but not myosin IIA, showed similar nondirectional nuclear movement and actin flow as in emerin-depleted cells. Myosin IIB specifically coimmunoprecipitated with emerin, and emerin depletion prevented myosin IIB localization near nuclei. These results show that emerin functions with myosin IIB to polarize actin flow and nuclear movement in fibroblasts, suggesting a novel function for the nuclear envelope in organizing directional actin flow and cytoplasmic polarity.


Figures

FIGURE 1:
FIGURE 1:
Emerin is required for centrosome orientation and nuclear movement. (A) Representative images of LPA-stimulated NIH3T3 cells transfected with noncoding or emerin siRNA (siEmerin) and immunostained for tubulin (red), the centrosomal marker pericentrin (green), and DAPI for nuclei (blue). (B) Quantification of LPA-stimulated centrosome orientation in NIH3T3 cells treated with noncoding siRNA or three different siRNAs against emerin as indicated. Centrosome orientation between the leading edge and nucleus was scored as described previously (Palazzo et al., 2001); random orientation is 33% by this measure. Error bars, SD from three experiments (N > 120 cells). (C) Quantification of nucleus and centrosome position in emerin-depleted NIH3T3 cells treated with noncoding siRNA or three different siRNAs against emerin as indicated. The cell centroid is defined as 0; positive values, toward the leading edge; negative, away. Error bars, SEM from three experiments (N ≥ 100 cells). Centrosome position was not affected by siEmerin (p > 0.9, ANOVA). (D) Kymographs from representative phase contrast movies of LPA-stimulated NIH3T3 cells treated with noncoding or emerin siRNAs. Nuclei are outlined in the first and last frames. Note the rearward-moving nucleus in noncoding siRNA control (top) and the forward-moving nucleus in emerin siRNA–treated cells (bottom). Time, hours:minutes after LPA stimulation; each panel represents 5 min. (E) Representative traces of LPA-stimulated nuclear movement in NIH3T3 cells treated with the indicated siRNAs. Ten traces are plotted with a common origin. Axes represent 80% of cell radius; leading edge is at the top of the y-axis. Points represent 5 min; total time, 90 min. (F, G) Quantification of moving nuclei (F) and percentage of moving nuclei that moved rearward (G) from phase contrast movies of LPA-stimulated NIH3T3 cells treated with indicated siRNA. Error bars, SD from three experiments (N ≥ 60 cells). In B,C, F, and G statistical significance is compared with noncoding siRNA. Bars, 10 μm (A, D).
FIGURE 2:
FIGURE 2:
Emerin affects retrograde flow. (A) Representative fluorescence images of F-actin (phalloidin) and nuclei (DAPI) in NIH3T3 cells transfected with noncoding or emerin siRNAs and stimulated with LPA. (B) Quantification of number of dorsal actin cables localized above the nucleus in cells treated with indicated siRNAs. Error bars, SD from three experiments with N ≥ 90 cells. C) Left, panels from movies of LifeAct-mCherry in NIH3T3 cells transfected with noncoding and emerin (two examples) siRNAs and stimulated with LPA. The position of the nucleus is shown by the dotted outline. Right, kymographs of boxed regions shown on the left. Red arrows, moving actin cables. Note that actin cables move retrogradely in noncoding siRNA control (top) and anterogradely (middle) or obliquely (bottom) in siEmerin. Time is in hours:minutes. D) Categorization of actin flow types (see Materials and Methods) from movies of Lifeact-mCherry–expressing cells treated with indicated siRNAs. Error bars, SD from three experiments (N ≥ 60 movies). Retrograde actin flow was significantly different from control in siEmerin but not in siNesprin-2 G or siLamin A/C. Nonretrograde actin flow was significantly different in siEmerin compared with control and siNesprin-2G and siLamin. Bars, 10 μm (A, C).
FIGURE 3:
FIGURE 3:
TAN lines form in cells lacking emerin. (A) Representative fluorescence image of a nucleus in an LPA-stimulated NIH3T3 cell treated with emerin siRNA and expressing GFP-mN2G and stained for GFP, emerin, and F-actin. Arrows, TAN lines. (B) Quantification of TAN line formation in noncoding and emerin siRNA–treated NIH3T3 cells expressing GFP-mN2G. Error bars, SD from three experiments (N > 60 cells). siEmerin vs. noncoding, p > 0.3. (C–E) Left, panels from movies of LifeAct-mCherry and GFP-mN2G in NIH3T3 cells transfected with noncoding (C) and emerin (D, E) siRNAs and stimulated with LPA. Right, kymographs of GFP-mN2G from boxed regions shown on the left. Arrows, diagonal signals indicating retrograde (C, D) and anterograde (E) movement of TAN lines; arrowheads, horizontal signals (D) indicating immobile TAN lines. TAN lines moved with the moving nucleus in C and E but either slip (arrow) or are immobile (arrowheads) on the immobile nucleus in D. Time, hours:minutes (bottom). (F) Quantification of TAN line and nuclear velocities in cells treated with the indicated siRNAs. Error bars, SD from three experiments (N > 60 cells). (G, H) Frequency plots of TAN line and nuclear movement velocities. Positive velocity indicates forward movement, and negative velocity indicates rearward movement. Note that in emerin-depleted cells TAN line and nuclear velocities exhibited greater variation as well as positive values, indicating movement in a forward direction. Bars, 10 μm (A, C–E).
FIGURE 4:
FIGURE 4:
Myosin IIB depletion causes nuclear movement and actin retrograde flow phenotypes similar to those of emerin depletion. (A) Quantification of centrosome reorientation in LPA-stimulated NIH3T3 cells treated with indicated siRNAs. Error bars, SD from three experiments (N ≥ 100 cells). (B) Nucleus and centrosome position in cells treated as in A. Error bars, SEM from three experiments (N ≥ 100 cells). None of the myosin siRNAs showed a difference in centrosome position compared with noncoding siRNA (p > 0.4, ANOVA). (C) Kymographs of nuclear movement from phase contrast movies of LPA-stimulated cells depleted of myosin IIA or myosin IIB. Nuclei are outlined in several frames. Time, hours:minutes after LPA stimulation; each panel represents 5 min. (D) Representative traces of LPA-stimulated nuclear movement in NIH3T3 cells depleted of myosin IIA or myosin IIB. Traces are plotted as in Figure 1E legend. (E, F) Quantification of moving nuclei (E) and percentage of moving nuclei that moved rearward (F) from phase contrast movies of LPA-stimulated NIH3T3 cells treated with indicated siRNA. Error bars, SD from three experiments (N ≥ 60 movies). (G) Representative fluorescence images of F-actin (phalloidin) and nuclei (DAPI) in myosin IIA– and myosin IIB–depleted NIH3T3 cells stimulated with LPA (see Figure 2A for noncoding control). (H) Initial panel (left, oval indicates nucleus) and kymograph of insert region (right) from movie of LifeAct-mCherry in myosin IIB–depleted NIH3T3 cells stimulated with LPA. Arrows indicate actin cables moving obliquely relative to the leading edge. Time, hours:minutes after LPA. Bars, 10 μm (C, G, H).
FIGURE 5:
FIGURE 5:
Emerin interacts specifically with myosin IIB. (A) Western blots of indicated proteins immunoprecipitated by pSer19MLC and myosin II antibodies from NIH3T3 cell lysates. Lysate, 2% of input. (B) Western blots of indicated proteins immunoprecipitated by emerin antibody or nonimmune immunoglobulin G (NI IgG) from NIH3T3 cell lysates. Lysate, 25% of input. (C) Representative immunofluorescence micrographs showing myosin IIB localization before and 30 min after LPA stimulation of NIH3T3 cells. (D) Myosin IIB and actin localization relative to the nucleus (DAPI) in LPA-stimulated NIH 3T3 cells treated with noncoding or emerin siRNAs. Note the reduced perinuclear myosin IIB in cells treated with emerin siRNA compared with control cells treated with noncoding siRNA. (E) Quantification of myosin IIB immunofluorescence signals localized to the nuclear region in cells treated with indicated siRNAs. (F) Quantification of distance from centroid of myosin IIB immunofluorescence signal to cell centroid (as percentage of cell radius) in cells treated with the indicated siRNAs. In E and F, error bars are SD of three experiments with N > 90. (G) Model depicting emerin coupling of myosin IIB to the nucleus to control the directionality of actin cable flow in cells polarizing for migration. In cells that lack emerin, the displacement of myosin IIB from the perinuclear area alters the central “contractility sink” and prevents the establishment of normal retrograde actin flow. Bars, 10 μm (C, D).

References

    1. Adam SA, Marr RS, Gerace L. Nuclear protein import in permeabilized mammalian cells requires soluble cytoplasmic factors. J Cell Biol. 1990;111:807–816. - PMC - PubMed
    1. Berk JM, Tifft KE, Wilson KL. The nuclear envelope LEM-domain protein emerin. Nucleus. 2013;4:298–314. - PMC - PubMed
    1. Bione S, Maestrini E, Rivella S, Mancini M, Regis S, Romeo G, Toniolo D. Identification of a novel X-linked gene responsible for Emery-Dreifuss muscular dystrophy. Nat Genet. 1994;8:323–327. - PubMed
    1. Borrego-Pinto J, Jegou T, Osorio DS, Aurade F, Gorjanacz M, Koch B, Mattaj IW, Gomes ER. Samp1 is a component of TAN lines and is required for nuclear movement. J Cell Sci. 2012;125:1099–1105. - PubMed
    1. Cai Y, et al. Nonmuscle myosin IIA-dependent force inhibits cell spreading and drives F-actin flow. Biophys J. 2006;91:3907–3920. - PMC - PubMed

Publication types

MeSH terms