

Mortality among high-risk patients with acute myocardial infarction admitted to U.S. teaching-intensive hospitals in July: a retrospective observational study
- PMID: 24152859
- PMCID: PMC4125575
- DOI: 10.1161/CIRCULATIONAHA.113.004074
Mortality among high-risk patients with acute myocardial infarction admitted to U.S. teaching-intensive hospitals in July: a retrospective observational study
Abstract
Background: Studies of whether inpatient mortality in US teaching hospitals rises in July as a result of organizational disruption and relative inexperience of new physicians (July effect) find small and mixed results, perhaps because study populations primarily include low-risk inpatients whose mortality outcomes are unlikely to exhibit a July effect.
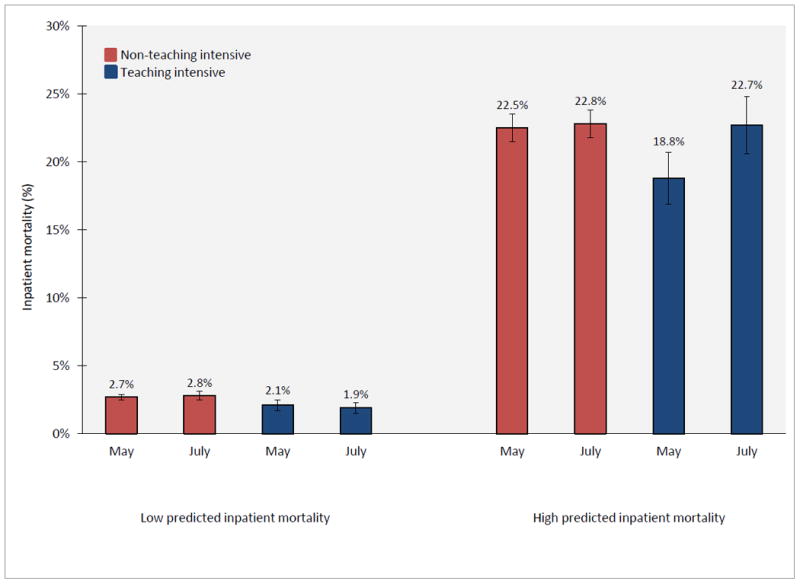
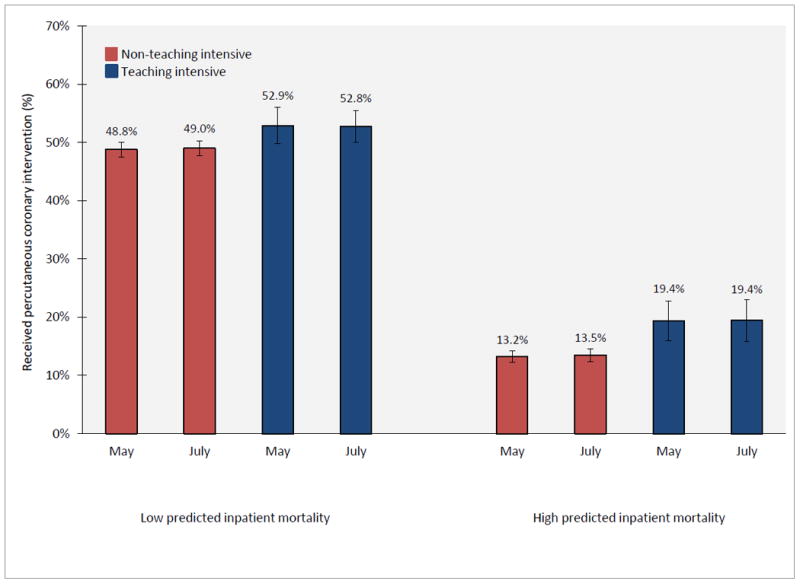
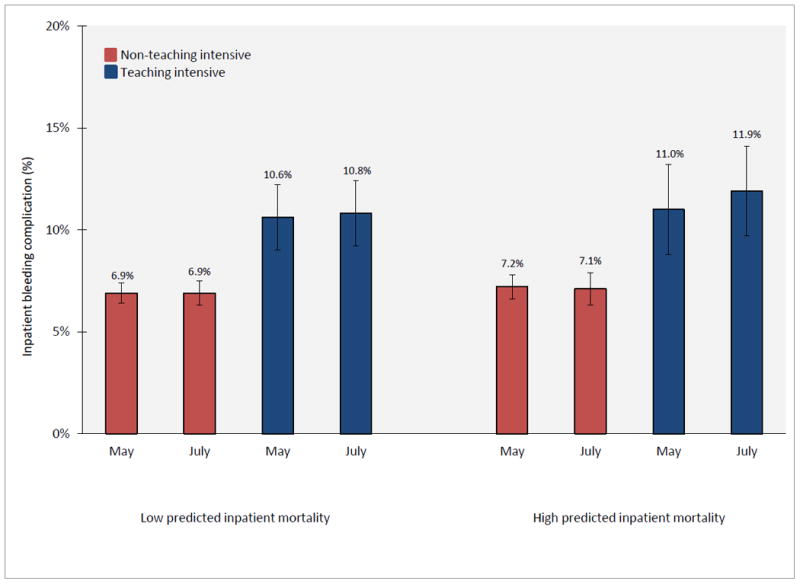
Methods and results: Using the US Nationwide Inpatient sample, we estimated difference-in-difference models of mortality, percutaneous coronary intervention rates, and bleeding complication rates, for high- and low-risk patients with acute myocardial infarction admitted to 98 teaching-intensive and 1353 non-teaching-intensive hospitals during May and July 2002 to 2008. Among patients in the top quartile of predicted acute myocardial infarction mortality (high risk), adjusted mortality was lower in May than July in teaching-intensive hospitals (18.8% in May, 22.7% in July, P<0.01), but similar in non-teaching-intensive hospitals (22.5% in May, 22.8% in July, P=0.70). Among patients in the lowest three quartiles of predicted acute myocardial infarction mortality (low risk), adjusted mortality was similar in May and July in both teaching-intensive hospitals (2.1% in May, 1.9% in July, P=0.45) and non-teaching-intensive hospitals (2.7% in May, 2.8% in July, P=0.21). Differences in percutaneous coronary intervention and bleeding complication rates could not explain the observed July mortality effect among high risk patients.
Conclusions: High-risk acute myocardial infarction patients experience similar mortality in teaching- and non-teaching-intensive hospitals in July, but lower mortality in teaching-intensive hospitals in May. Low-risk patients experience no such July effect in teaching-intensive hospitals.
Keywords: mortality; myocardial infarction.
Conflict of interest statement
Conflict of Interest Disclosures: None.
Figures
Comment in
-
The July phenomenon revisited: new insights on a lore of academic medicine.Circulation. 2013 Dec 24;128(25):2729-31. doi: 10.1161/CIRCULATIONAHA.113.006758. Epub 2013 Oct 23. Circulation. 2013. PMID: 24152860 No abstract available.
-
Letter by Blakey et al regarding article, "Mortality among high-risk patients with acute myocardial infarction admitted to US teaching-intensive hospitals in July: a retrospective observational study".Circulation. 2014 Sep 2;130(10):e93. doi: 10.1161/CIRCULATIONAHA.114.007492. Circulation. 2014. PMID: 25210101 No abstract available.
Similar articles
-
Mortality among high-risk patients admitted with septic shock to U.S. teaching hospitals in July: Does the 'July Effect' exist?Heart Lung. 2017 Mar-Apr;46(2):110-113. doi: 10.1016/j.hrtlng.2017.01.010. Epub 2017 Feb 22. Heart Lung. 2017. PMID: 28236500
-
Letter by Blakey et al regarding article, "Mortality among high-risk patients with acute myocardial infarction admitted to US teaching-intensive hospitals in July: a retrospective observational study".Circulation. 2014 Sep 2;130(10):e93. doi: 10.1161/CIRCULATIONAHA.114.007492. Circulation. 2014. PMID: 25210101 No abstract available.
-
Hospital teaching intensity and mortality for acute myocardial infarction, heart failure, and pneumonia.Med Care. 2014 Jan;52(1):38-46. doi: 10.1097/MLR.0000000000000005. Med Care. 2014. PMID: 24322988
-
Mortality among hospitalized Medicare beneficiaries in the first 2 years following ACGME resident duty hour reform.JAMA. 2007 Sep 5;298(9):975-83. doi: 10.1001/jama.298.9.975. JAMA. 2007. PMID: 17785642
-
The July phenomenon revisited: new insights on a lore of academic medicine.Circulation. 2013 Dec 24;128(25):2729-31. doi: 10.1161/CIRCULATIONAHA.113.006758. Epub 2013 Oct 23. Circulation. 2013. PMID: 24152860 No abstract available.
Cited by
-
Geographic variation in the delivery of high-value inpatient care.PLoS One. 2019 Mar 25;14(3):e0213647. doi: 10.1371/journal.pone.0213647. eCollection 2019. PLoS One. 2019. PMID: 30908492 Free PMC article.
-
Acute Myocardial Infarction Mortality During Dates of National Interventional Cardiology Meetings.J Am Heart Assoc. 2018 Mar 9;7(6):e008230. doi: 10.1161/JAHA.117.008230. J Am Heart Assoc. 2018. PMID: 29523525 Free PMC article.
-
Impact of Resident Rotations on Critically Ill Patient Outcomes: Results of a French Multicenter Observational Study.PLoS One. 2016 Sep 14;11(9):e0162552. doi: 10.1371/journal.pone.0162552. eCollection 2016. PLoS One. 2016. PMID: 27627449 Free PMC article.
-
Traumatic spinal cord injury in the United States, 1993-2012.JAMA. 2015 Jun 9;313(22):2236-43. doi: 10.1001/jama.2015.6250. JAMA. 2015. PMID: 26057284 Free PMC article.
-
The association between physician turnover (the "July Effect") and survival after in-hospital cardiac arrest.Resuscitation. 2017 May;114:133-140. doi: 10.1016/j.resuscitation.2017.03.004. Epub 2017 Mar 8. Resuscitation. 2017. PMID: 28285032 Free PMC article.
References
-
- Young JQ, Ranji SR, Wachter RM, Lee CM, Niehaus B, Auerbach AD. “July effect”: Impact of the academic year-end changeover on patient outcomes: A systematic review. Ann Intern Med. 2011;155:309–315. - PubMed
-
- Huckman RS, Barro JR, National Bureau of Economic Research . Cohort turnover and productivity : The july phenomenon in teaching hospitals. Cambridge, Mass.: National Bureau of Economic Research; 2005.
-
- Anderson KL, Koval KJ, Spratt KF. Hip fracture outcome: Is there a “july effect”? Am J Orthop (Belle Mead NJ) 2009;38:606–611. - PubMed
-
- Bakaeen FG, Huh J, LeMaire SA, Coselli JS, Sansgiry S, Atluri PV, Chu D. The july effect: Impact of the beginning of the academic cycle on cardiac surgical outcomes in a cohort of 70,616 patients. Ann Thorac Surg. 2009;88:70–75. - PubMed
Publication types
MeSH terms
Grants and funding
LinkOut - more resources
Full Text Sources
Other Literature Sources
Medical
