Comparative Study
. 2013 Nov 28;503(7477):525-529.
doi: 10.1038/nature12686. Epub 2013 Oct 23.

Differential L1 regulation in pluripotent stem cells of humans and apes

Affiliations
Comparative Study

Differential L1 regulation in pluripotent stem cells of humans and apes

Maria C N Marchetto et al. Nature. .

Abstract

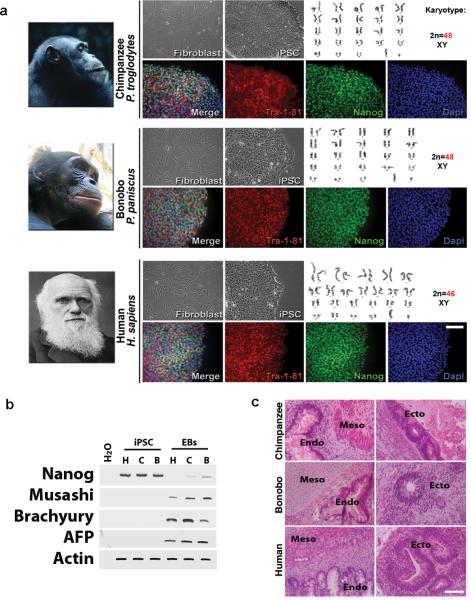
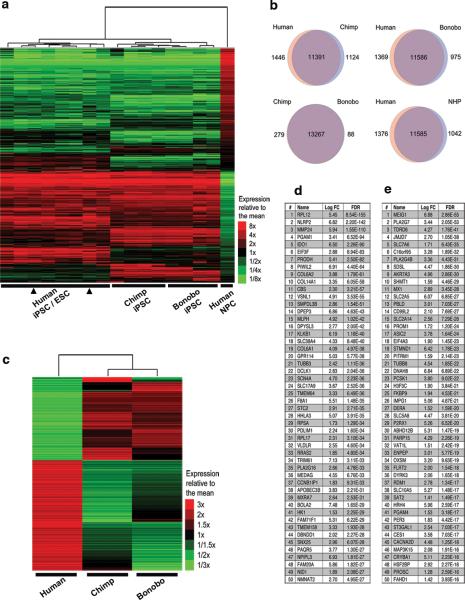
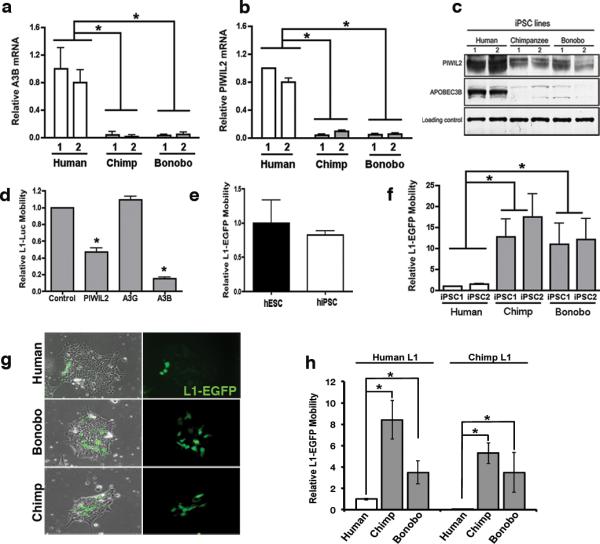
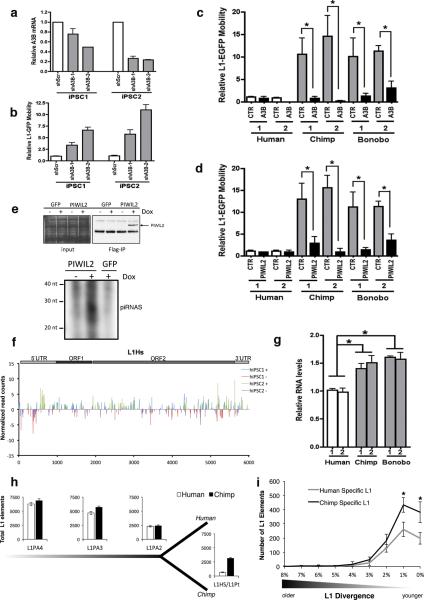
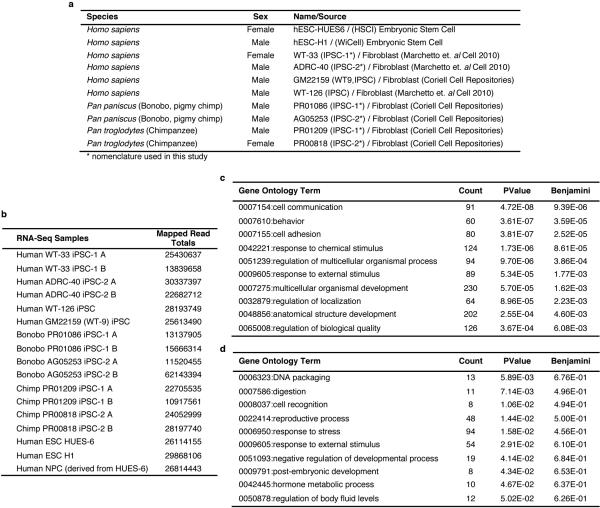
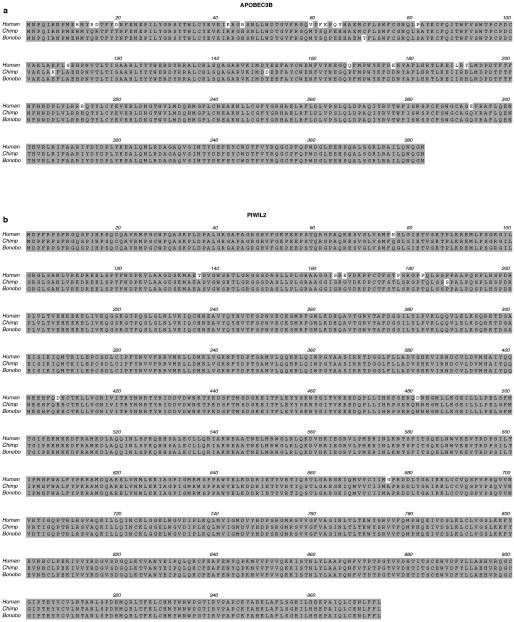
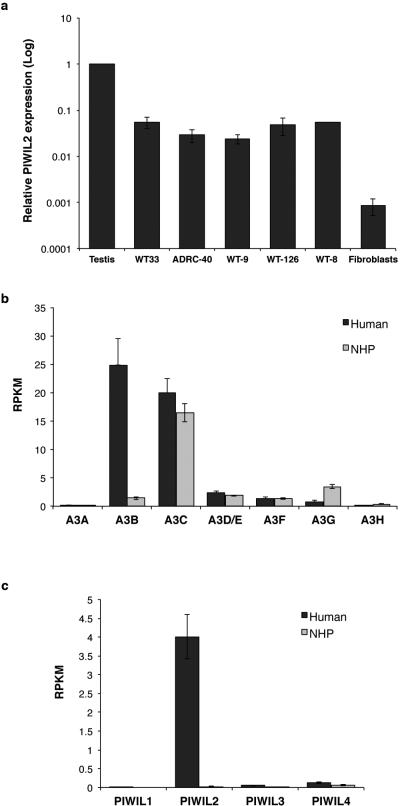
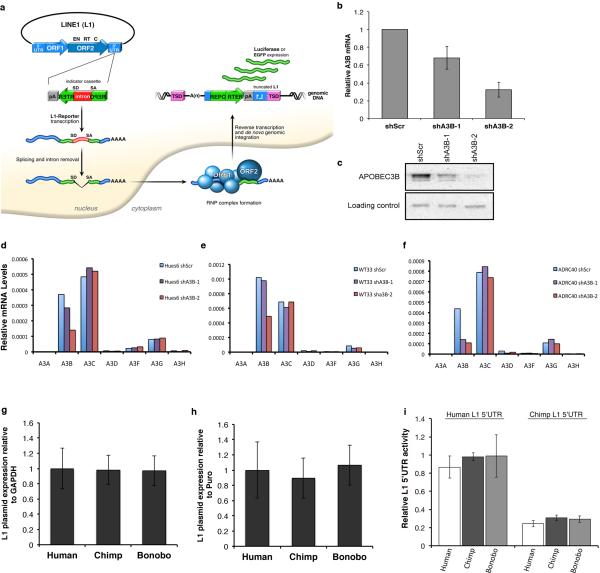
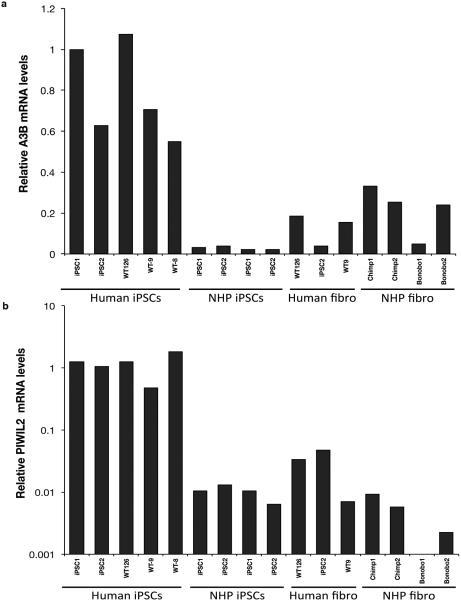
Identifying cellular and molecular differences between human and non-human primates (NHPs) is essential to the basic understanding of the evolution and diversity of our own species. Until now, preserved tissues have been the main source for most comparative studies between humans, chimpanzees (Pan troglodytes) and bonobos (Pan paniscus). However, these tissue samples do not fairly represent the distinctive traits of live cell behaviour and are not amenable to genetic manipulation. We propose that induced pluripotent stem (iPS) cells could be a unique biological resource to determine relevant phenotypical differences between human and NHPs, and that those differences could have potential adaptation and speciation value. Here we describe the generation and initial characterization of iPS cells from chimpanzees and bonobos as new tools to explore factors that may have contributed to great ape evolution. Comparative gene expression analysis of human and NHP iPS cells revealed differences in the regulation of long interspersed element-1 (L1, also known as LINE-1) transposons. A force of change in mammalian evolution, L1 elements are retrotransposons that have remained active during primate evolution. Decreased levels of L1-restricting factors APOBEC3B (also known as A3B) and PIWIL2 (ref. 7) in NHP iPS cells correlated with increased L1 mobility and endogenous L1 messenger RNA levels. Moreover, results from the manipulation of A3B and PIWIL2 levels in iPS cells supported a causal inverse relationship between levels of these proteins and L1 retrotransposition. Finally, we found increased copy numbers of species-specific L1 elements in the genome of chimpanzees compared to humans, supporting the idea that increased L1 mobility in NHPs is not limited to iPS cells in culture and may have also occurred in the germ line or embryonic cells developmentally upstream to germline specification during primate evolution. We propose that differences in L1 mobility may have differentially shaped the genomes of humans and NHPs and could have continuing adaptive significance.


Figures

Figure 1
Figure 1. Characterization of iPSCs derived from the three primate species
(a) Morphology of fibroblasts and iPSCs. No karyotypic abnormalities were observed in iPSCs clones. Immunofluorescence for pluripotency makers, Tra-1-81 and Nanog in iPSCs. Bar = 10 μm. (b). RT-PCR for undifferentiation marker (Nanog) and for the three germ cell layers (Musashi, Brachyury and AFP) in human, chimpanzee and bonobo iPSCs (H, C and B, respectively) and in differentiated embryoid bodies (EBs). (c) Hematoxylin and eosin staining of teratoma sections showing differentiation into three germ layers: goblet cells in gastro-intestinal tract (endo); neuro retinal epithelium (ecto) and muscle and cartilage/bone (meso). Bar = 150 μm.
Figure 2
Figure 2. RNA-seq profiling of human and NHP iPSCs
(a) High-throughput sequencing of 14 RNA samples corresponding to four human, two chimp and two bonobo iPSC lines. hESCs (H1 and Hues6, arrowheads) and hESC-derived neural progenitor cells (NPCs). Heat map representation of mapped reads corresponding to protein-coding genes. (b) Venn diagrams showing pairwise comparison of protein-coding genes. Pink and blue: significantly up-regulated genes (FDR<0.05 and fold change>2) Purple: expressed genes with no significant differences in mRNA levels between compared species. (c) Heat map representation of differentially expressed protein-coding genes with FDR<0.05 and FC>2 between human and NHP iPSCs. (d, e) List of the top 50 differentially expressed genes in human iPSCs compared to NHP iPSCs with elevated expression in human iPSCs (d) and elevated expression in NHPs (e). PIWIL2 and APOBEC3 were expressed at significantly higher levels in human iPSCs than in NHP iPSCs (positions 8 and 38 in table d, respectively). Rank, gene name, Logarithmic base 2 fold change (Log FC), and false discovery rates (FDR) are shown.
Figure 3
Figure 3. Reduced levels of A3B and PIWIL2 and increased L1 mobility in NHP iPSCs
(a,b) Quantitative PCR analysis of A3B (a) and PIWIL2 (b) expression in human and NHP iPSCs (Extended Data Fig. 2 and 9). (c) Immunoblot for A3B and PIWIL2. (d) Effect of A3B and PIWIL2 on L1-luciferase retrotransposition in 293T cells. 293T cells were co-transfected with L1-Luc plasmid (pYX017) plus control, PIWIL2, A3B or A3G expressing plasmid. L1-Luc mobility was calculated as firefly luciferase units relative to renilla luciferase units. L1 activity is shown as relative to control plasmid. (e) Comparable levels of L1-EGFP mobility in hESCs and hiPSCs. L1-GFP mobility is shown as percentage of EGFP-positive cells by FACS relative to hESCs. (f) L1-EGFP retrotransposition in human, chimp and bonobo iPSCs. L1 mobility was calculated as % of EGFP-positive cells and shown as relative L1 mobility to human IPSC1. (g) Representative images of human, chimpanzee and bonobo iPSCs transfected with L1-EGFP. (h) Retrotransposition quantitation of species-specific L1 elements. Human and Chimp reporter L1-EGFP elements (human-L1 and chimp-L1, respectively) mobility was quantified in transfected in human, chimp and bonobo iPSCs. Retrotranposition activity is shown as relative to Human-L1 activity in human iPSCs. Error bars, s.e.m. *P<0.01 between indicated groups using t-test (for a,b,e,f n=3 biological replicates; d and h n=4 biological replicates).
Figure 4
Figure 4. Species-specific L1 elements are more abundant in chimpanzee genomes than in human genomes, correlating with decreased levels of A3B and PIWIL2
(a) Stable knockdown of A3B (shA3B-1, shA3B-2) or control (shScr) in human iPSCs. A3B expression was normalized to GAPDH and shown as relative to shScr. (b) L1-EGFP mobility in shA3B iPSCs. EGFP-positive cells were quantified by FACS analysis and shown as relative to shScr iPSC line. (c,d) Overexpression of A3B (c) and PIWIL2 (d) decreases L1-EGFP retrotransposition in NHP iPSCs. Cells were electroporated with L1-EGFP plus control (CTR), A3B or PIWIL2 expressing plasmids. L1-EGFP mobility is shown as relative to human iPSC-1 CTR. (e) Immunoprecipitation of piRNAs associated with PIWIL2 in human iPSCs. (Top) Immunoprecipitation of PIWIL2 RNPs from Tet-inducible GFP and Flag-tagged PIWIL2 human iPSCs after addition of Doxycycline. (Bottom) γ32P-ATP 5’end labeling of RNA associated with Flag-PIWIL2 RNPs. Size markers are indicated. (f) Mapping of 26-33 nt RNA reads (containing uracil in the 5’end and/or adenine at position +10) detected by small RNA-seq from hiPSC1 and hiPSC2 to consensus L1Hs (Repbase). Positive and negative values indicate sense and antisense piRNAs,, respectively. Schematic representation of L1 is shown on top. Y-axes: read counts normalized to 107 reads per experiment. (g) Quantitative RT-PCR analysis of endogenous L1 RNA in human and NHP iPSCs. Values represent the average of relative levels for L1 RNA (5’UTR, ORF1, ORF2) normalized to Actin mRNA levels. L1 levels are shown as relative to IPSC-1. (h) Comparative quantitative analysis of L1 elements in human and chimpanzee genomes for L1 families L1PA4, L1PA3, L1PA2, L1Pt and L1Hs. (i) Number of species-specific L1 insertions (L1PA2, L1Hs, L1Pt) relative to their divergence. L1 elements plotted as a histogram relative to their divergence (number of mutations relative to the canonical element). Error bars: s.d.. *P<0.001 between human and chimpanzee, Mann-Whitney test (a,b,c,d and g, error bars: s.e.m., *P<0.01 between indicated groups, t-test, a,b,c and d, n=3; g n=4 biological replicates).
Extended Data Figure 1
Cell lines used in this study, number of mapped reads per sample in RNA-seq and gene ontology (GO) enrichment analysis for differentially expressed genes. (a) Origin of iPSCs used or generated in this study. (c,d) GO enrichment analysis of differentially expressed genes. (b) Total number of mapped reads per sample in RNA-seq (c) Top 10 enriched GO terms for genes with higher expression in human versus NHP iPSCs. (d) Top 10 enriched GO terms for genes highly expressed in NHP versus human iPSCs. GO analysis was restricted to differentially expressed protein-coding genes (FDR <0.05 and FC >2). GO enrichment for biological processes (level 2) was performed using DAVID. Figure shows GO term, number of genes (count), and p values for EASE score and Benjamini adjustment.
Extended Data Figure 2
Amino acid alignment of A3B and PIWIL2. Protein sequences of human, chimp and bonobo A3B (a) or PIWIL2 (b) were aligned using ClustalW. (a) Alignment of A3B showing >93% identity between human and NHP proteins. (b) Alignment of PIWIL2 showing >98% identity between human and NHP proteins.
Extended Data Figure 3
mRNA levels of APOBEC3 and PIWI-like family members in iPSCs. (a) Comparative analysis of PIWIL2 mRNA levels. Quantitative RT-PCR analysis of PIWIL2 mRNA levels in human testis, human iPSC cell lines and available fibroblasts from, which the iPSC lines were derived from. mRNA levels were normalized to GAPDH and shown as relative to human testis (mean ± s.e.m.; n=3 biological replicates). Compared to testis, PIWIL2 levels are 20 to 40 fold lower in iPSCs and ~1,100-fold lower in fibroblasts. (b,c). Quantification of mRNA levels of APOBEC3 and PIWI-like family members in human and NHP iPSCs by RNA-seq. Increased mRNA levels in human iPSCs is restricted for APOBEC3B and PIWIL2. Y-axes: reads per kilobase per million mapped reads (RPKM).
Extended Data Figure 4
L1 reporter activity in iPSCs. (a) L1 retrotransposition reporter system. The L1-reporter plasmid harbors a retrotransposition-competent human L1 element and carries either a EGFP or a Luciferase (Luc) reporter construct in its 3’ UTR region. The reporter gene is interrupted by an intron in the same transcriptional orientation as the L1 transcript. This arrangement ensures that EGFP/Luc-positive cells will arise only when a transcript initiated from the promoter driving L1 expression is spliced, reverse transcribed, and integrated into chromosomal DNA, thereby allowing expression of the reporter gene from a heterologous promoter. (b-f) Efficient A3B knockdown in human ESCs and iPSCs. (b) Stable shRNA-mediated knockdown of A3B in hESCs (Hues6) using lentivirus expressing different shRNAs against A3B (shA3B-1 and shA3B-2) or control shScramble (shScr). Levels of A3B expression were normalized for GAPDH and shown as relative to shScr (mean ± s.e.m.; n=3 biological replicates). (c) Western blot confirming stable A3B knockdown in hESCs. (d-f) shRNA-mediated knockdown in hESC (Hues6) and iPSC-1 and iPSC-2 (WT33 and Adrc40) was specific for A3B. (g-h) Quantitative RT-PCR analysis of plasmid expression in iPSC lines transfected with L1-EGFP plasmid. Total RNA samples were obtained 60-72 hours post-transfection. L1 plasmid-driven EGFP expression was normalized to GAPDH (g) or Puromycin (h). L1-EGFP contains a puromycin expression cassette under PGK promoter control. Thus, puromycin expression can be used as normalizer for transfection. IPSCs from two different individuals per species were transfected, and EGFP levels are shown as relative to human iPSCs. No significant differences were observed for L1 plasmid expression between human and NHP iPSC lines (mean ± s.e.m.;n=3 biological replicates). (i) Relative L1 5’UTR promoter activity. Human and chimp L1 promoters (L1 5’UTR) were inserted upstream of firefly luciferase reporter in pGL4.10 and transfected into human and NHP iPSC lines. A plasmid expressing Renila luciferase was co-transfected as control. 72 hours post transfection luciferase activity was quantified as firefly luciferase units relative to renilla luciferase units. Results are shown as normalized to human L1 5’UTR activity in human iPSC. IPSCs from two different individuals per species were transfected. No significant differences were observed for L1 promoter activities between human and NHP iPSC lines (mean ± s.e.m; n=4 biological replicates).
Extended Data Figure 5
Nucleic acid alignment of human and chimpanzee L1 elements. Sequence of the chimpanzee L1Pt element cloned and used to generate the chimpanzee L1-EGFP tagged reporter plasmid (L1IN71) (top sequence). LRE3: human L1 (bottom sequence).
Extended Data Figure 6
Immunoprecipitation of piRNAs associated with PIWIL2 in human iPSCs and annotated piRNAs mapping to consensus L1Hs in iPSCs. (a) Immunoprecipitation of PIWIL2 RNPs using Flag-tag antibodies from Tet-inducible Flag-tagged PIWIL2 human iPSCs after addition of Doxyclycine to the culture media. HA-tag antibody was used as control. (b), γ32P-ATP end labeling of RNAs associated with Flag-PIWIL2 RNPs. Signal in the piRNAs size range is detected only in anti-Flag but not in control antibody anti-HA immunoprecipitates. (c) Size distribution of RNA reads detected by small RNA-seq from small RNAs samples extracted from human iPSC cell lines (hiPSC1 and hiPSC2). (d) Number of mapped reads per sample in small RNA-seq. (e) Number of annotated piRNAs (piRNAbank) detected by RNA-seq in human iPSC1 and iPSC2. (f) Characterization of 5’ end of piRNAs detected in human iPSCs relative to annotated piRNAs. Read count distribution relative to piRNA 5' ends (piRNAbank). (g) Sequences of annotated piRNAs (piRNAbank) mapping to consensus L1Hs detected in human iPSC1 and iPSC2. 26-33nt RNA reads from human iPS cell lines 1 and 2 (hiPSC1 and hiPSC2) characterized by RNASeq are aligned to annotated piRNAs mapping to the consensus L1Hs sequence. Analysis of mapping sequences was performed allowing 2 mismatches.
Extended Data Figure 7
Mapping of 26-33 nt RNAs in human iPSCs to consensus L1Hs. (a) Mapping of annotated piRNAs (piRNAbank) detected by RNA-seq from human iPSC lines (hiPSC1 and hiPSC2) to the consensus sequence for L1Hs (from Repbase). All annotated piRNAs (piRNAbank) complementary to the L1Hs are indicated (black bars). (b) Total 26-33 nt RNA reads characterized by small RNA seq mapped to L1Hs. (c) Similar analysis as in (b) of ENCODE data for small RNAs from human ES H1 cells (hESC H1). Positive and negative values indicate sense and antisense piRNAs (+/−), respectively. Schematic representation of the L1Hs element is shown (top). Y-axes represent read counts normalized to 107 reads per experiment.
Extended Data Figure 8
Higher levels of endogenous L1 RNA and recent species-specific L1 elements in chimpanzee. (a) Scheme of amplicons mapped to the L1Hs consensus sequence. Six primer pairs (two per region) were used for quantification of 5'UTR, ORF1 and ORF2. The primers were designed to recognize both species-specific and common families. (b) Positions of the amplicons in L1Hs consensus sequence and the number of in silico PCR hits on the Human and Chimp genomes. (c) Quantitative RT-PCR analysis using primers for different regions of L1 element show higher levels of L1 RNA in NHP iPSCs regardless of the L1 region tested: 5’-UTR, ORF1 and ORF2. (mean ± s.e.m.; n=3 biological replicates; *P<0.01 between indicated groups, t-test). (dg) Quantification of L1 elements in human and chimpanzee genomes using a population divergence model. Number of L1 elements found in the human and chimpanzee genomes for families: L1PA4 (d), L1PA3 (e), L1PA2 (f), and L1Pt and L1Hs (g) plotted as a histogram relative to their divergence (number of mutations relative to the canonical element). The standard deviation describes the differences in L1 density based on the sampling of different genomic regions and represents the variability of L1 coverage across the genomes (see methods).
Extended Data Figure 9
Relative APOBEC3B and PIWIL2 mRNA levels in iPSC and fibroblasts. Relative expression of (a) A3B and (b) PIWIL2 in human and NHP iPSC lines, and the available source fibroblasts from, which iPSCs were derived from. mRNA levels were normalized to GAPDH and shown as relative to human iPSC1.

Comment in

References

    1. Chimpanzee S, Analysis C. Initial sequence of the chimpanzee genome and comparison with the human genome. Nature. 2005;437:69–87. - PubMed
    1. Prufer K, et al. The bonobo genome compared with the chimpanzee and human genomes. Nature. 2012;486:527–531. - PMC - PubMed
    1. Lander ES, et al. Initial sequencing and analysis of the human genome. Nature. 2001;409:860–921. - PubMed
    1. Waterston RH, et al. Initial sequencing and comparative analysis of the mouse genome. Nature. 2002;420:520–562. - PubMed
    1. Kazazian HH., Jr. Mobile elements: drivers of genome evolution. Science. 2004;303:1626–1632. doi:10.1126/science.1089670. - PubMed

Publication types

MeSH terms

Associated data