. 2013 Oct 24;502(7472):550-4.
doi: 10.1038/nature12710.

A diurnal serum lipid integrates hepatic lipogenesis and peripheral fatty acid use

Affiliations

A diurnal serum lipid integrates hepatic lipogenesis and peripheral fatty acid use

Sihao Liu et al. Nature. .

Abstract

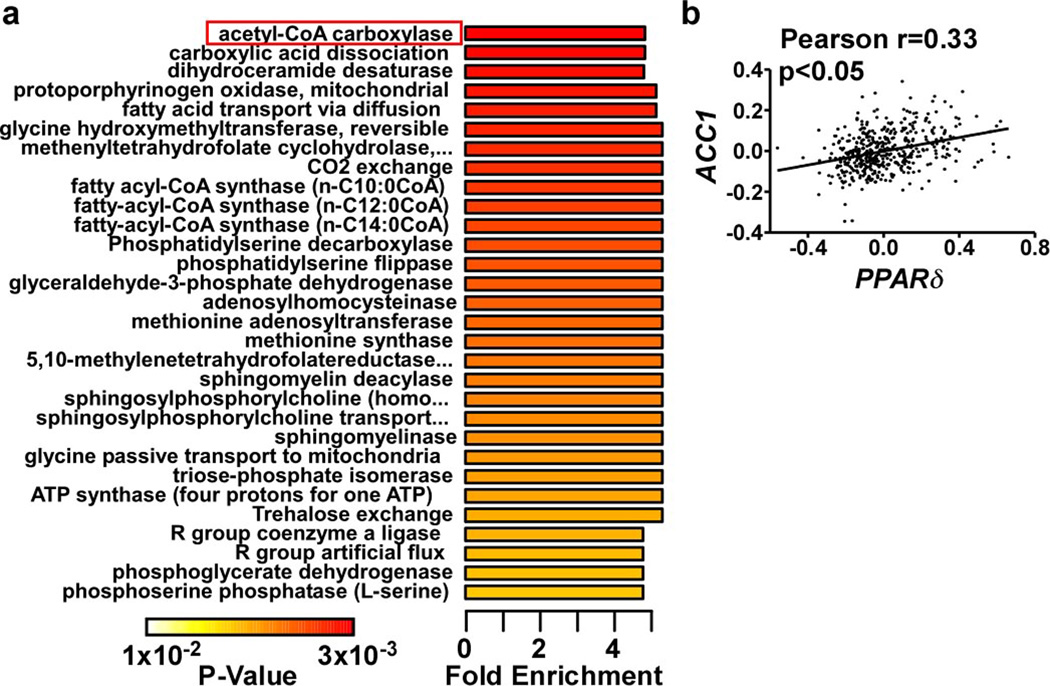
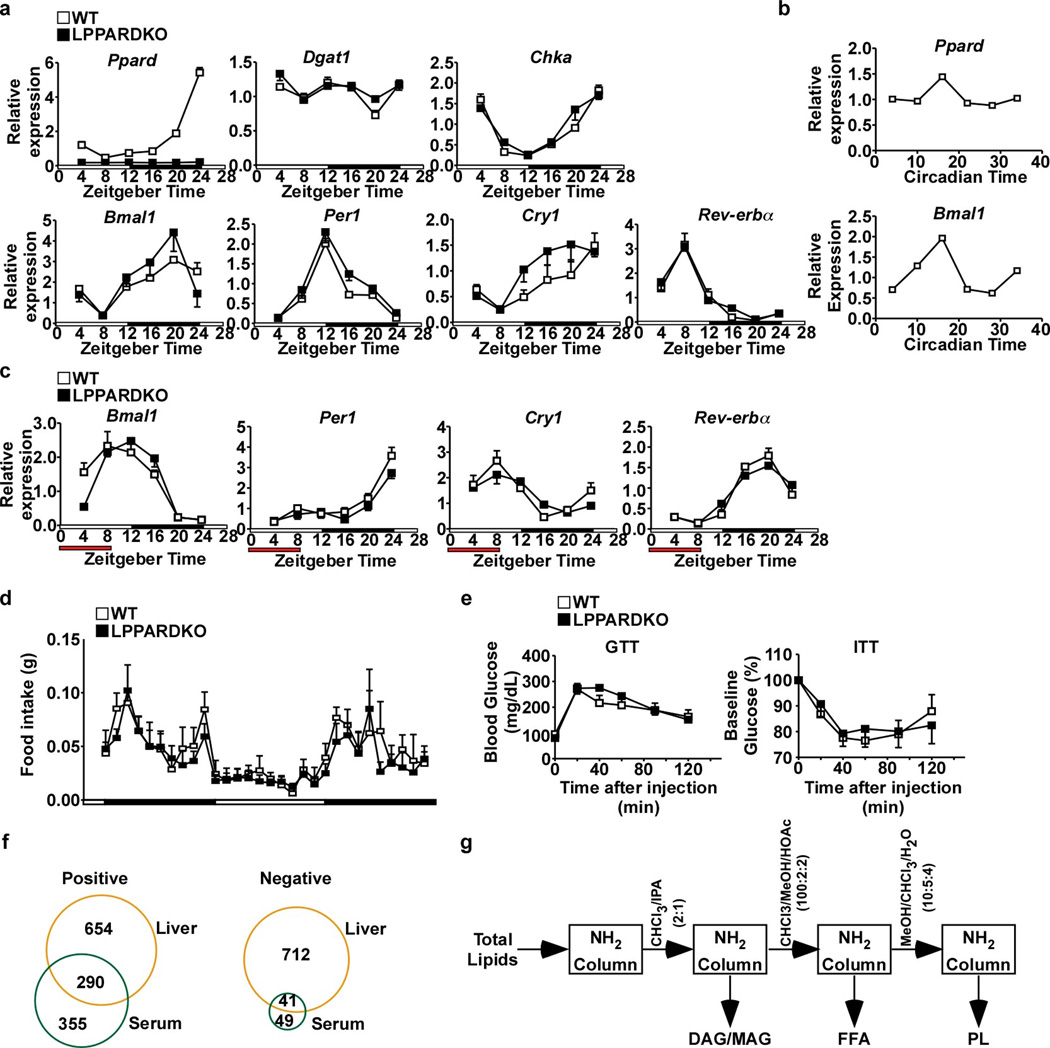
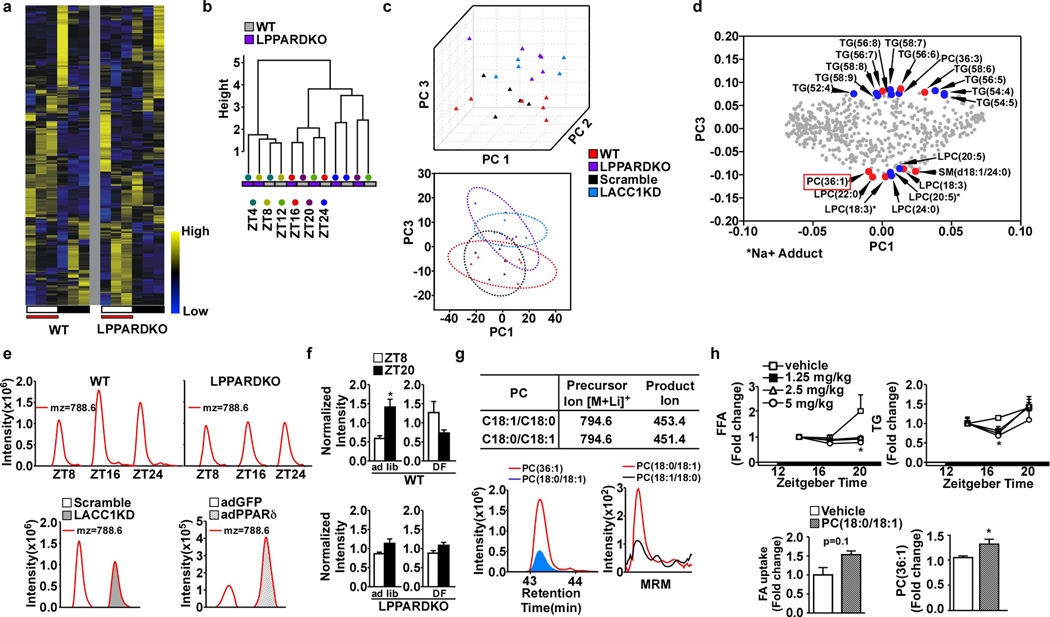
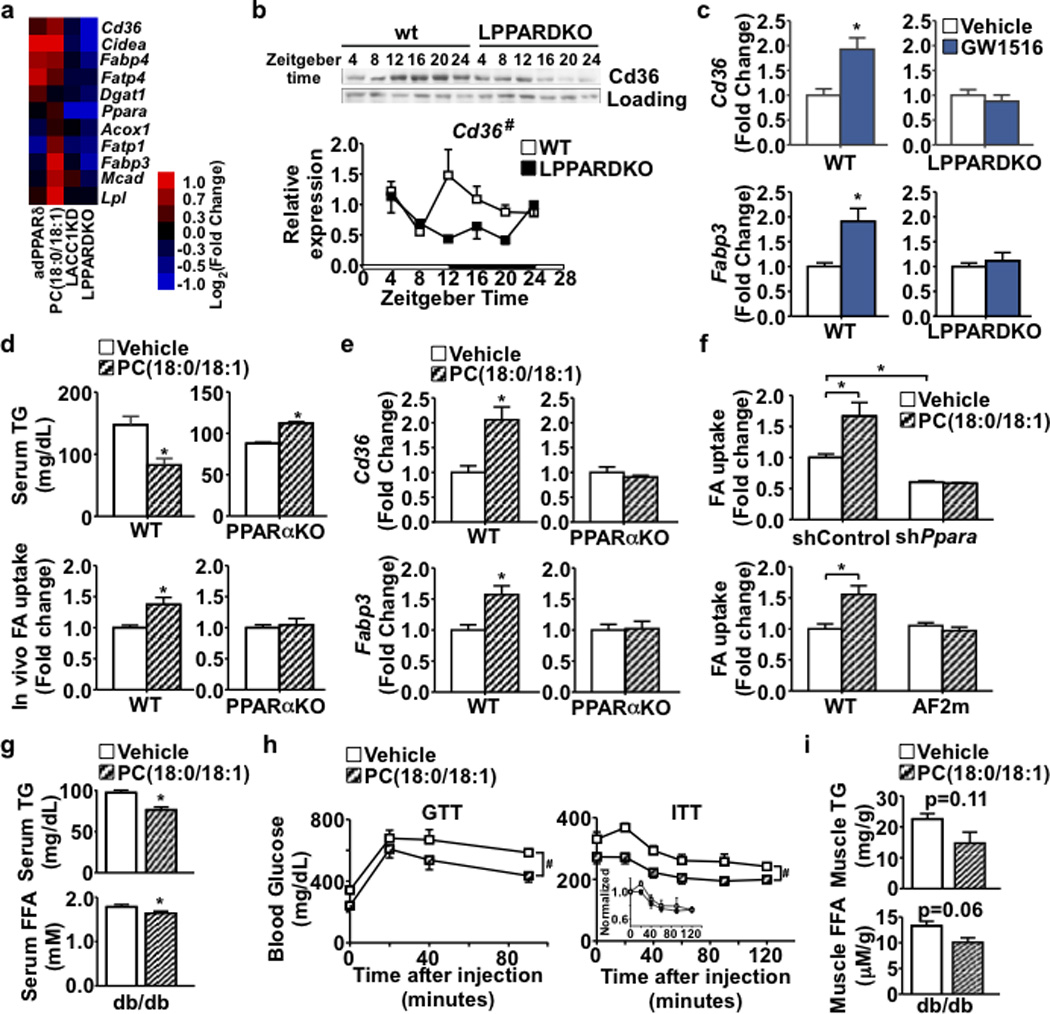
Food intake increases the activity of hepatic de novo lipogenesis, which mediates the conversion of glucose to fats for storage or use. In mice, this program follows a circadian rhythm that peaks with nocturnal feeding and is repressed by Rev-erbα/β and an HDAC3-containing complex during the day. The transcriptional activators controlling rhythmic lipid synthesis in the dark cycle remain poorly defined. Disturbances in hepatic lipogenesis are also associated with systemic metabolic phenotypes, suggesting that lipogenesis in the liver communicates with peripheral tissues to control energy substrate homeostasis. Here we identify a PPARδ-dependent de novo lipogenic pathway in the liver that modulates fat use by muscle via a circulating lipid. The nuclear receptor PPARδ controls diurnal expression of lipogenic genes in the dark/feeding cycle. Liver-specific PPARδ activation increases, whereas hepatocyte-Ppard deletion reduces, muscle fatty acid uptake. Unbiased metabolite profiling identifies phosphatidylcholine 18:0/18:1 (PC(18:0/18:1) as a serum lipid regulated by diurnal hepatic PPARδ activity. PC(18:0/18:1) reduces postprandial lipid levels and increases fatty acid use through muscle PPARα. High-fat feeding diminishes rhythmic production of PC(18:0/18:1), whereas PC(18:0/18:1) administration in db/db mice (also known as Lepr(-/-)) improves metabolic homeostasis. These findings reveal an integrated regulatory circuit coupling lipid synthesis in the liver to energy use in muscle by coordinating the activity of two closely related nuclear receptors. These data implicate alterations in diurnal hepatic PPARδ-PC(18:0/18:1) signalling in metabolic disorders, including obesity.


Figures

Extended Data Figure 1
Extended Data Figure 1. Analyses of liver lipid metabolites altered by PPARδ over-expression
a. Metabolite set enrichment analysis (MSEA) of lipids from adGFP and adPPARδ liver lysates (n=4). Metabolites were identified based on database search of matching mass-charge ratio and retention time. Identified metabolites and their relative quantity were used to calculate the enrichment and statistical significance. Top 30 perturbed enzyme or pathways were shown. List of metabolites recognized by the Metaboanalyst program and subsequently used for the MSEA analysis is shown in Supplementary Table 1. b. Correlation of hepatic PPARD and ACC1 expression in human liver. Human liver gene expression microarray data was downloaded from gene expression omnibus (GSE9588) and analyzed using Graphpad Prism. *p<0.05 (t-test).
Extended Data Figure 2
Extended Data Figure 2. Molecular clock expression, food intake and glucose metabolism in wt and LPPARDKO mice
a. Liver gene expression in wt and LPPARDKO mice (n=4, each time point). White bar: light cycle starting at ZT4; Black bar: dark cycle. b. Ppard and Bmal1 expression in dexamethasone synchronized primary hepatocytes (n=3, each time point). Circadian time: hours after dexamethasone treatment. c. Gene expression in wt and LPPARDKO livers under daytime restricted feeding (n=3, each time point). Red bar: time when food was available. d. Food intake in wt and LPPARDKO mice measured by metabolic cages (n=8). e. GTT and ITT in wt (n=6) and LPPARDKO (n=7) mice. f. Comparison of liver and serum lipidomes. g. Column purification of serum lipids (See methods for detail). IPA: isopropyl alcohol; MeOH: methanol; HOAc: acetic acid. Data were presented as mean±SEM.
Extended Data Figure 3
Extended Data Figure 3. Identification and characterization of PC(18:0/18:1), or SOPC
a. Heat map of identified features in wt and LPPARDKO serum under daytime feeding (n=3, each time point). White bar: light cycle starting at ZT0; Black bar: dark cycle; Red bar: time when food was available. b. Dendrogram of serum samples under daytime restricted feeding. c. Principal component analysis (PCA) of positive mode features in wt, LPPARDKO, Scramble and LACC1KD serum under ad lib feeding. Top: score plot of the first three PCs representing 53.2% of the total variation. Bottom: score plot of PC1 and PC3. Circle: 95% confidence interval. d. Loading plot of the PCA. The putative identities of 11 features identified in Fig. 3d are shown in red. Additional top features contributing to the segregation are highlighted in blue. e. Top panels: EIC of mz=788.6 in wt and LPPARDKO serum. Bottom panels: EIC of mz=788.6 in LACC1KD serum and adPPARδ livers. f. Normalized PC(36:1) intensity in wt and LPPARDKO mouse serum (n=4) under ad libitum or daytime restricted feeding (DF). g. Top: Multiple reaction monitoring (MRM) parameters for identification of acyl-chain composition of PC(36:1). Bottom left: Co-elution of the PC (18:0/18:1) standard with mz=788.6. Bottom right: PC(36:1) acyl-chain composition determined by tandem mass spectrometry running in the MRM mode. h. Top panels: Lipid levels in mice i.p. injected with various doses of PC(18:0/18:1) (n=4). Bottom: In vivo FA uptake in soleus muscle (left) and serum PC(36:1) enrichment (right) 4 hours after PC(18:0/18:1) injection at 5mg/kg body weight. *p<0.05 (t-test), data presented as mean±SEM.
Extended Data Figure 4
Extended Data Figure 4. Requirement of hepatic PPARδ and muscle PPARα for the inter-organ communication mediated by PC(18:0/18:1)/SOPC
a. Cd36 gene expression in muscle of wt and LPPARDKO mice under daytime restricted feeding (n=3, each time point). #p<0.05 (ANOVA). b. Effects of GW501516 on serum TG and muscle FA uptake in wt and LPPARDKO mice (n=5). c. Cd36 and Fabp3 gene expression in C2C12 myotubes treated with vehicle or 25 µM PC(18:0/18:1) (n=3). d. FA uptake in control or stable Cd36 knockdown C2C12 myotubes pretreated with indicated lipids. e. The mammalian one-hybrid assay (diagram shown on the top) to determine the trans-activation activity of the PPAR ligand binding domain (LBD) (n=3). Left panel: Relative luciferase unit (RLU, presented as fold change) indicative of the reporter activity regulated by Gal4 DNA binding domain (DBD)- PPARαLBD fusion protein (Gal4-PPARαLBD) in 293 cells treated with indicated phospholipids at 100 µM. Right panel: RLU of Gal4-PPARδLBD and Gal4-PPARγLBD treated with 100 µM PC(18:0/18:1). f. Heat map showing serum phospholipid changes between ZT20 and ZT8 in 7-month old male C57BL/6J mice on chow (n=3) or high fat diet (HFD for 4 months, n=5) from targeted metabolomics. g. Serum PC(36:1) concentrations under chow or HFD. h. Blood glucose levels of ad lib fed db/db mice measured between ZT0 and ZT3 before daily lipids injections [vehicle: n=4; PC(18:0/18:1): n=5]. i. Model for the role of PPARδ-PC(18:0/18:1)-PPARα signaling in FA synthesis and utilization in the liver-muscle axis. j. Upper panel: In vivo fatty acid uptake in soleus and gastrocnemius muscle 4 hours after vehicle or 5 mg/kg PC(16:0/18:1) injection though the tail vein (n=6); lower panel: muscle Cd36 and Fabp3 gene expression after PC(16:0/18:1) injection (n=4). k. Upper panel: activities of a PPRE-containing luciferase reporter in PPARα-expressing C2C12 cells treated with vehicle, 50 µM PC(18:0/18:1) or PC(16:0/18:1) and 1 µM GW7647 (a PPARα synthetic ligand). Lower panel: Cd36 expression in C2C12 myotubes. *p<0.05, (t-test), data presented as mean±SEM.
Extended Data Figure 5
Extended Data Figure 5. Validation of metabolomics analyses
a. The reproducibility of the untargeted metabolomics platform was validated from two separate runs of 6 serum samples. The Spearman’s rank correlations are between 0.9 and 0.94. The duplicate pair with the lowest correlation (Spearman’s r=0.90) is shown. b. The raw intensity of samples was subject to normalization with median centering and inter-quartile range (IQR) scaling. The resulting data show equal distribution among different groups of samples. White bar represents samples obtained in the light cycle and black bar for those in the dark cycle.
Extended Data Figure 6
Flow chart of metabolomics data analysis (showing the positive mode metabolites; see methods for detailed description).
Figure 1
Figure 1. Hepatic PPARδ and Acc1 are linked to muscle FA utilization
a. Serum TG and FFA levels in adGFP or adPPARδ mice (n=5). b. Ex vivo fatty acid uptake and oxidation in isolated soleus muscle. c. Hepatic TG and serum TG and FFA levels in LACC1KD or control (Scramble) mice (n=5). Inset: Immunoblotting of liver Acc protein. d. Ex vivo fatty acid uptake in isolated soleus muscle. e. In vivo fatty acid uptake in soleus and gastrocnemius muscle. f. Serum 3H-oleic acid disappearance. Inset: 3H-FA clearance. AUC: area under the curve of disappearance. *p<0.05 (t-test), data shown as mean±SEM.
Figure 2
Figure 2. Hepatic PPARδ controls liver lipogenic gene expression and muscle FA uptake
a. Hepatic lipogenic gene expression in wt and LPPARDKO mice (n=4/time point). White and black bars on the x-axis represent light and dark cycles, respectively. b. Liver gene expression under daytime feeding (n=3). #p<0.05 (ANOVA), wt vs. LPPARDKO; +p<0.05, comparing circadian patterns. c. In vivo muscle fatty acid uptake (n=3). d.-f. In vitro fatty acid uptake in C2C12 myotubes treated with serum (2%) pooled from light or dark cycle samples, serum total lipids or delipidated serum (dark cycle samples) or serum lipid fractions (n=3). *p<0.05 (t-test), data shown as mean±SEM.
Figure 3
Figure 3. PC(18:0/18:1) links hepatic PPARδ to serum lipid levels and muscle FA uptake
a. Serum lipid heatmap (n=3/time point). White = light (starting at ZT4) and black = dark cycles. b. Dendrogram from hierarchical clustering. c. Cross-comparison of changed lipids. d. Z-score plots of 14 commonly changed features. e. Serum PC(36:1) quantification in wt (n=5) and LPPARDKO (n=4) mice. f. Serum PC(36:1) concentrations in wt/LPPARDKO ± GW501516 (n=5). g. Serum TG changes (tail vein injection) with PLs in wt mice (n=6). h. FA uptake in C2C12 myotubes treated with PLs (50 µM, n=3). i. Serum TG and FFA levels after PC(18:0/18:1) infusion (n=6, wt C57BL/6J mice). *p<0.05 (t-test), data presented as mean±SEM.
Figure 4
Figure 4. PC(18:0/18:1) regulates muscle FA utilization through PPARα
a. Muscle gene expression. b. Muscle Cd36 protein (upper) and gene (lower, n=4/time) expression. c. Cd36 and Fabp3 expression in wt and LPPARDKO muscle ± GW501516 (n=5). d. Top: Serum TG levels in wt and PPARαKO mice after vehicle or PC(18:0/18:1) infusion (n=6, wt from Fig. 3i). Bottom: In vivo soleus muscle FA uptake. e. Muscle Cd36 and Fabp3 expression in wt and PPARαKO mice. f. FA uptake in C2C12 myotubes (n=3). Top: Ppara knockdown or control; Bottom: wt Ppara or AF2 mutant (AF2m). g-i. Fasting serum lipid concentrations, GTT and ITT, and muscle lipid content in vehicle (n=4) or PC(18:0/18:1) (n=5) treated db/db mice. *p<0.05 (t-test); #p<0.05 (ANOVA); data presented as mean±SEM.

Comment in

Similar articles

Cited by

References

    1. Asher G, Schibler U. Crosstalk between components of circadian and metabolic cycles in mammals. Cell metabolism. 2011;13:125–137. - PubMed
    1. Bass J, Takahashi JS. Circadian integration of metabolism and energetics. Science. 2010;330:1349–1354. - PMC - PubMed
    1. Feng D, et al. A circadian rhythm orchestrated by histone deacetylase 3 controls hepatic lipid metabolism. Science. 2011;331:1315–1319. - PMC - PubMed
    1. Solt LA, et al. Regulation of circadian behaviour and metabolism by synthetic REV-ERB agonists. Nature. 2012;485:62–68. - PMC - PubMed
    1. Cho H, et al. Regulation of circadian behaviour and metabolism by REV-ERB-alpha and REV-ERB-beta. Nature. 2012;485:123–127. - PMC - PubMed

Publication types