. 2013 Oct 24:3:3039.
doi: 10.1038/srep03039.

Cellular network entropy as the energy potential in Waddington's differentiation landscape

Affiliations

Cellular network entropy as the energy potential in Waddington's differentiation landscape

Christopher R S Banerji et al. Sci Rep. .

Abstract

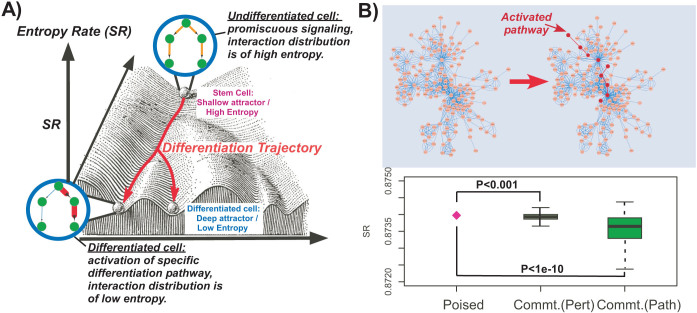
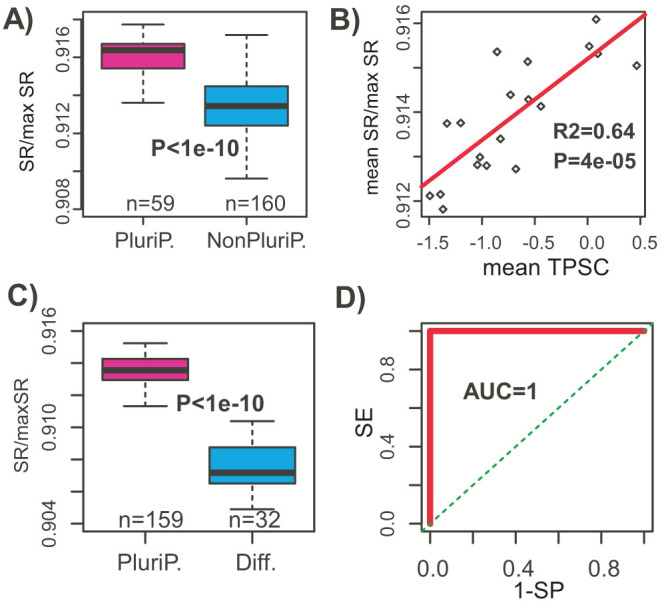
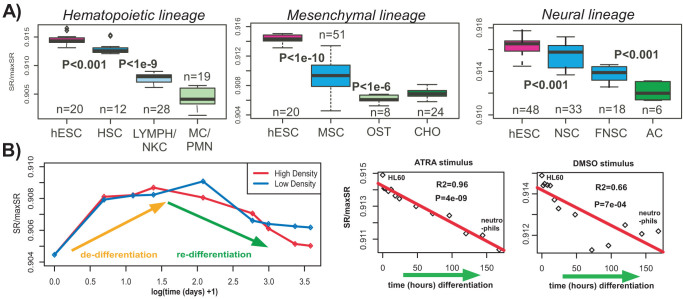
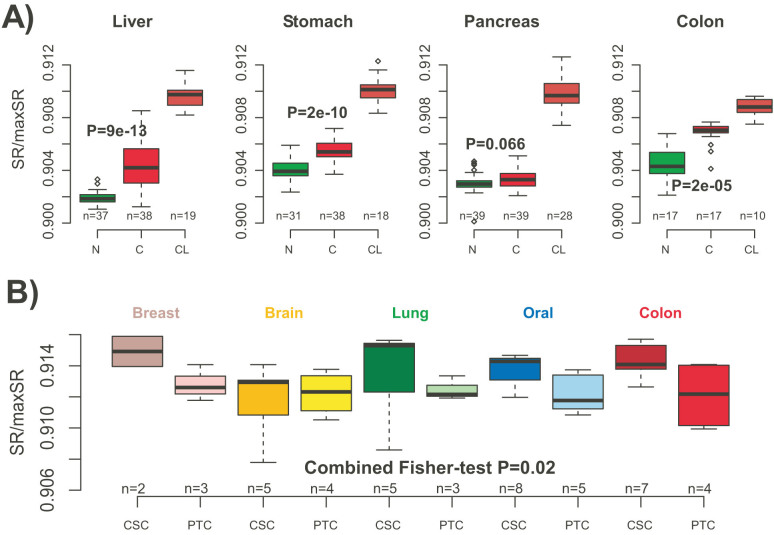
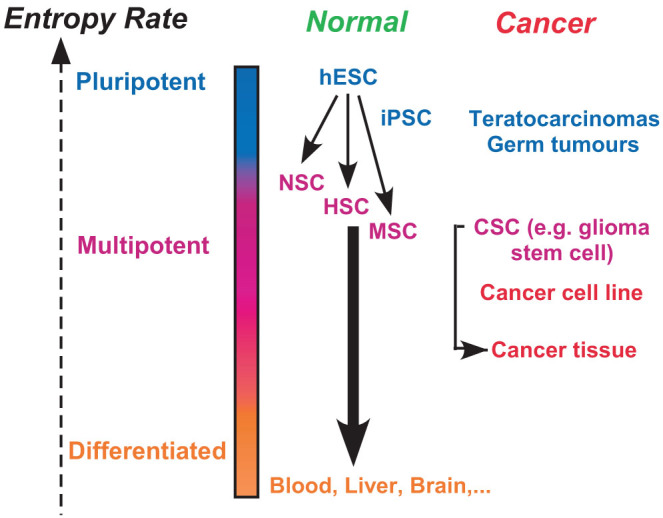
Differentiation is a key cellular process in normal tissue development that is significantly altered in cancer. Although molecular signatures characterising pluripotency and multipotency exist, there is, as yet, no single quantitative mark of a cellular sample's position in the global differentiation hierarchy. Here we adopt a systems view and consider the sample's network entropy, a measure of signaling pathway promiscuity, computable from a sample's genome-wide expression profile. We demonstrate that network entropy provides a quantitative, in-silico, readout of the average undifferentiated state of the profiled cells, recapitulating the known hierarchy of pluripotent, multipotent and differentiated cell types. Network entropy further exhibits dynamic changes in time course differentiation data, and in line with a sample's differentiation stage. In disease, network entropy predicts a higher level of cellular plasticity in cancer stem cell populations compared to ordinary cancer cells. Importantly, network entropy also allows identification of key differentiation pathways. Our results are consistent with the view that pluripotency is a statistical property defined at the cellular population level, correlating with intra-sample heterogeneity, and driven by the degree of signaling promiscuity in cells. In summary, network entropy provides a quantitative measure of a cell's undifferentiated state, defining its elevation in Waddington's landscape.


Figures

Figure 1
Figure 1. Network entropy as the energy potential in Waddington's landscape.
(A) Illustration of network entropy's role in cellular differentiation. The z-axis represents the network entropy rate (SR) of a cell, which is a measure of the promiscuity/redundancy in the signaling patterns within the cell. The two-dimensional plane spanned by the x-and-y axis represents gene expression state/phase space. We model a cell in a pluripotent stem-cell like state as being in a corresponding shallow attractor in phase space, characterised by increased signaling promiscuity (high network entropy), thus allowing each cell in the population to explore more freely the underlying phase space, resulting in a high cellular diversity. In contrast, a terminally differentiated cell is defined by activation of specific signaling pathway(s), corresponding to less uncertainty in how signals flow in the network (a state of low entropy). Cells in this state are in deep attractors and cellular diversity at the population level is low. (B) Simulation of pathway activation in a realistic protein interaction network (only a small subnetwork is shown). In the left, edge weights are defined equally, so that the random walk on the network is unbiased. On the right, a specific pathway is activated by increasing the relative weights of edges connecting the genes in the pathway (shown in dark red). Lower panel compares the entropy rate (SR) of the unbiased state, representing a highly promiscuous poised cellular state (magenta diamond), to the entropy rates obtained by separately activating each individual gene in the network (> 1000 perturbations, “Commt(Pert.)”), and to the entropy rates obtained by activating whole signal transduction pathways (100 pathways, “Commt.(Path)”). Binomial test P-values are given.
Figure 2
Figure 2. Network entropy correlates with pluripotency.
(A) Normalised entropy rates (SR/maxSR, y-axis) between the 59 pluripotent and 160 non-pluripotent cell-lines from the SCM compendium (219 samples). P-value is from a Wilcoxon rank sum test. (B) Scatterplot of the entropy rate vs pluripotency score, where values for replicates of each cell type have been averaged. Linear regression P-value and R2 value are given. (C) Normalised entropy rates (SR/maxSR, y-axis) between the 159 pluripotent and 32 differentiated samples from the SCM2. P-value is from a Wilcoxon rank sum test. (D) Corresponding ROC curve plus AUC of network entropy discriminating pluripotent from differentiated cells.
Figure 3
Figure 3. Network entropy marks differentiation potential.
(A) Multi-lineage analysis: Left panel: Comparison of normalised network entropy values of hESCs, hematopoietic stem cells (HSCs), T & B-cell lymphocytes plus natural killer cells (LYMPH/NKC), and monocytes plus neutrophils (MC/PMN). Middle panel: Comparison of normalised network entropy values of hESCs, mesenchyma stem cells (MSCs) and differentiated osteoblasts (OST) and chondrocytes (CHO). Right panel: Comparison of normalised network entropy values of hESCs, neural stem cells (NSCs) derived from the hESCs, fetal neural stem cells (FNSC) and primary astrocytes (AC), as derived from the SCM compendium (Illumina arrays). Wilcoxon rank sum test P-values between consecutive groups in the differentiation hierarchy are given. (B) Dynamic changes in network entropy: Left panel: Network entropy changes in a time course de-differentiation and re-differentiation experiment of retinal pigment epithelium (RPE), with cell density indicating the initial plating density of RPE cells. Right panels: Network entropy rate (SR/maxSR, y-axis) changes of HL60 leukemic progenitor cells against time from initial stimulus with either ATRA or DMSO. The data points on the left indicate the less differentiated HL60 cells, whereas the ones on the far right represent differentiated neutrophils. We provide the R2 values and associated P-values from a linear regression.
Figure 4
Figure 4. Network entropy discriminates cancer stem cells, cancer and normal tissue.
(A) Comparison of normalised entropy rates (SR/maxSR) between normal and cancer tissue, as well as cancer cell lines, across four different tissue types, as indicated. (B) Comparison of normalised entropy rates between putative cancer stem cells (CSC) and their parental tumour cell lines (PTC) for five different tissue types. Combined Fisher t-test P-value is given.
Figure 5
Figure 5. Network entropy rates between major cell types in normal and cancer physiology.
Network entropy correlates with pluripotency and anticorrelates with the differentiation stage of cells. hESC: human embryonic stem cell, iPSC: induced pluripotent stem cell, MSC: mesenchymal stem cell, HSC: hematopoietic stem cell, NSC: neural stem cell, CSC: cancer stem cell.

References

    1. Keller G. Embryonic stem cell differentiation: emergence of a new era in biology and medicine. Genes Dev 19, 1129–1155 (2005). - PubMed
    1. Zhou J. X., Brusch L. & Huang S. Predicting pancreas cell fate decisions and reprogramming with a hierarchical multi-attractor model. PLoS One 6, e14752 (2011). - PMC - PubMed
    1. Zhou J. X. & Huang S. Understanding gene circuits at cell-fate branch points for rational cell reprogramming. Trends Genet 27, 55–62 (2011). - PubMed
    1. Ladewig J., Koch P. & Bruestle O. Leveling waddington: the emergence of direct programming and the loss of cell fate hierarchies. Nat Rev Mol Cell Biol 14, 225–236 (2013). - PubMed
    1. Heinaniemi M. et al. Gene-pair expression signatures reveal lineage control. Nat Methods 10, 577–583 (2013). - PMC - PubMed

Publication types