

Quantitative susceptibility mapping of kidney inflammation and fibrosis in type 1 angiotensin receptor-deficient mice
- PMID: 24154952
- PMCID: PMC3956055
- DOI: 10.1002/nbm.3039
Quantitative susceptibility mapping of kidney inflammation and fibrosis in type 1 angiotensin receptor-deficient mice
Abstract
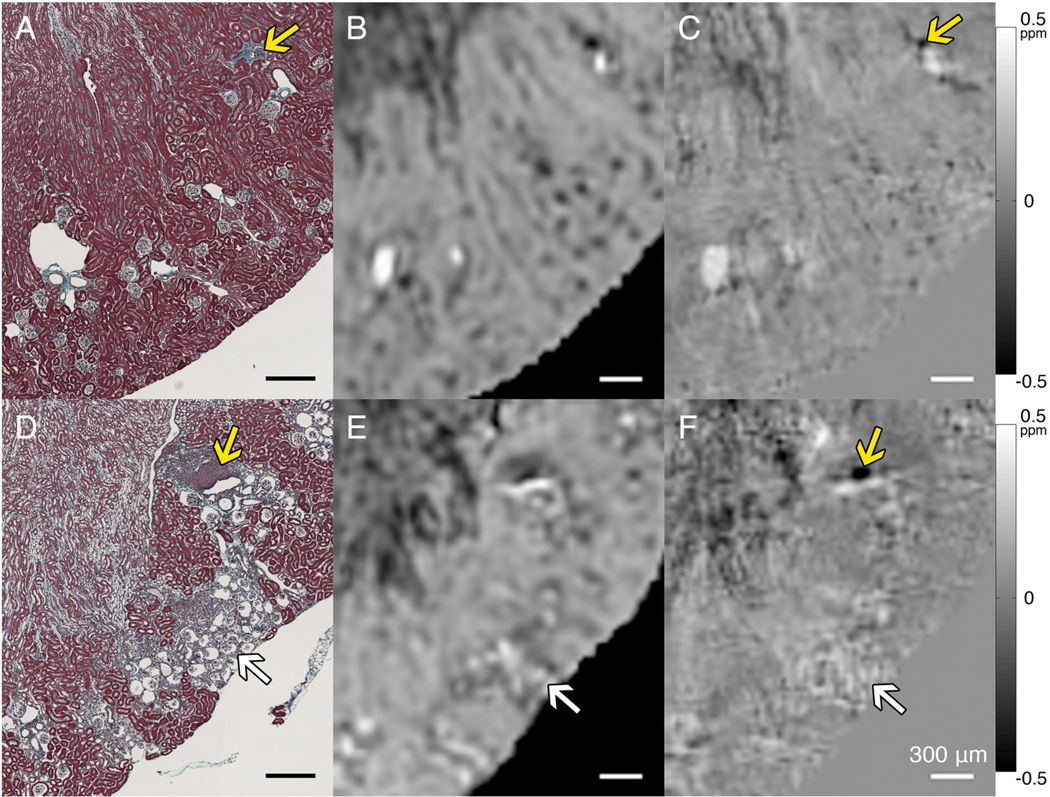
Disruption of the regulatory role of the kidneys leads to diverse renal pathologies; one major hallmark is inflammation and fibrosis. Conventional magnitude MRI has been used to study renal pathologies; however, the quantification or even detection of focal lesions caused by inflammation and fibrosis is challenging. We propose that quantitative susceptibility mapping (QSM) may be particularly sensitive for the identification of inflammation and fibrosis. In this study, we applied QSM in a mouse model deficient for angiotensin receptor type 1 (AT1). This model is known for graded pathologies, including focal interstitial fibrosis, cortical inflammation, glomerulocysts and inner medullary hypoplasia. We acquired high-resolution MRI on kidneys from AT1-deficient mice that were perfusion fixed with contrast agent. Two MR sequences were used (three-dimensional spin echo and gradient echo) to produce three image contrasts: T1, T2* (magnitude) and QSM. T1 and T2* (magnitude) images were acquired to segment major renal structures and to provide landmarks for the focal lesions of inflammation and fibrosis in the three-dimensional space. The volumes of major renal structures were measured to determine the relationship of the volumes to the degree of renal abnormalities and magnetic susceptibility values. Focal lesions were segmented from QSM images and were found to be closely associated with the major vessels. Susceptibilities were relatively more paramagnetic in wild-type mice: 1.46 ± 0.36 in the cortex, 2.14 ± 0.94 in the outer medulla and 2.10 ± 2.80 in the inner medulla (10(-2) ppm). Susceptibilities were more diamagnetic in knockout mice: -7.68 ± 4.22 in the cortex, -11.46 ± 2.13 in the outer medulla and -7.57 ± 5.58 in the inner medulla (10(-2) ppm). This result was consistent with the increase in diamagnetic content, e.g. proteins and lipids, associated with inflammation and fibrosis. Focal lesions were validated with conventional histology. QSM was very sensitive in detecting pathology caused by small focal inflammation and fibrosis. QSM offers a new MR contrast mechanism to study this common disease marker in the kidney.
Keywords: AT1; fibrosis; inflammation; magnetic susceptibility; pathology; quantitative susceptibility mapping; renal structures; small animal preclinical imaging.
Copyright © 2013 John Wiley & Sons, Ltd.
Figures


Similar articles
-
Dynamic contrast-enhanced quantitative susceptibility mapping with ultrashort echo time MRI for evaluating renal function.Am J Physiol Renal Physiol. 2016 Jan 15;310(2):F174-82. doi: 10.1152/ajprenal.00351.2015. Epub 2015 Oct 7. Am J Physiol Renal Physiol. 2016. PMID: 26447222 Free PMC article.
-
Evaluating the Potential of Quantitative Susceptibility Mapping for Detecting Iron Deposition of Renal Fibrosis in a Rabbit Model.J Magn Reson Imaging. 2025 Jun;61(6):2558-2569. doi: 10.1002/jmri.29722. Epub 2025 Jan 28. J Magn Reson Imaging. 2025. PMID: 39874142
-
T2 relaxation time and apparent diffusion coefficient for noninvasive assessment of renal pathology after acute kidney injury in mice: comparison with histopathology.Invest Radiol. 2013 Dec;48(12):834-42. doi: 10.1097/RLI.0b013e31829d0414. Invest Radiol. 2013. PMID: 23907103
-
Clinical quantitative susceptibility mapping (QSM): Biometal imaging and its emerging roles in patient care.J Magn Reson Imaging. 2017 Oct;46(4):951-971. doi: 10.1002/jmri.25693. Epub 2017 Mar 10. J Magn Reson Imaging. 2017. PMID: 28295954 Free PMC article. Review.
-
Quantitative Susceptibility Mapping: Concepts and Applications.Clin Neuroradiol. 2015 Oct;25 Suppl 2:225-30. doi: 10.1007/s00062-015-0432-9. Epub 2015 Jul 22. Clin Neuroradiol. 2015. PMID: 26198880 Review.
Cited by
-
Dynamic contrast-enhanced quantitative susceptibility mapping with ultrashort echo time MRI for evaluating renal function.Am J Physiol Renal Physiol. 2016 Jan 15;310(2):F174-82. doi: 10.1152/ajprenal.00351.2015. Epub 2015 Oct 7. Am J Physiol Renal Physiol. 2016. PMID: 26447222 Free PMC article.
-
Meibomian gland lipid alterations and ocular surface sequela in Awat2 knockout murine model of meibomian gland dysfunction and evaporative dry eye disease.Ocul Surf. 2024 Oct;34:489-503. doi: 10.1016/j.jtos.2024.10.003. Epub 2024 Oct 15. Ocul Surf. 2024. PMID: 39414024 Free PMC article.
-
Quantitative susceptibility mapping: Report from the 2016 reconstruction challenge.Magn Reson Med. 2018 Mar;79(3):1661-1673. doi: 10.1002/mrm.26830. Epub 2017 Jul 31. Magn Reson Med. 2018. PMID: 28762243 Free PMC article.
-
Current MRI techniques for the assessment of renal disease.Curr Opin Nephrol Hypertens. 2015 May;24(3):217-23. doi: 10.1097/MNH.0000000000000122. Curr Opin Nephrol Hypertens. 2015. PMID: 26066472 Free PMC article. Review.
-
QSM Throughout the Body.J Magn Reson Imaging. 2023 Jun;57(6):1621-1640. doi: 10.1002/jmri.28624. Epub 2023 Feb 7. J Magn Reson Imaging. 2023. PMID: 36748806 Free PMC article. Review.
References
-
- Nangaku M. Chronic hypoxia and tubulointerstitial injury: a final common pathway to end-stage renal failure. J. Am. Soc. Nephrol. 2006;17:17–25. - PubMed
-
- Bae KT, Grantham JJ. Imaging for the prognosis of autosomal dominant polycystic kidney disease. Nat. Rev. Nephrol. 2010;6:96–106. - PubMed
-
- Herget-Rosenthal S. Imaging techniques in the management of chronic kidney disease: current developments and future perspectives. Semin. Nephrol. 2011;31:283–290. - PubMed
-
- Pedrosa I, Alsop DC, Rofsky NM. Magnetic resonance imaging as a biomarker in renal cell carcinoma. Cancer. 2009;115:2334–2345. - PubMed
Publication types
MeSH terms
Substances
Grants and funding
LinkOut - more resources
Full Text Sources
Other Literature Sources
Molecular Biology Databases
Research Materials
