. 2014 Feb;74(2):187-200.
doi: 10.1002/pros.22740. Epub 2013 Oct 24.

Enrichment of human prostate cancer cells with tumor initiating properties in mouse and zebrafish xenografts by differential adhesion

Affiliations

Enrichment of human prostate cancer cells with tumor initiating properties in mouse and zebrafish xenografts by differential adhesion

Nitu Bansal et al. Prostate. 2014 Feb.

Abstract

Background: Prostate tumor-initiating cells (TICs) have intrinsic resistance to current therapies. TICs are commonly isolated by cell sorting or dye exclusion, however, isolating TICs from limited primary prostate cancer (PCa) tissues is inherently inefficient. We adapted the collagen adherence feature to develop a combined immunophenotypic and time-of-adherence assay to identify human prostate TICs.

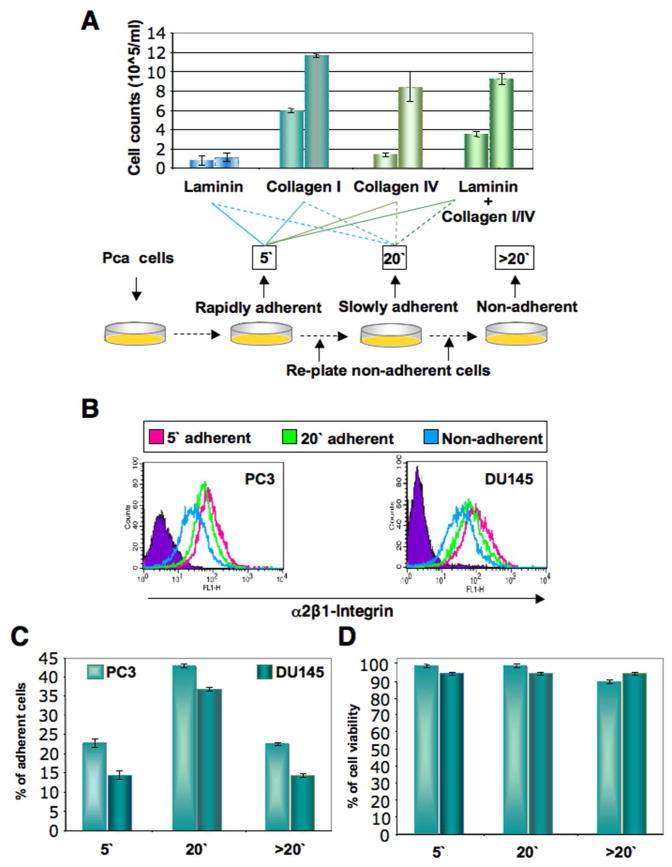
Methods: PCa cells from multiple cell lines and primary tissues were allowed to adhere to several matrix molecules, and fractions of adherent cells were examined for their TIC properties.

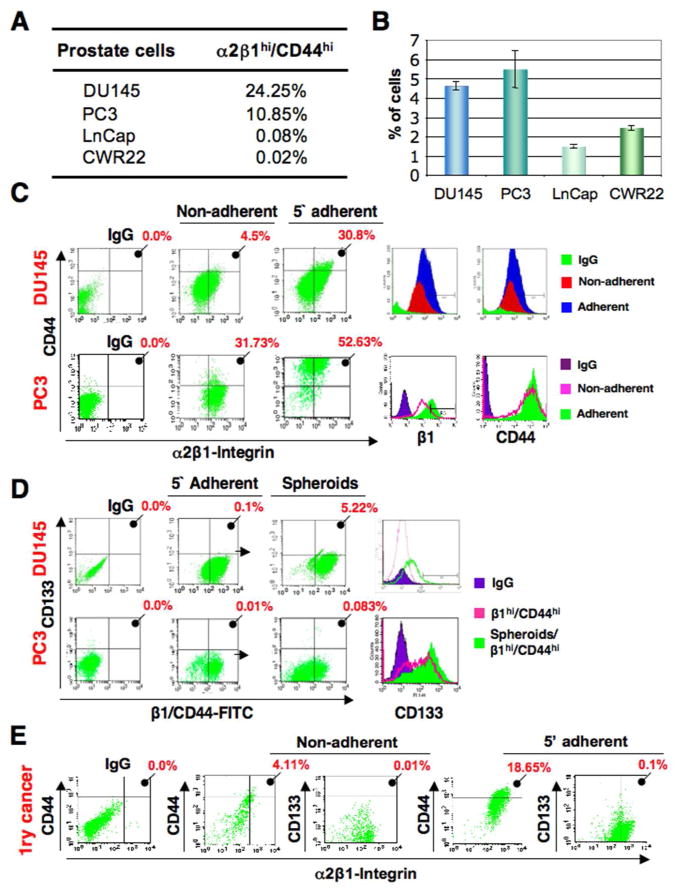
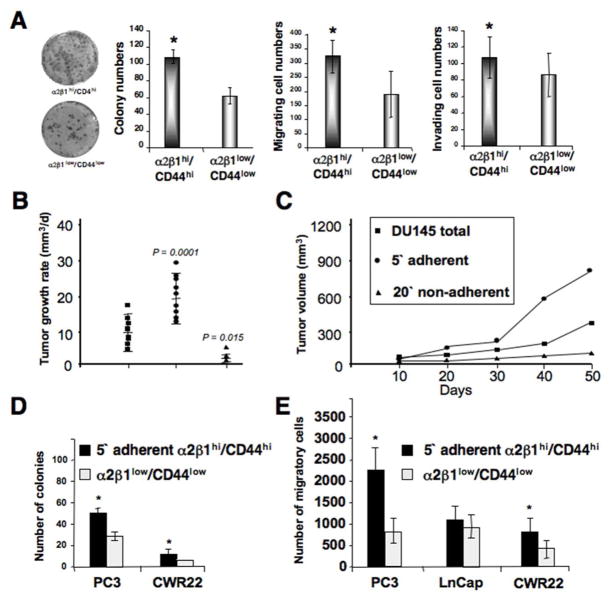
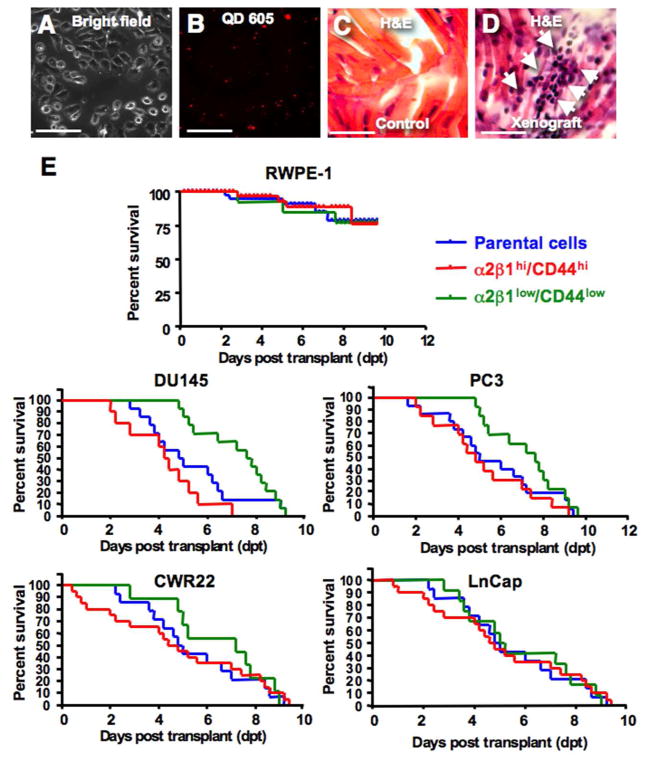
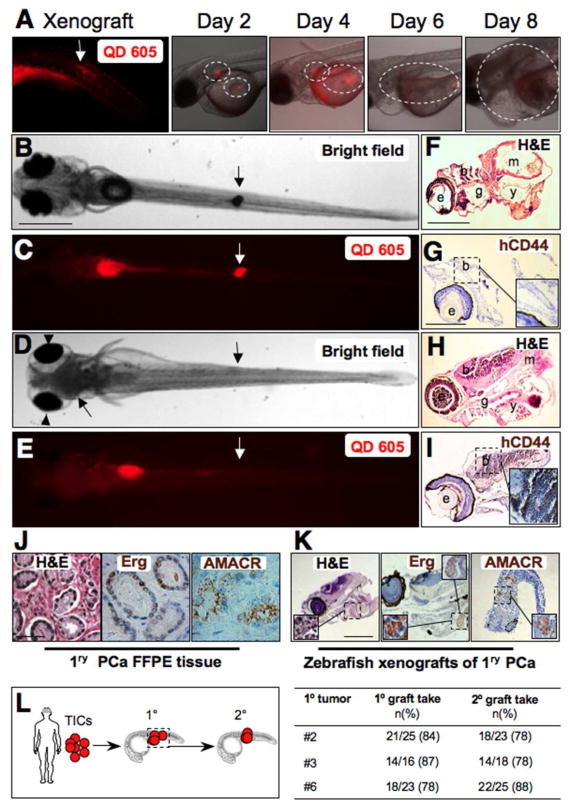
Results: Collagen I rapidly-adherent PCa cells have significantly higher clonogenic, migration, and invasion abilities, and initiated more tumor xenografts in mice when compared to slowly-adherent and no-adherent cells. To determine the relative frequency of TICs among PCa cell lines and primary PCa cells, we utilized zebrafish xenografts to define the tumor initiation potential of serial dilutions of rapidly-adherent α2β1(hi) /CD44(hi) cells compared to non-adherent cells with α2β1(low) /CD44(low) phenotype. Tumor initiation from rapidly-adherent α2β1(hi) /CD44(hi) TICs harboring the TMPRSS2:ERG fusion generated xenografts comprising of PCa cells expressing Erg, AMACR, and PSA. Moreover, PCa-cell dissemination was consistently observed in the immune-permissive zebrafish microenvironment from as-few-as 3 rapidly-adherent α2β1(hi) /CD44(hi) cells. In zebrafish xenografts, self-renewing prostate TICs comprise 0.02-0.9% of PC3 cells, 0.3-1.3% of DU145 cells, and 0.22-14.3% of primary prostate adenocarcinomas.

Conclusion: Zebrafish PCa xenografts were used to determine that the frequency of prostate TICs varies among PCa cell lines and primary PCa tissues. These data support a paradigm of utilizing zebrafish xenografts to evaluate novel therapies targeting TICs in prostate cancer.

Keywords: prostate cancer stem cells; tumor-initiating cells; zebrafish.


Conflict of interest statement

All authors declare no competing interest.

Figures

Fig 1
Fig 1
Isolation of subpopulations of prostate cancer cells by differential adherence. A: Multiple prostate cancer cell lines were allowed to adhere to either laminin-, collagen I-, collagen IV-coated plates, or plates coated with all three combinations. Time of adherence assay is described where PCa cells are allowed to adhere for 5 minutes, the rapidly adherent cells after 5 min (5′) are collected, the remaining of the cells are replated for 20 min, the cells that adhere at 20 min (20′) are collected, and the cells that did not adhere (>20′) are labeled as non-adherent cells. Data are shown for DU145 cells from six separate adhesion experiments. B: Fractions of PC3 and DU145 cells collected after time-of-adherence assay were subjected to flow cytometric analysis of α2β1-integrin expression. Representative flow cytometric analysis is shown for PC3 and DU145 cells. C: Percentages of collagen-I adherent and non-adherent PC3 and DU145 cells immediately after collagen adherence assay. D: Cell viability of collagen-I adherent and non-adherent PC3 and DU145 cells immediately after the collagen adherence assay were similar to cell viabilities of adherent and non-adherent cells immediately after cell isolation, and averaged 95–99.9%.
Fig 2
Fig 2
Collagen-adherent cells are enriched in putative TICs. A: Mean percentage of cells with α2β1hi/CD44hi phenotype in PCa cell lines. B: Time-of-adherence assay performed on multiple PCa cell lines displaying the 5-min adherent cell fraction as a percentage of total cells. Data represent three independent experiments performed in triplicates. C: Flow cytometric analyses of DU145 and PC3 cells after collagen adherence showing both increased expression of CD44 and CD133 in the 5-min (5′) adherent cells compared to the 20 minutes (20′) non-adherent cells, and higher mean fluorescence intensity (MFI) of 5 minutes collagen-I-adherent (α2β1hi/CD44hi) cells (Adherent) compared to 20 min-non-adherent (α2β1low/CD44low) cells (Non-adherent), and IgG control (IgG). D: CD133 expression in various subsets of DU145 and PC3 cells. In a representative experiment, α2β1hi/CD44hi (pink) showed 0.1% and 0.01% of the cells positive for CD133 from DU145 and PC3 cells respectively, and spheroids from these α2β1hi/CD44hi cells (green) showed upregulated CD133 levels up to 5.22% in DU145 cells and 0.083% in PC3 cells (P< 0.001 for both cell lines in three independent experiments). E: Primary prostate cancer cells have increased expression of CD44 and CD133 in the 5-min adherent cells compared to the 20 min-non-adherent cells. Mean percentages from analyses of six cases are displayed. Higher expression of α2β1/CD44 and upregulation of CD133 when cells are grown as spheres were detected in the 5-min adherent cells compared to the 20 minutes non-adherent cells, and were seen with all six patient samples examined.
Fig 3
Fig 3
Tumorigenic potential of collagen-adherent α2β1hi/CD44hi cells. A: The two fractions of α2β1hi/CD44hi cells and α2β1low/CD44low cells isolated after collagen adherence were assessed in colony forming efficiency assays. Images on the left demonstrate colonies derived from both fractions stained with crystal violet. Numbers of spheroid colonies, migrating, and invading cells are displayed as mean ± SD, and were done in triplicates. Self-renewal and in vitro tumorigenic potential of collagen-adherent α2β1hi/CD44hi DU145 cells are shown. Bars demonstrate the enhanced clonogenic ability of α2β1hi/CD44hi cells compared to α2β1low/CD44low cells. The two fractions of α2β1hi/CD44hi cells and α2β1low/CD44low DU145 cells isolated after collagen adherence were assessed for numbers of migrating cells. Data are displayed as mean ± SD, and were done in triplicates (*p<0.001). B: Both flanks of athymic nude (NCInu/nu) mice were injected with either total DU145 cells (ν), 5 min-adherent cells (λ), or 20 min-non-adherent cells (σ) (n=60 mice). Mean tumor growth rates are presented as mm3/day ± SD. C: The mean tumor volume was plotted as a function of time using the ellipsoid volume formula (length x width2 x 1/2), assuming π = 3. P values shown are compared with total DU145 tumors. D–E: Self-renewal and in vitro tumorigenic potential of collagen-adherent α2β1hi/CD44hi PC3, LnCap and CWR22 PCa cells. D: Bars demonstrate the enhanced clonogenic ability of α2β1 hi/CD44hi cells compared to α2β1low/CD44low PC3 and CWR22 cells. E: The two fractions of α2β1hi/CD44hi cells and α2β1low/CD44low PC3, LnCap and CWR22 cells isolated after collagen adherence were assessed for numbers of migrating cells. Data are displayed as mean ± SD, and were done in triplicates (*p<0.001).
Fig. 4
Fig. 4
Zebrafish xenografts of human prostate cancer cells. AD: Bright filed image in (A), and the corresponding red (605) fluorescent image in (B) demonstrating efficient labeling of DU145 cells with quantum dots-605 (QD) in nearly all the cells in the field. CD: Histological H&E sections from a control non-transplanted zebrafish muscle tissues in (C), compared to a muscle section from DU145 TICs transplanted fish in (D). Section demonstrates tumor infiltrates with cells resembling morphology of DU145 cells in fish tissues. Scale bar is 100 μM in (AD). E: Kaplan Meier survival curve of embryos transplanted with normal prostate cells and multiple PCa cells lines using three fractions; parental (blue), 5′ adherent α2β1hi/CD44hi cells (TICs) (red), and 20-min non-adherent α2β1low/CD44low (green) cells. Embryos transplanted with cancer cells had significantly shorter survival rates compared to normal prostate cells due to the rapid development of disseminated tumors. The TICs fraction induced significantly higher mortality rates from tumor growth with DU145, PC3 and CWR22 but not LnCap cells when compared to parental and non-TICs transplants.
Fig. 5
Fig. 5
Prostate cancer xenograft tumor progression in zebrafish. A: QD 605 red fluorescent image of the site of injection on the left taken on the same day of transplanting primary PCa cells SC in zebrafish embryos. Red and bright image overlays represent sequential imaging of the same xenograft embryo over time during 8 days of tumor growth. From day 2, notice the two sites that are outlined with tumor cells labeled with QD. Tumor growth increases progressively while fluorescence decreases due to QD dilution with cell division. BE: Sections from control and PCa xenografts with brain metastasis (DE). Images were taken at 9 dpt. Downward arrows indicate the site of SC transplantation. Upward arrows in D and E on the left indicate cell masses invading the brain and causing exophthalmus (arrowheads in D, compare with no brain metastasis in B). FK, H&E staining (F and H) and IHC with anti-human CD44 (G and I) in a representative control untransplanted embryo (FG) compared to histological sections from a representative xenotransplanted embryo (HI) with brain metastasis stained with H&E (H) and IHC staining of the same brain region containing disseminated human cells identified with the human isoform-specific anti-CD44 antibody (Insert) (H,I). Letters indicate e, eye; b, brain; m, muscle; y, yolk. Inserts in panels G and I are higher magnification of the outlined brain areas, respectively. J: Formalin fixed paraffin embedded (FFPE) sections from a representative primary prostate cancer (PCa) tissue used that are stained with H&E, or in IHC with either Erg or AMACR in brown. The H&E image in J is a higher magnification of the outlined areas in supplementary Fig. 4C, while The Erg and AMACR images in J are higher magnifications of the outlined areas in supplementary Fig. 6H and 5F, respectively. K: Sections from zebrafish embryo with PCa xenograft using cells from tissues shown in Fig. 5K and stained with H&E, and IHC for Erg and AMACR. Inserts are higher magnification of the outlined area in K. L: Diagram demonstrating strategy to study tumor initiation potential of primary PCa cell grafts in secondary xenografts. TICs from the 5-min adherent α2β1hi/CD44hi cells of three patient samples #4, #5, and #6 were transplanted to generate primary xenografts (1°). Xenograft tumor areas were dissected, pooled, and TICs were sorted and injected into secondary recipients. Table on the right demonstrates primary and secondary graft take rates. Scale bars are 100 μm in BE, FJ, and NK.

Similar articles

Cited by

References

    1. Isaacs JT. In: Control of cell proliferation and cell deathin the normal and neoplastic prostate: A stem cell model. Rodgers CHCD, Cunha G, Grayhack JT, Hinman F Jr, Horton R, editors. Washington DC: US Department of Health and Human Services; 1987.
    1. Isaacs JT, Kyprianou N. Biological basis for chemohormonal therapy for prostatic cancer. Cancer Treat Res. 1989;46:177–193. - PubMed
    1. Collins AT, Berry PA, Hyde C, Stower MJ, Maitland NJ. Prospective identification of tumorigenic prostate cancer stem cells. Cancer Res. 2005;65(23):10946–10951. - PubMed
    1. Dick JE. Stem cell concepts renew cancer research. Blood. 2008;112(13):4793–4807. - PubMed
    1. Chen J, Li Y, Yu TS, McKay RM, Burns DK, Kernie SG, Parada LF. A restricted cell population propagates glioblastoma growth after chemotherapy. Nature. 2012;488(7412):522–526. - PMC - PubMed

Publication types

MeSH terms