. 2013 Oct 23;33(43):16897-914.
doi: 10.1523/JNEUROSCI.1871-13.2013.

Soluble guanylate cyclase generation of cGMP regulates migration of MGE neurons

Affiliations

Soluble guanylate cyclase generation of cGMP regulates migration of MGE neurons

Shyamali Mandal et al. J Neurosci. .

Abstract

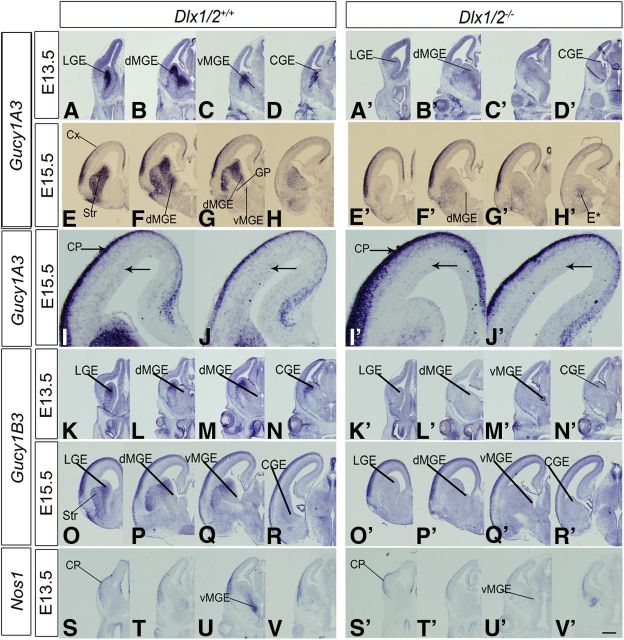
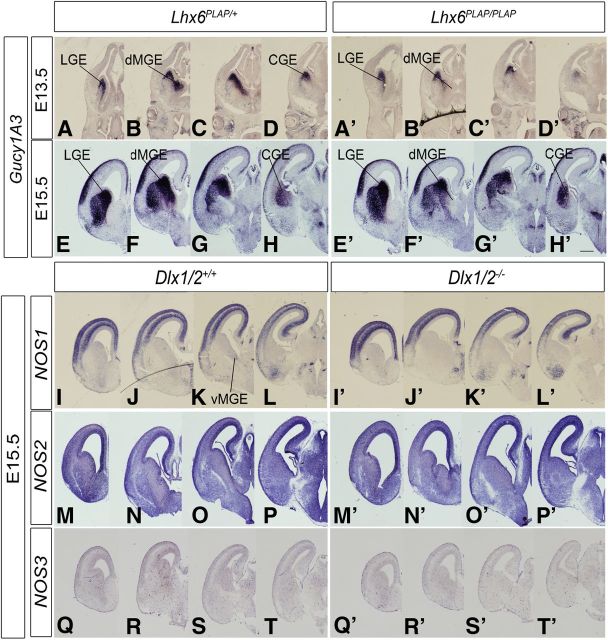
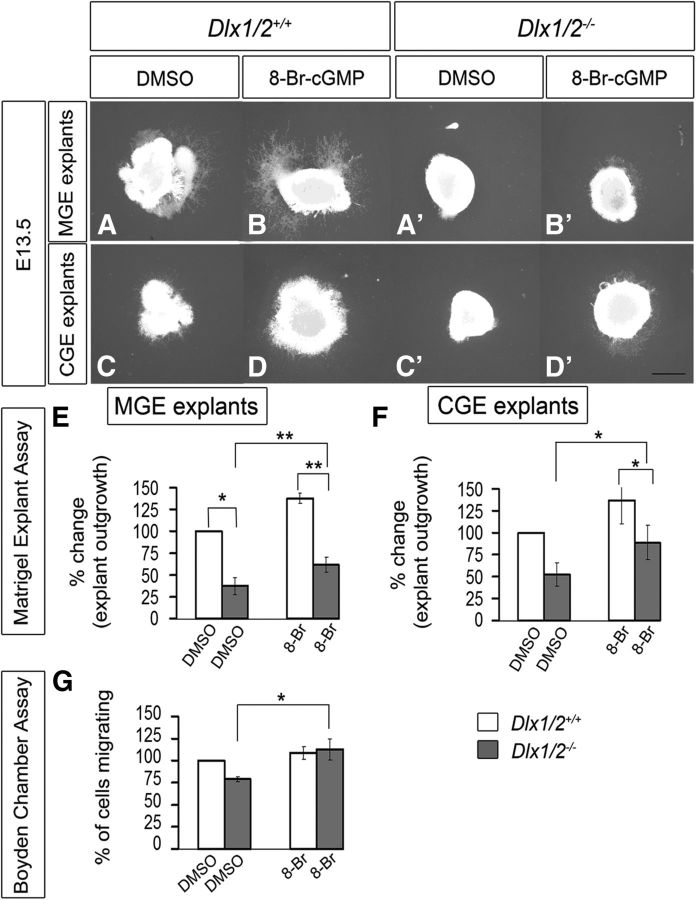
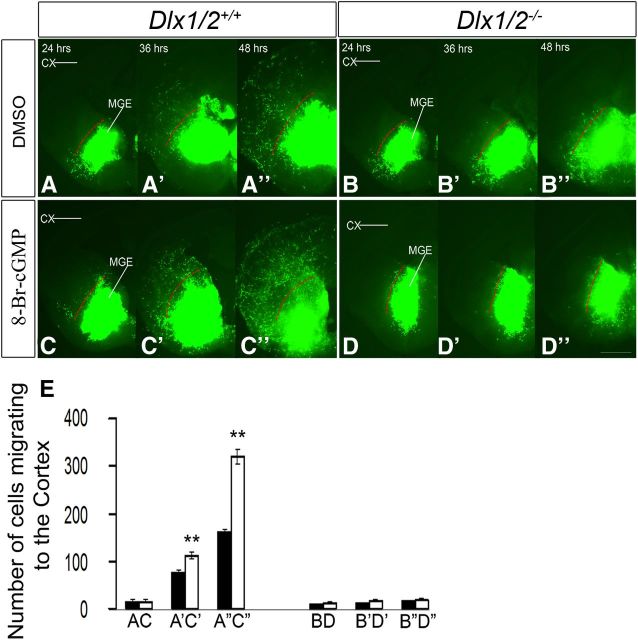
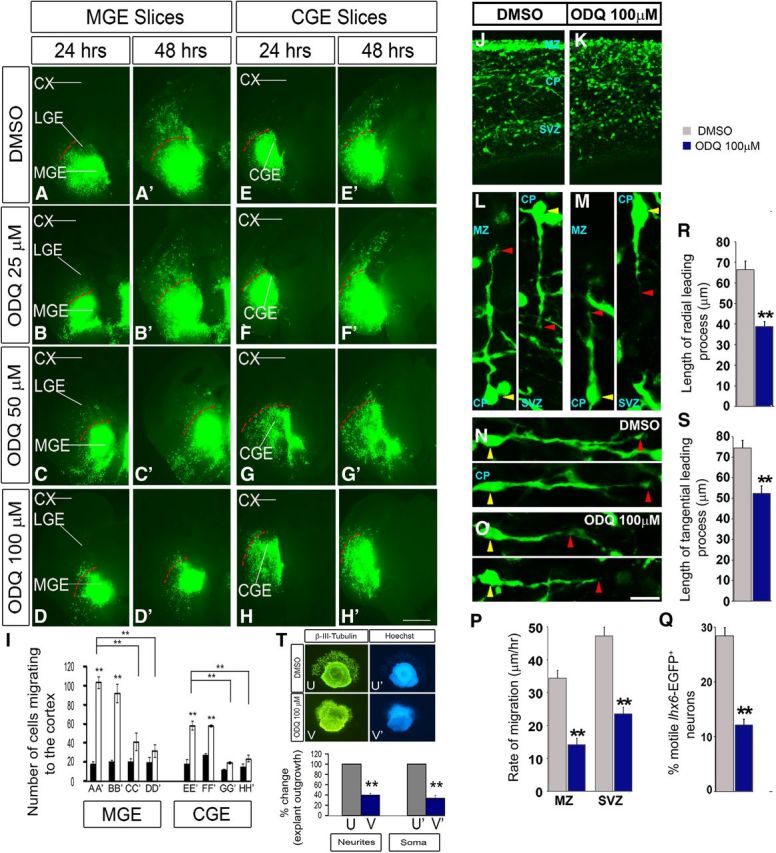
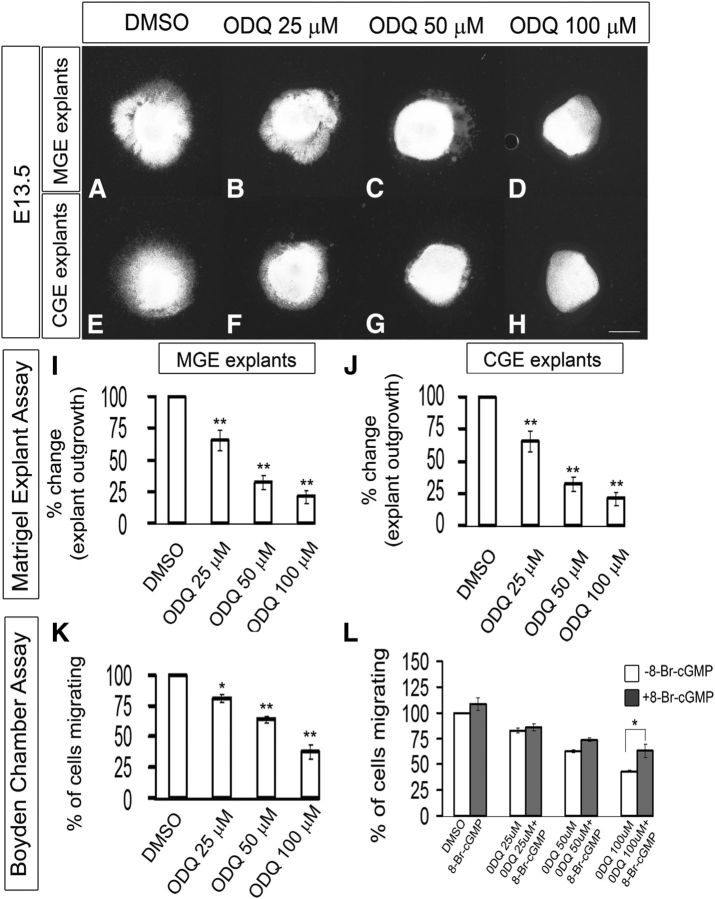
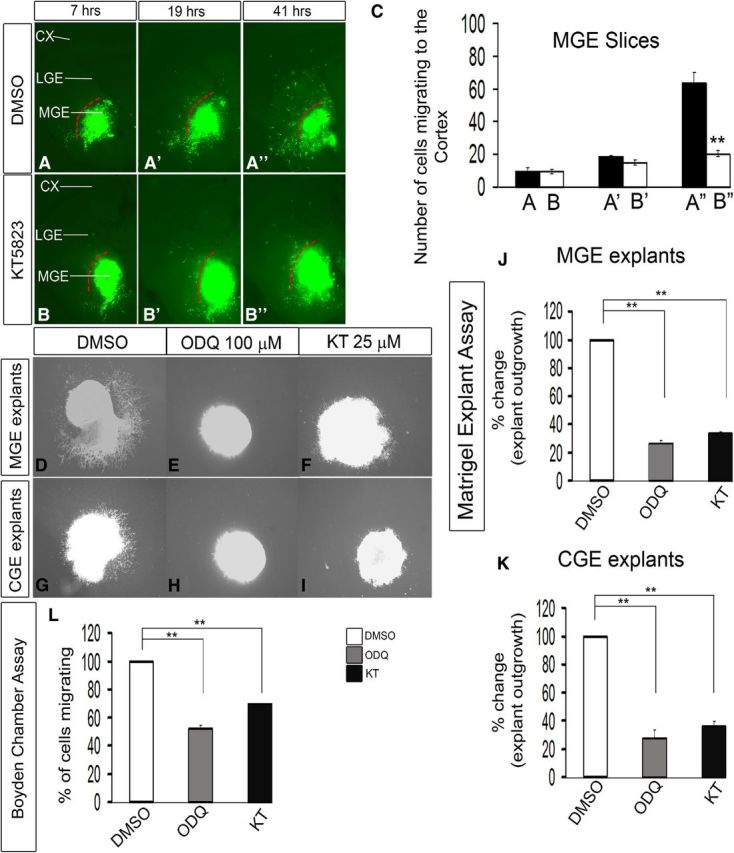
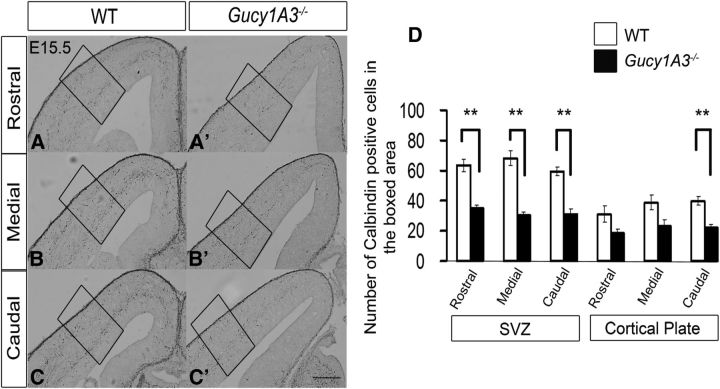
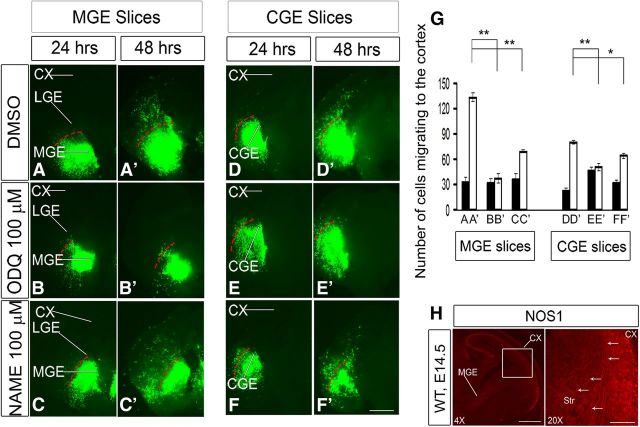
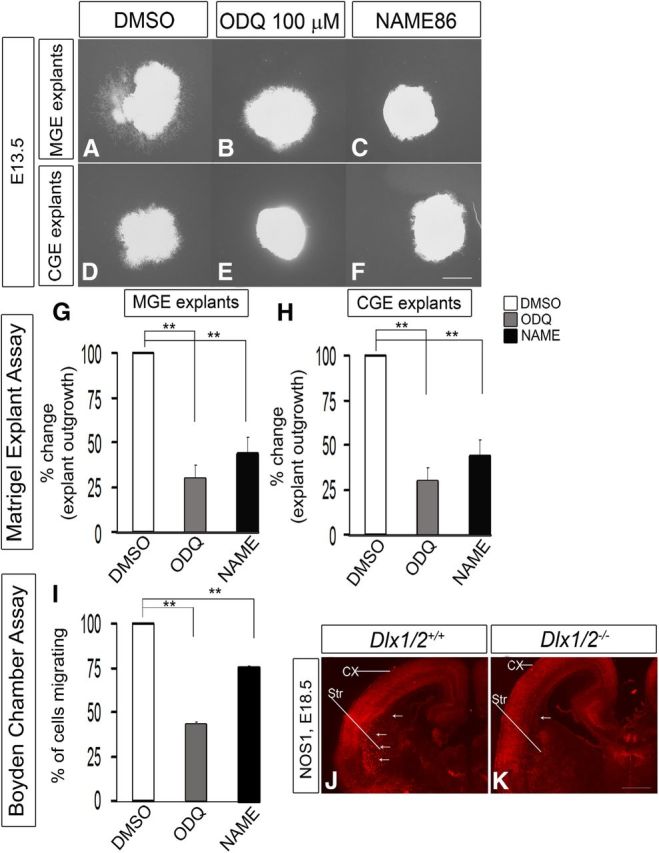
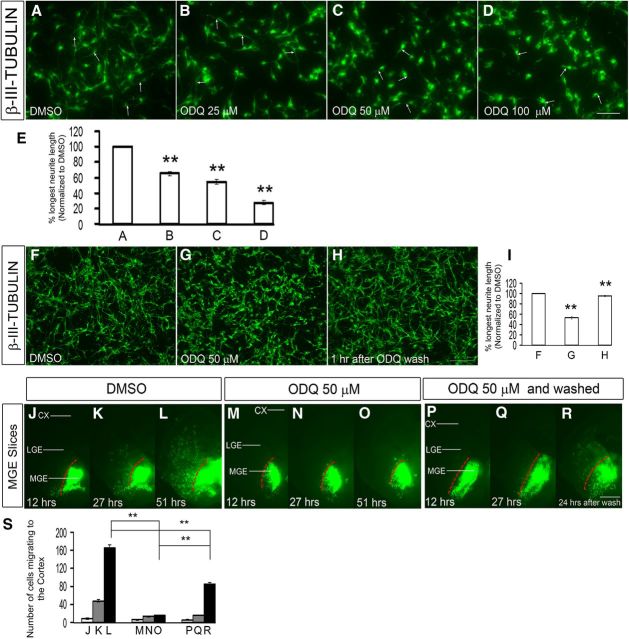
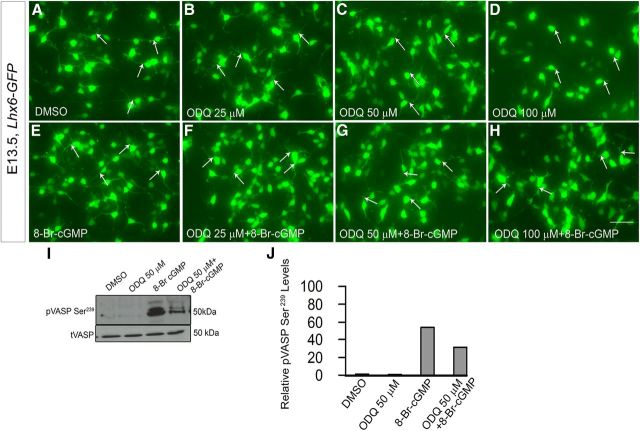
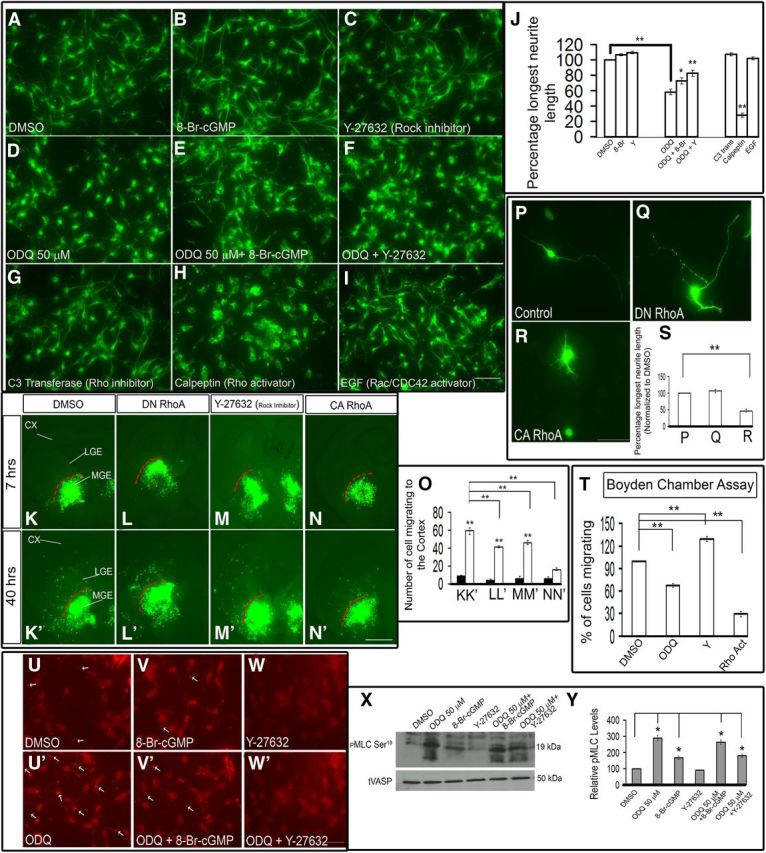
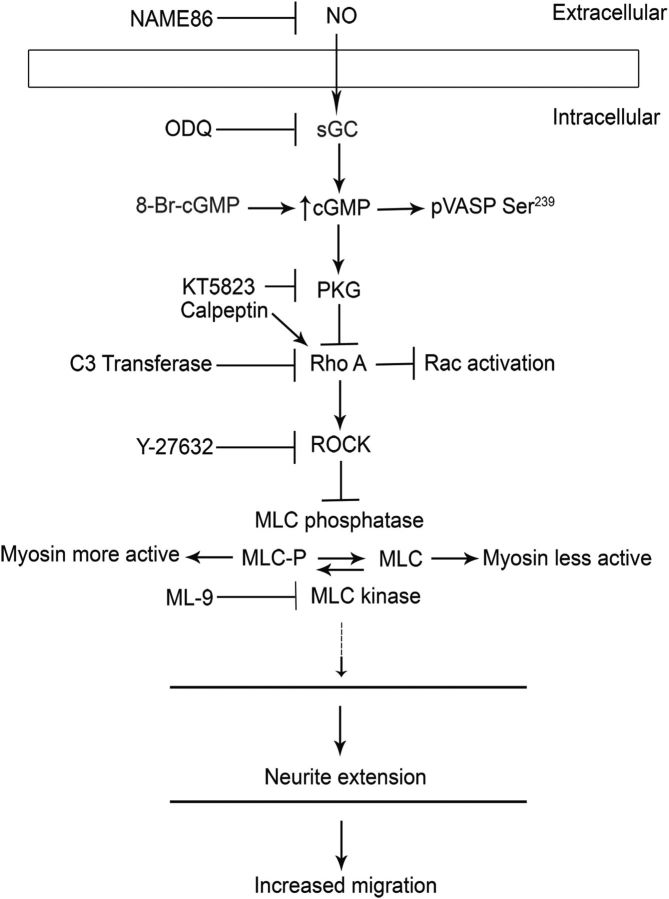
Here we have provided evidence that nitric oxide-cyclic GMP (NO-cGMP) signaling regulates neurite length and migration of immature neurons derived from the medial ganglionic eminence (MGE). Dlx1/2(-/-) and Lhx6(-/-) mouse mutants, which exhibit MGE interneuron migration defects, have reduced expression of the gene encoding the α subunit of a soluble guanylate cyclase (Gucy1A3). Furthermore, Dlx1/2(-/-) mouse mutants have reduced expression of NO synthase 1 (NOS1). Gucy1A3(-/-) mice have a transient reduction in cortical interneuron number. Pharmacological inhibition of soluble guanylate cyclase and NOS activity rapidly induces neurite retraction of MGE cells in vitro and in slice culture and robustly inhibits cell migration from the MGE and caudal ganglionic eminence. We provide evidence that these cellular phenotypes are mediated by activation of the Rho signaling pathway and inhibition of myosin light chain phosphatase activity.


Figures

Figure 1.
Figure 1.
Dlx1/2 regulate the expression of Gucy1A3, Gucy1B3, and Nos1 (nNOS) in the developing basal ganglia. In situ RNA hybridization analysis of Gucy1A3 (A–D′, E–H′), Gucy1B3 (K–N′, O–R′), and Nos1 (S–V′) expression in the telencephalon of WT (left panels) and Dlx1/2−/− (right panels) mice at E13.5 and E15.5. In each case, four planes of hemisections are shown (rostral to caudal). Gucy1A3 expression in the MGE is restricted to the dMGE. By E15.5, Gucy1A3 expression is detected in scattered cells in the cortical SVZ (higher magnification in I–J′ below); this expression is reduced in the Dlx1/2−/− mutants (I′, J′, arrows). Dlx1/2−/− mutants also have reduced Gucy1A3 expression in the SVZ of the LGE and MGE (E13.5 and E15.5); in addition, at E15.5, the mutants have ectopic Gucy1A3 expression in the caudoventral CGE/MGE (H′, E*, arrows), the region that has ectopic interneuron migration (Long et al., 2009b). Gucy1B3 and Nos1 expression is also greatly reduced in the basal ganglia anlage of the Dlx1/2−/− mutants. CGE, Caudal ganglionic eminence; CX, cortex; GP, globus pallidus; Str, striatum. Scale bars: A–H′, K–V′, 500 μm; I–J′, 120 μm.
Figure 2.
Figure 2.
Lhx6 regulates the expression of Gucy1A3 in the dorsal MGE. In situ RNA hybridization analysis of Gucy1A3 expression in the telencephalon of Lhx6+/PLAP (heterozgyotes) (left panels) and Lhx6PLAP/PLAP (homozygote mutants) (right panels) mice at E13.5 (A–D′) and E15.5 (E–H′). In each case, four planes of hemisections are shown (rostral to caudal). Expression of Gucy1A3 is specifically lost from the dMGE (B′, F′). I–T′, Expression of NOS1 (nNOS), NOS2, and NOS3 in the developing basal ganglia of WT and Dlx1/2−/− E15.5 mice. In situ RNA hybridization analysis of NOS1 (I–L′), NOS2 (M–P′), and NOS3 (Q–T′) expression in the telencephalon of WT (left panels) and Dlx1/2−/− (right panels) mice at E15.5. In each case, four planes of hemisections are shown (rostral to caudal). Scale bars: A–T′, 500 μm.
Figure 3.
Figure 3.
8-Br-cGMP mediates a partial rescue of cell migration of MGE and CGE cells from Dlx1/2−/− mutants assessed using Matrigel explants and Boyden chamber assays. A–D′, Matrigel explant cell migration assays of E13.5 MGE and CGE comparing WT (A–D) and Dlx1/2−/− mutants (A′–D′) treated with DMSO (A, A′, C, C′) or 8-Br-cGMP (B, B′, D, D′). E, F, Histograms reporting the percentage change in the MGE (E) and CGE (F) explant outgrowth (normalized to DMSO). Data are the mean ± SEM. *p ≤ 0.05 (paired Student's t test). **p ≤ 0.01 (paired Student's t test). Scale bars: A–D′, 500 μm. A, A′, p = 0.02241; B, B′, p = 0.00884; A′, B′, p = 0.00246. G, Boyden chamber assay showing that 8-Br-cGMP partially rescues the Dlx1/2−/− mutant (p = 0.02645). *p ≤ 0.05. **p ≤ 0.01.
Figure 4.
Figure 4.
A–D″, Slice electroporation migration assay. Cells were visualized by transfecting a GFP expression vector into the MGE in either the WT (A–A″, C–C″) or the Dlx1/2−/− mutants (B–B″, D–D″) treated with DMSO or 8-Br-cGMP. Migration into the LGE and cortex was assessed after 24, 36, and 48 h. E, Histogram showing quantification of the number of cells migrating to the cortex from MGE in slices. Data are the mean ± SEM. *p ≤ 0.05 (paired Student's t test). **p ≤ 0.01 (paired Student's t test). A′, C′, p = 0.018; A″, C″, p = 0.0006. Slices were grown in either DMSO or 8-Br-cGMP (500 μm). CX, Cortex. Scale bars: A–D″, 500 μm.
Figure 5.
Figure 5.
Inhibition of soluble guanlyate cyclase activity with ODQ reduces interneuron process length and migration from the MGE and CGE to the cortex in E13.5 telencephalic slices. Movies 1 and 2 show additional data. A–H′, Slice electroporation migration assay. Cells were visualized by transfecting a GFP expression vector into either the MGE (A–D′) or CGE (E–H′) by electroporation; migration into the LGE and cortex was assessed after 24 and 48 h. I, Histogram showing quantification of the number of cells migrating to the cortex from MGE or CGE in slices. Slices were grown in DMSO, 25 μm ODQ, 50 μm ODQ, or 100 μm ODQ. Data are the mean ± SEM. *p ≤ 0.05 (one-way ANOVA followed by Bonferroni post test). **p ≤ 0.01 (one-way ANOVA followed by Bonferroni post test). A, A′, p = 1.1 × E-6; B, B′, p = 0.00001; A′, C′, p = 0.00358; A′, D′, p = 0.00142; E, E′, p = 1.3 × E-6; F, F′, p = 0.00003; E′, G′, p = 0.00016; E′, H′, p = 0.00037. CX, Cortex. Scale bars: A–H′, 500 μm. J, K, Confocal image showing Lhx6-GFP expression in an E15.5 brain slice (200 μm) treated with either DMSO or ODQ (100 μm) for 1 h. L–O, Interneurons from the CP, oriented in a radial (L, M) or tangential (N, O) direction, are aligned by their cell soma (yellow arrowhead). The leading process length was assessed from the base of the soma to the tip of the leading process (red arrowhead). P, Quantification of rates of tangential migration through the MZ and SVZ are based on live imaging of E15.5 Lhx6-GFP+ ODQ-treated and DMSO-treated control cortices for 12 h. MZ, p = 4.01 × E-7; SVZ, p = 1.84 × E-8. Q, Quantification of the number of motile cells (i.e., cells migrating at a rate of >5 μm/h) within the CP of ODQ-treated and DMSO-treated control cortices (p = 0.00021). R, S, Quantification of leading process length of interneurons oriented in either radial or tangential direction (N = 5). *p < 0.001 (Student's t test). R, p = 1.16 × E-5. S, p = 0.00043. Scale bars: J, K, 110 μm; L, M, 28 μm; N, O, 30 μm. T, Matrigel explant cell migration assays of E13.5 MGE showing the outgrowth of neurites/cell processes (β-III-tubulin+) (U, V) and migration of the soma/nucleus (Hoechst+) (U′, V′) treated with DMSO (U, U′) or ODQ (100 μm) (V, V′). Bottom, Histograms reporting the percentage change in the MGE explant outgrowth. Data are the mean ± SEM. *p < 0.05 (paired Student's t test). **p < 0.01 (paired Student's t test). U, V, p = 0.00011; U′, V′, p = 5.1 × E-6.
Figure 6.
Figure 6.
Inhibition of soluble guanlyate cyclase activity with ODQ blocks cell migration from E13.5 explants of the MGE and CGE, assessed using Matrigel explants and Boyden chamber assays. A–H, Matrigel explant cell migration assays of E13.5 MGE and CGE comparing DMSO (A, E), 25 μm ODQ (B, F), 50 μm ODQ (C, G), and 100 μm ODQ (D, H). I, J, Histograms reporting the percentage change in the MGE (I) and CGE (J) explant outgrowth as a function of ODQ dose using one-way ANOVA followed by Bonferroni post test. I, DMSO versus ODQ 25 μm, p = 0.01346; DMSO versus ODQ 50 μm, p = 1.52 × E-4; DMSO versus ODQ 100 μm, p = 4.72 × E-5. J, DMSO versus ODQ 25 μm, p = 0.01044; DMSO versus ODQ 50 μm, p = 0.00245; DMSO versus ODQ 100 μm, p = 3.156 × E-4. Scale bars: A–H, 500 μm. K, Boyden chamber assay showing that progressively increasing concentration of ODQ inhibit more migration. Data are the mean ± SEM. *p ≤ 0.05 (one-way ANOVA followed by Bonferroni post test). **p ≤ 0.01 (one-way ANOVA followed by Bonferroni post test). DMSO versus ODQ 25 μm, p = 0.02589; DMSO versus ODQ 50 μm, p = 4.29 × E-4; DMSO versus ODQ 100 μm, p = 6.73 × E-4. L, Boyden chamber assay showing that 8-Br-cGMP partially counteracted the effect of 50 and 100 μm ODQ. However, the rescue in migration by 8-Br-cGMP was statistically significant in 100 μm ODQ (p = 0.03).
Figure 7.
Figure 7.
Inhibition of PKG activity with KT5823 reduces interneuron migration from the MGE to the cortex in E13.5 telencephalic slices. A–B″, Slice electroporation migration assay. Cells were visualized by transfecting a GFP expression vector into the MGE (A–B″) by electroporation; migration into the LGE and cortex was assessed after 7, 19, and 41 h. C, Histogram showing quantification of the number of cells migrating to the cortex from MGE in slices. Slices were grown in either DMSO or 25 μm KT5823. CX, Cortex. Data are the mean ± SEM. *p ≤ 0.05 (paired Student's t test). **p ≤ 0.01 (paired Student's t test). A″, B″, p = 7.5 × E-6. Additionally, inhibition of PKG activity with KT5823 inhibits cell migration from explants of the E13.5 MGE and CGE, assessed using Matrigel explants and Boyden chamber assays. D–I, Matrigel explant cell migration assays of E13.5 MGE and CGE comparing DMSO (D, G), 100 μm ODQ (E, H), and 25 μm KT5823 (F, I). J, K, Histograms reporting the percentage change in MGE (J) and CGE (K) explant outgrowth as a function of ODQ and KT5823 using one-way ANOVA followed by Bonferroni post test. DMSO versus ODQ, p = 3.26E-07; DMSO versus KT, p = 6.06E-07. K, DMSO versus ODQ, p = 3.57E-05; DMSO versus KT, p = 7.47E-05. L, Boyden chamber assay showing that both ODQ and KT5823 inhibit migration. Data are the mean ± SEM. *p < 0.05 (one-way ANOVA followed by Bonferroni post test). **p < 0.01 (one-way ANOVA followed by Bonferroni post test). DMSO versus ODQ, p = 1.4 × E-6; DMSO versus KT, p = 2.1 × E-5. Scale bars: A–I, 500 μm.
Figure 8.
Figure 8.
Gucy1A3−/− mice have reduced numbers of calbindin+ cortical interneurons at E15.5. Calbindin immunohistochemistry staining of E15.5 coronal hemisections of WT (A–C) and Gucy1A3−/− (A′–C′) telencephalons showing migrating immature cortical interneurons in rostral (A, A′), middle (B, B′), and caudal (C, C′) planes of sections. D, Histogram showing quantification of calbindin+ cell numbers in the cortical SVZ and cortical plate. Data are the mean ± SEM. *p ≤ 0.05 (one-way ANOVA followed by Bonferroni post test). **p ≤ 0.01 (one-way ANOVA followed by Bonferroni post test). SVZ, WT versus Gucy1A3−/− (rostral, p = 0.00317; medial, p = 0.00202; caudal, p = 0.00344); cortical plate (caudal, p = 0.00745). Scale bars: A–C′, 200 μm.
Figure 9.
Figure 9.
Inhibition of NOS activity with NAME86 inhibits interneuron migration from E13.5 explants of the MGE and CGE, assessed using electroporation slice culture migration assays. Cells were visualized by transfecting a GFP expression vector into either the MGE (A–C′) or CGE (D–F′) by electroporation; migration into the LGE and cortex was assessed after 24 and 48 h. Slices were grown in DMSO, 100 μm ODQ, or 100 μm NAME86. G, Histogram quantifying the number of cells migrating to the cortex from MGE or CGE in slices. Data are the mean ± SEM. *p ≤ 0.05 (one-way ANOVA followed by Bonferroni post test). **p ≤ 0.01 (one-way ANOVA followed by Bonferroni post test). A′, B′, p = 1.3 × E-5; A′, C′, p = 0.00014; D′, E′, p = 0.00235; D′, F′, p = 0.0396. H, NOS1+ expression in E14.5 WT sections. Arrows in the 20 × magnification image indicate NOS1+ in corticofugal axons entering the striatum. CX, Cortex. Scale bars: A–F′, H (left), 500 μm; H (right), 100 μm.
Figure 10.
Figure 10.
Inhibition of NOS activity with NAME86 blocks cell migration from E13.5 explants of the MGE and CGE, assessed using Matrigel explants and Boyden chamber assays. A–F, Matrigel explant cell migration assays of E13.5 MGE and CGE comparing DMSO (A, D), 100 μm ODQ (B, E), and 100 μm NAME86 (C, F). G, H, Histograms reporting the percentage change in MGE (G) and CGE (H) explant outgrowth as a function of ODQ and NAME86 using one-way ANOVA followed by Bonferroni post test. G, DMSO versus ODQ, p = 1.54E-06; DMSO versus NAME, p = 1.99E-06. H, DMSO versus ODQ, p = 8.33E-04; DMSO versus NAME, p = 2.84E-03. Scale bars: A–F, 500 μm. I, Boyden chamber assay showing that both ODQ (100 μm) and NAME86 (100 μm) inhibit migration. Data are the mean ± SEM. *p ≤ 0.05 (one-way ANOVA followed by Bonferroni post test). **p ≤ 0.01 (one-way ANOVA followed by Bonferroni post test). DMSO versus ODQ, p = 1.17E-07; DMSO versus NAME, p = 1.39E-05. J, K, Immunofluorescence analysis of NOS1 expression in the telencephalon of WT (J) and Dlx1/2−/− (K) mice at E18.5. Arrows indicate the axons going to striatum. CX, Cortex; Str, striatum.
Figure 11.
Figure 11.
Inhibition of soluble guanylate cyclase rapidly alters the shape of MGE neurons. A–D, Dose-dependent attenuation of MGE neurite length comparing DMSO (A), 25 μm ODQ (B), 50 μm ODQ (C), and 100 μm ODQ (D) treated for 30 min followed by staining using β-III-tubulin (Tuj1) antibodies. Scale bars: A–D, 50 μm. E, Histogram showing the effect of different concentrations of ODQ (A–D) on longest neurite length, normalized to DMSO. A versus B, p = 4.667 × 10⁻⁵; A versus C, p = 5.378 × 10⁻⁶; A versus D, p = 1.535 × 10⁻⁷. F–H, ODQ attenuation of neurite length was reversible when ODQ was washed from the media as shown in H; compare with F (DMSO) and G (50 μm ODQ). Scale bars: F–H, 100 μm. I, Histogram showing the effect on neurite length when ODQ was washed from the media, normalized to DMSO. F versus G, p = 1.8 × E-6; G versus H, p = 3.4 × E-6. J–R, Inhibition of tangential migration from the MGE to the cortex was partially reversible when ODQ was removed from the media after 27 h of ODQ treatment, and image was taken 24 h after the ODQ wash in a slice electroporation experiment as shown in R compared with the unwashed specimen in O. Also compare with M–O (50 μm ODQ) and J–L (DMSO). S, Histogram quantifying the number of cells migrating to the cortex from MGE in slices. Scale bars: J–O, 500 μm. Data are the mean ± SEM. *p ≤ 0.05 (one-way ANOVA followed by Bonferroni post test). **p ≤ 0.01 (one-way ANOVA followed by Bonferroni post test). L, O, p = 1.13 × E-6; L, R, p = 4.5 × E-5; O, R, p = 0.0001.
Figure 12.
Figure 12.
Inhibition of sGC rapidly alters the neurite length of MGE neurons that were labeled by GFP expression from an Lhx6-GFP-Bac transgene. A–H, Dose-dependent attenuation of MGE neurite length comparing DMSO (A), 25 μm ODQ (B), 50 μm ODQ (C), and 100 μm ODQ (D) followed by the partial rescue in ODQ-induced neurite length by the addition of 8-Br-cGMP (E–H). Scale bars: A–H, 50 μm. I, Western blot analysis showing increased levels of phospho-VASP Ser239 (a measure of PKG activity) in MGE cells treated with either 8-Br-cGMP alone or in combination with ODQ compared with DMSO or ODQ alone treated cells. Total VASP (tVASP) was used as the loading control. J, Quanitification of the Western blot bands using the histogram tool in Adobe Photoshop (CS3). Results are presented as relative protein levels, expressed in percentage normalized to DMSO-treated cell extracts.
Figure 13.
Figure 13.
Inhibition of sGC activity with ODQ mediates neurite retraction via the activation of Rho signaling pathway. A–F, ODQ inhibition of neurite length (D) is counteracted by either 8-Br-cGMP (B, E, J) or the ROCK inhibitor Y-27632 (C, F, J). G–J, The RhoA inhibitor C3 transferase (G) and the Rac activator EGF (I) increased neurite length. On the other hand, the RhoA activator calpeptin reduced neurite length (H). Scale bars: A–I, 50 μm. Results are quantified in J. J, DMSO versus ODQ, p = 6.855 × 10⁻⁸; ODQ versus ODQ + 8-Br, p = 0.0296; ODQ versus ODQ + Y, p = 1.288 × 10⁻⁴; DMSO versus calpeptin, p = 8.756 × 10⁻¹². K–N′, Slice electroporation migration assay. Cells were visualized by transfecting a GFP expression vector (K, K′, M, M′) or cotransfecting a GFP expression vector with constitutively active RhoA (CA RhoA) (N, N′), dominant-negative RhoA (DN RhoA) (L, L′) into the MGE (K–N′) by electroporation; migration into the LGE and cortex was assessed after 7 and 40 h. O, Histogram showing quantification of the number of cells migrating to the cortex from MGE in slices. Slices were grown in either DMSO or 10 μm Y-27632 as indicated. Expression of a constitutively active RhoA (CA RhoA) inhibited tangential migration (N, N′) significantly, whereas the dominant-negative RhoA (DN RhoA) and the ROCK inhibitor (Y-27632) did not inhibit MGE tangential migration (L, L′, M, M′). Instead, there was a significant increase in the migration. K, K′, p = 3.9 × E-10; L, L′, p = 4.41 × E-8; M, M′, p = 1.23 × E-8; K′, L′, p = 0.00042; K′, M′, p = 0.01142; K′, N′, p = 3.76 × E-9. CX, Cortex. Scale bars: K–N′, 500 μm. P–R, Expression of a constitutively active RhoA (CA RhoA) (R) construct in MGE neurons reduced the neurite length significantly compared with control (P) or dominant-negative RhoA (DN RhoA) construct (Q). S, Histogram showing the effect on neurite length when dominant active or negative RhoA constructs were expressed in MGE neurons. P versus R, p = 0.00031. Scale bars: P–R, 50 μm. T, Boyden chamber assay showing that both ODQ and the Rho activator (calpeptin) inhibit migration in contrast to Y-27632 (ROCK inhibitor). DMSO versus ODQ, p = 0.0002; DMSO versus Y, p = 0.00039; DMSO versus Rho Act, p = 5.1 × E-7. U–W′, Increased p-MLC phosphorylation staining at distal ends of neurites after ODQ treatment compared with 8-Br-cGMP or Y-27632-treated cells. Scale bars: U–W′, 50 μm. X, Western blot analysis showing increased p-MLC (Ser19) phosphorylation after ODQ treatment in MGE cells. tVASP was used as the loading control. Y, Quantification of the Western blot bands using the histogram tool in Adobe Photoshop (CS3). Results are presented as relative protein levels, expressed in percentage normalized to DMSO-treated cell extracts. Data are the mean ± SEM. J, O, S, T, *p ≤ 0.05 (one-way ANOVA followed by Bonferroni post test). **p ≤ 0.01 (one-way ANOVA followed by Bonferroni post test).
Figure 14.
Figure 14.
Schematic diagram proposing the mechanism of cGMP (generated by sGC) mediated neurite extension via inhibition of the Rho signaling pathway in MGE neurons.

Similar articles

Cited by

References

    1. Anderson SA, Eisenstat DD, Shi L, Rubenstein JL. Interneuron migration from basal forebrain: dependence on Dlx genes. Science. 1997a;278:474–476. doi: 10.1126/science.278.5337.474. - DOI - PubMed
    1. Anderson SA, Qiu M, Bulfone A, Eisenstat DD, Meneses J, Pedersen R, Rubenstein JL. Mutations of the homeobox genes Dlx-1 and Dlx-2 disrupt the striatal subventricular zone and differentiation of late-born striatal cells. Neuron. 1997b;19:27–37. doi: 10.1016/S0896-6273(00)80345-1. - DOI - PubMed
    1. Begum N, Sandu OA, Ito M, Lohmann SM, Smolenski A. Active Rho kinase (ROK-alpha) associates with insulin receptor substrate-1 and inhibits insulin signaling in vascular smooth muscle cells. J Biol Chem. 2002;277:6214–6222. doi: 10.1074/jbc.M110508200. - DOI - PubMed
    1. Boulton CL, Southam J, Garthwaite E. Nitric oxide-dependent long-term potentiation is blocked by a specific inhibitor of soluble guanylyl cyclase. Neuroscience. 1995;69:699–703. doi: 10.1016/0306-4522(95)00349-N. - DOI - PubMed
    1. Burridge K, Doughman R. Front and back by Rho and Rac. Nat Cell Biol. 2006;8:781–782. doi: 10.1038/ncb0806-781. - DOI - PubMed

Publication types

MeSH terms