. 2013 Oct 23;33(43):16992-7007.
doi: 10.1523/JNEUROSCI.1455-12.2013.

Topographic representation of an occluded object and the effects of spatiotemporal context in human early visual areas

Affiliations

Topographic representation of an occluded object and the effects of spatiotemporal context in human early visual areas

Hiroshi Ban et al. J Neurosci. .

Abstract

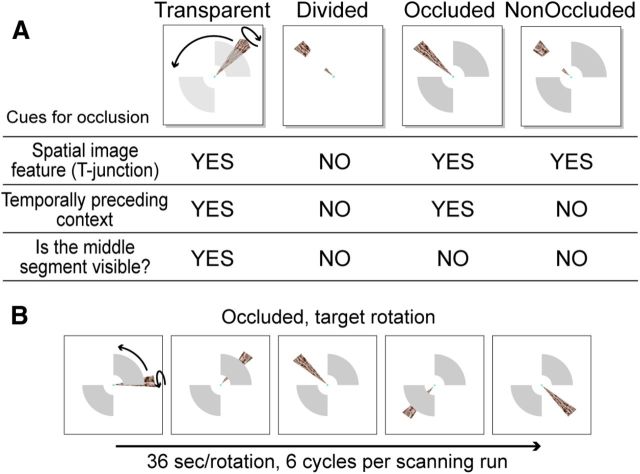
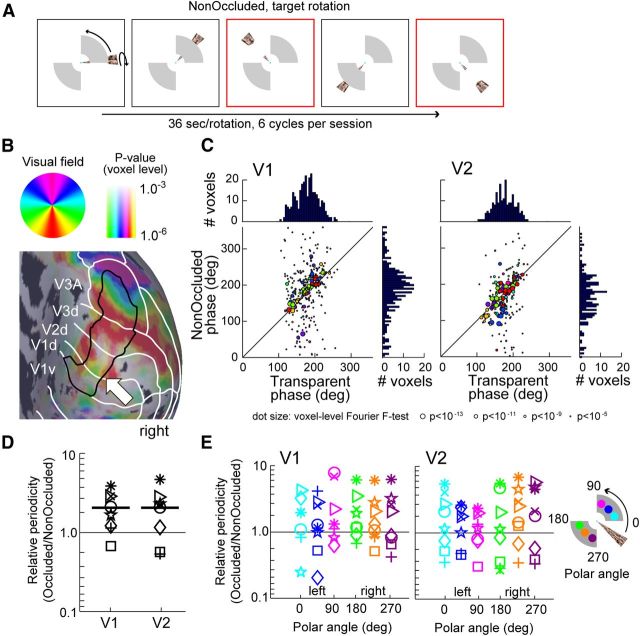
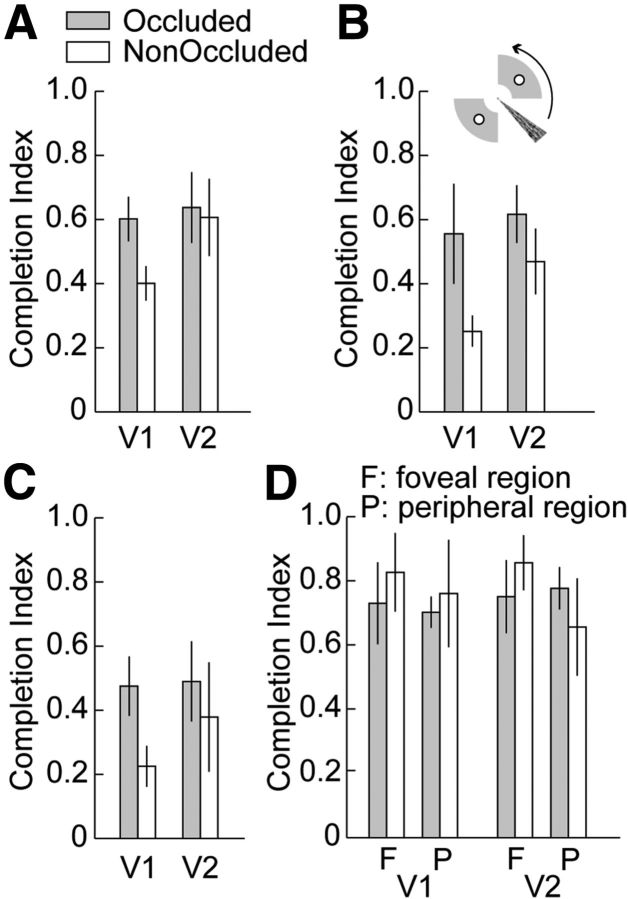
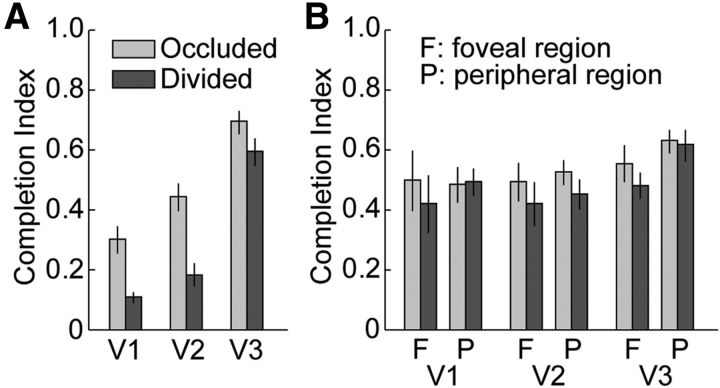
Occlusion is a primary challenge facing the visual system in perceiving object shapes in intricate natural scenes. Although behavior, neurophysiological, and modeling studies have shown that occluded portions of objects may be completed at the early stage of visual processing, we have little knowledge on how and where in the human brain the completion is realized. Here, we provide functional magnetic resonance imaging (fMRI) evidence that the occluded portion of an object is indeed represented topographically in human V1 and V2. Specifically, we find the topographic cortical responses corresponding to the invisible object rotation in V1 and V2. Furthermore, by investigating neural responses for the occluded target rotation within precisely defined cortical subregions, we could dissociate the topographic neural representation of the occluded portion from other types of neural processing such as object edge processing. We further demonstrate that the early topographic representation in V1 can be modulated by prior knowledge of a whole appearance of an object obtained before partial occlusion. These findings suggest that primary "visual" area V1 has the ability to process not only visible or virtually (illusorily) perceived objects but also "invisible" portions of objects without concurrent visual sensation such as luminance enhancement to these portions. The results also suggest that low-level image features and higher preceding cognitive context are integrated into a unified topographic representation of occluded portion in early areas.


Figures

Figure 1.
Figure 1.
Experimental design and visual stimuli. A, Stimuli used in the main experiment. Transparent condition: the target rotated behind two transparent occluders. fMRI activity for this stimulus is used as a baseline to assess amodal completion-related activity. Divided condition: the divided target alone rotated around the central fixation. This stimulus simulates fragmentation of visual elements due to occlusion in natural scenes. Occluded condition: the target rotated around the central fixation passing behind the occluders. In this configuration, both spatial image features, such as T-shaped junctions and temporally preceding experience with seeing, the complete appearance of the target before partial occlusion promote amodal perception. Nonoccluded condition: the divided target rotated so as to overlap two stable occluders. In this configuration, when the divided target rotated and overlapped with one of the occluders, T-shaped junctions over the occluder promote occlusion perception, although the observer who sees whole appearance of the target before overlapping knows that the target is divided, never occluded. B, Schematic view of target rotation (occluded condition). Participants viewed continuous rotation of the target while fixating the central dot.
Figure 2.
Figure 2.
Identified retinotopic visual areas. Twelve retinotopic regions of interest. A, Locations of the visual areas V1, V2, V3, V4v, V3A, V3B, V7, LO, and MT+ in one subject's right hemisphere from posterior lateral view (left) and ventromedial view (right). The icon to the left of the panel indicates the relationship between color and visual area. Borders of the areas were determined from the polar-angular (B) and eccentricity (C) visual field representations measured by separated phase-encoded retinotopic mapping experiments. The color overlay on the inflated cortex indicates the preferred stimulus angle or eccentricity at each cortical point, and the colored lines indicate each area's border. The icons to the left of each panel indicate the relationship between color and visual field position.
Figure 3.
Figure 3.
Representative cortical activity in response to transparent and real target rotations. Response phase angles of significantly (Fourier F test, p < 0.001, voxel level) activated voxels projected on participant's inflated occipital cortex. A, Phase-encoded responses for target rotation behind transparent occluders (transparent condition). B, Phase-encoded responses for target rotation alone.
Figure 4.
Figure 4.
Representative cortical responses and fMRI time series for Occluded and Divided stimuli. A, Top left and right, and bottom right panels, Cortical responses projected on representative right inflated cortical surfaces (voxels with p < 0.001 in voxelwise Fourier F test were mapped). Colors represent the corresponding visual field locations as shown the icon above. Color saturations represent statistical p values. The black solid lines indicate retinotopic subregions representing the lower-left occluder. The white lines indicate retinotopic visual area borders. Bottom, left, Cortical activity in response to the checkerboard stimulus used for localizing the cortical subregions representing the upper-right and lower-left occluders. B, Averaged fMRI signal time courses evoked by the occluded and divided stimuli in V1, V2, and V3. Left/right columns show the averaged voxel time courses sampled from the foveal/peripheral regions of the retinotopic subregion corresponding to the occluded portion. Middle column show the averaged voxel time courses corresponding to the occluded portion. Here, the response phases of voxels were aligned to 16 s after the first stimulus presentation by linear interpolating and shifting the time courses voxel-by-voxel based on the response phases evoked by the transparent stimulus. Error bars, SE.
Figure 5.
Figure 5.
Relationship of response phases between the transparent and occluded/divided conditions. A, Voxelwise phase scatter plots, transparent versus occluded. Each dot represents individual voxel. Each color represents single participant. Dot sizes represent magnitudes of Fourier F-statistics (and the corresponding statistical p values). Larger dot indicates that the voxel contains higher-power at the target rotation frequency (1/36 Hz) compared with the sum of the powers at the other frequencies. Here, for legibility, the response phases of voxels were aligned so that the center of response phases of each ROI comes to 180° by voxel-by-voxel linear shifting based on the response phases evoked by the transparent stimulus for each participant. B, Voxelwise phase scatter plots, trasnparent versus divided.
Figure 6.
Figure 6.
Relative periodicity (occluded/divided) in V1–V3 ROIs. Relative periodicity plots in V1, V2, and V3. Each shape represents a single participant. Horizontal bars represent mean values.
Figure 7.
Figure 7.
Temporal and spatial specificity of completion-related responses. Voxel-by-voxel responses were resampled along visual field polar angle or eccentricity representation. A, fMRI voxel time courses evoked by the occluded stimulus sampled and averaged separately from three subregions of each ROI along the cortical visual polar angle representations. Each color represents the corresponding visual field location. B, Comparison of relative periodic responses (occluded/divided) along polar angle representation. Each shape represents a single participant. Each color represents a single retinotopic position as shown in the right icon. C, Comparison of relative periodic responses (occluded/divided) along visual eccentricity representation.
Figure 8.
Figure 8.
Completion indices in retinotopic ROIs for the occluded and divided stimuli. A, Completion indices in retinotopic ROIs. The indices for the occluded stimulus revealed that only V1 and V2 exhibited significant completion-related activity compared with the divided stimulus. B, Completion indices within the strictly limited regions in V1 and V2 corresponding to the middle position of the occluders. C, Completion indices in retinotopic ROIs after excluding all voxels that showed responses at p < 0.05 level for the divided condition to minimize BOLD spread effects in the results. The voxel exclusion was done in each scanning day and each participant separately. Error bars, SEM.
Figure 9.
Figure 9.
Completion indices in the outer regions of retinotopic ROIs and higher regions. A, Completion indices in the foveal/peripheral outer regions of the target subregions that retinotopically represent the occluder positions. B, The indices in coarsely retinotopic higher visual areas. Error bars, SEM.
Figure 10.
Figure 10.
Effect of temporally preceding cognitive context on amodal completion-related activity. A, Schematic view of the nonoccluded stimulus presentation. In this configuration, the divided target rotated so as to overlap two stable occluders. Therefore, an observer knows that the target is not occluded but divided, whereas spatial image features such as T-junctions promotes amodal completion percept. B, Cortical activity in response to the nonoccluded stimulus. C, Voxelwise phase scatter plots, transparent versus nonoccluded. Each color represents a single participant. Dot sizes represent magnitudes of Fourier F-statistics (and the corresponding statistical p values). For details, see Figure 5. D, Relative periodicities (occluded/nonoccluded) exhibited significant decrease in V1 due to temporally preceding cognitive context. Each shape represents a single participant. E, Comparison of relative periodic responses (occluded/nonoccluded) in V1 and V2 along polar angle representation. Each color represents the corresponding visual field location. Each shape represents a single participant.
Figure 11.
Figure 11.
Completion indices for the occluded and nonoccluded stimuli. A, Comparison of completion indices for the occluded and nonoccluded stimuli in V1 and V2. B, Completion indices after the ROIs in V1/V2 were restricted to regions corresponding to the middle portion of the occluders. C, Completion indices in V1 and V2 after excluding all voxels that showed responses at p < 0.05 level for the divided condition to minimize BOLD spread effects in the results. The voxel exclusion was done in each scanning day and each participant separately. D, Completion indices in the foveal/peripheral regions of ROIs. Error bars, SEM.
Figure 12.
Figure 12.
Completion indices for the occluded and divided stimuli with a more attention-demanding task. A, Completion indices in retinotopic ROIs under an additional attention control experiment. Although the overall index values decreased in this experiment, higher indices for the occluded over the divided condition were again observed. B, Completion indices in the foveal/peripheral regions of ROIs. Error bars, SEM.
Figure 13.
Figure 13.
Noise powers in time series for the occluded, divided, and nonoccluded stimuli. A, Voxel-averaged noise powers in ROIs for the occluded, divided, and nonoccluded stimuli. Noise powers were computed by averaging Fourier powers other than the target rotation frequency (1/36 Hz) and the higher harmonics. B, Voxel-averaged noise powers in the foveal/peripheral regions of ROIs. Error bar, SEM.
Figure 14.
Figure 14.
Noise powers in time series for the occluded and divided stimuli with a more attention-demanding task. A, Voxel-averaged noise powers in ROIs for the occluded and divided stimuli under an additional attention control experiment. Noise powers were computed by averaging Fourier powers other than the target rotation frequency (1/36 Hz) and the higher harmonics. B, Voxel-averaged noise powers in the foveal/peripheral regions of ROIs. Error bar, SEM.

Similar articles

Cited by

References

    1. Albert MK. Mechanisms of modal and amodal interpolation. Psychol Rev. 2007;114:445–469. doi: 10.1037/0033-295X.114.2.455. - DOI - PubMed
    1. Albright TD, Stoner GR. Contextual influences on visual processing. Annu Rev Neurosci. 2002;25:339–379. doi: 10.1146/annurev.neuro.25.112701.142900. - DOI - PubMed
    1. Anderson BL, Singh M, Fleming RW. The interpolation of object and surface structure. Cogn Psychol. 2002;44:148–190. doi: 10.1006/cogp.2001.0765. - DOI - PubMed
    1. Bakin JS, Nakayama K, Gilbert CD. Visual responses in monkey areas V1 and V2 to three-dimensional surface configurations. J Neurosci. 2000;20:8188–8198. - PMC - PubMed
    1. Ban H, Yamamoto H. A non–device-specific approach to display characterization based on linear, nonlinear, and hybrid search algorithms. J Vis. 2013;13(6):20, 1–26. doi: 10.1167/13.6.20. - DOI - PubMed

Publication types