. 2013 Oct 23;33(43):17008-22.
doi: 10.1523/JNEUROSCI.3043-13.2013.

Deletion of CPEB3 enhances hippocampus-dependent memory via increasing expressions of PSD95 and NMDA receptors

Affiliations

Deletion of CPEB3 enhances hippocampus-dependent memory via increasing expressions of PSD95 and NMDA receptors

Hsu-Wen Chao et al. J Neurosci. .

Abstract

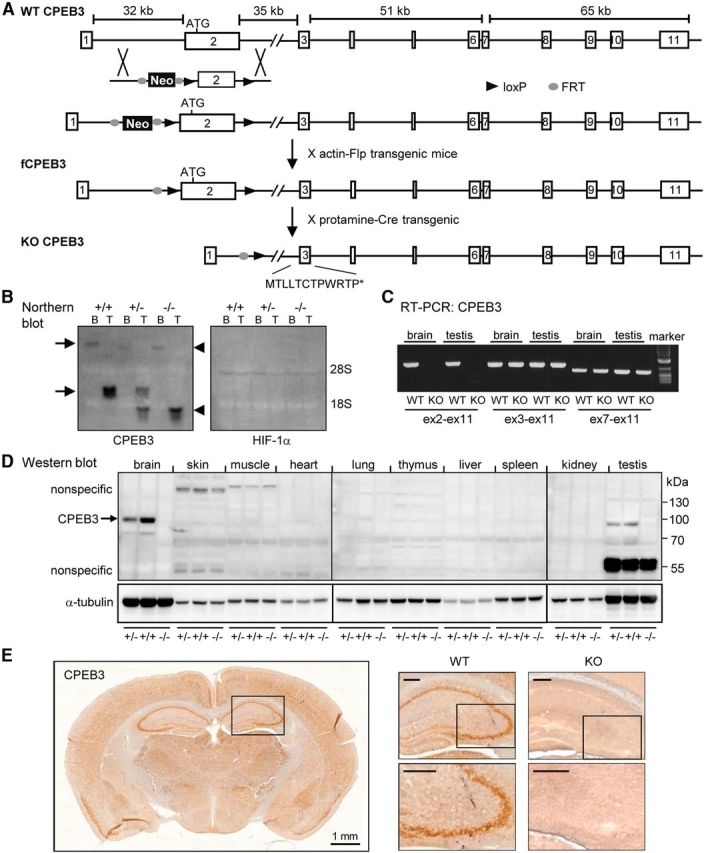
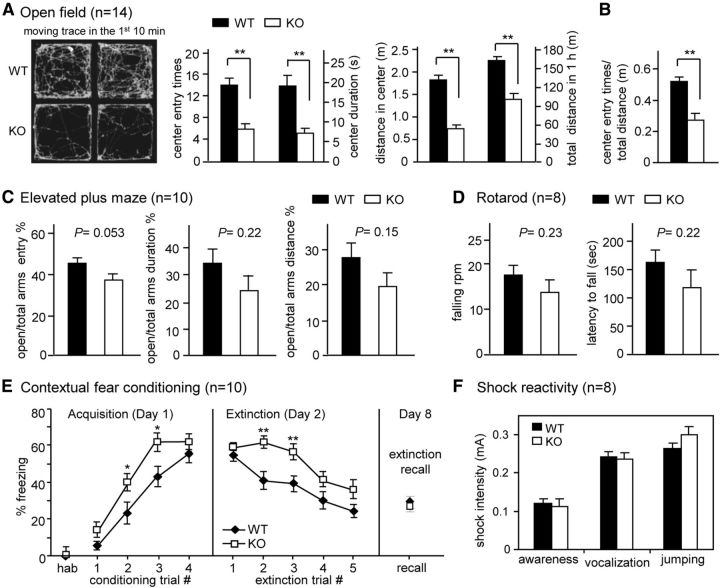
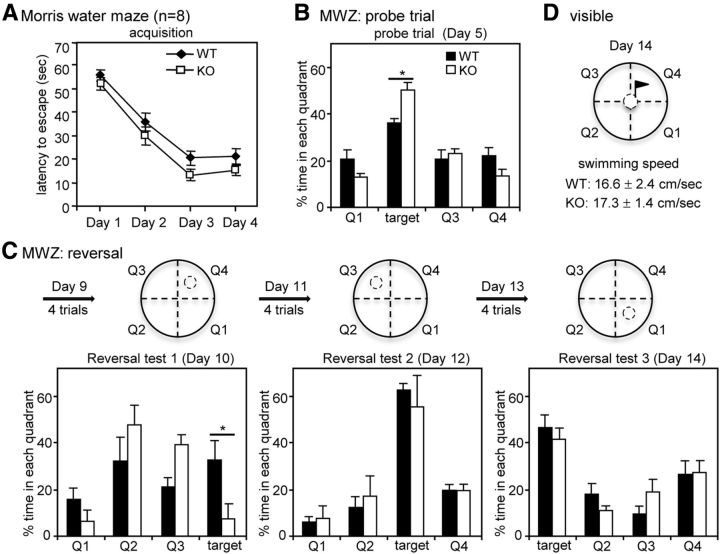
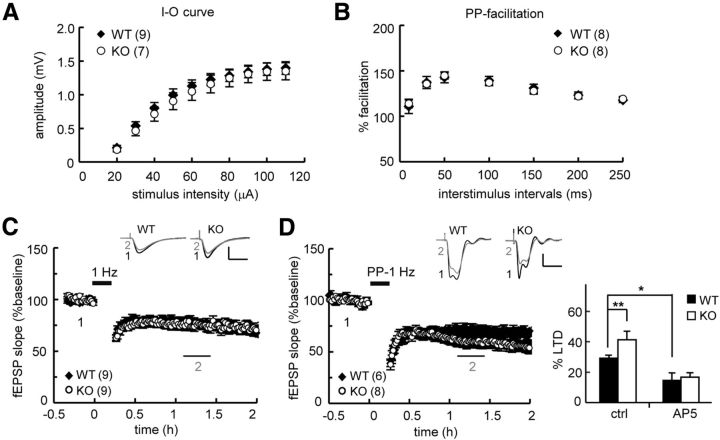
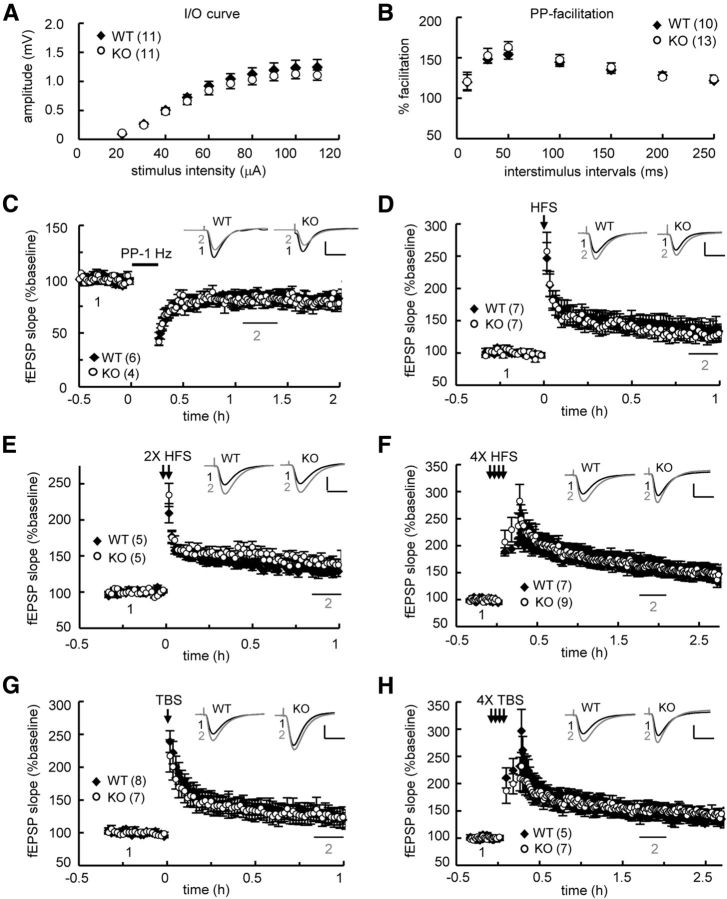
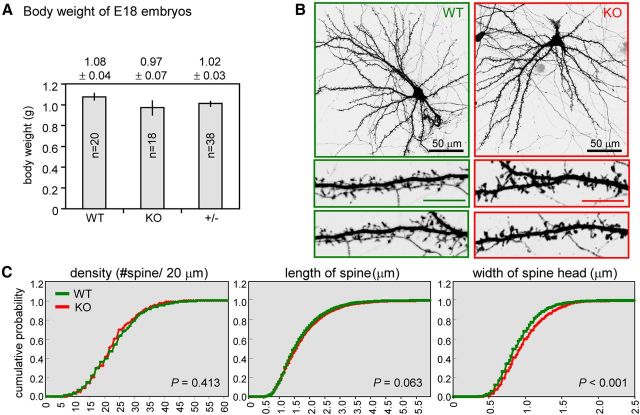
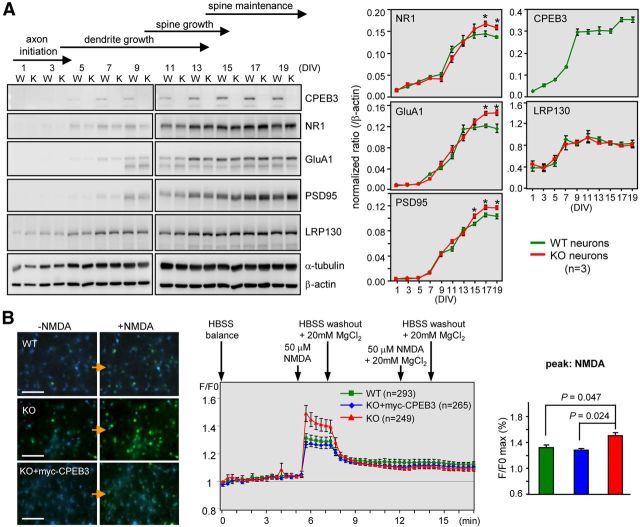
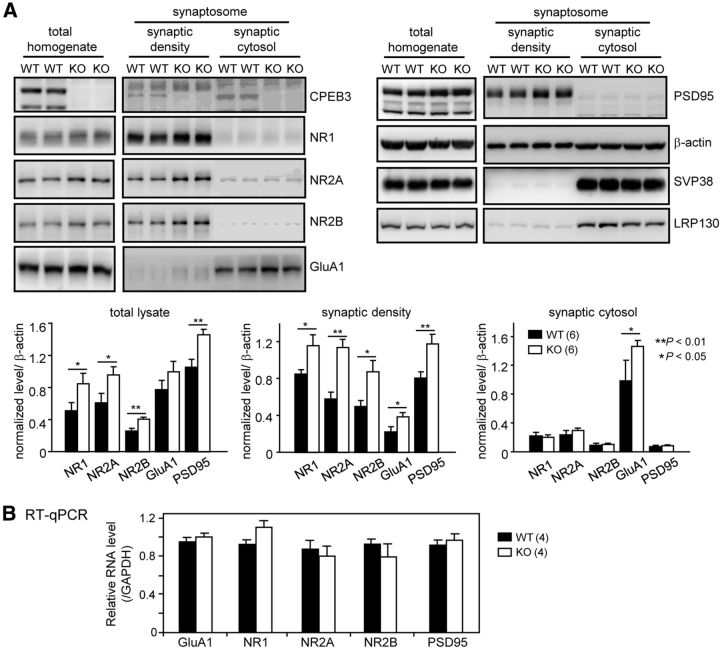
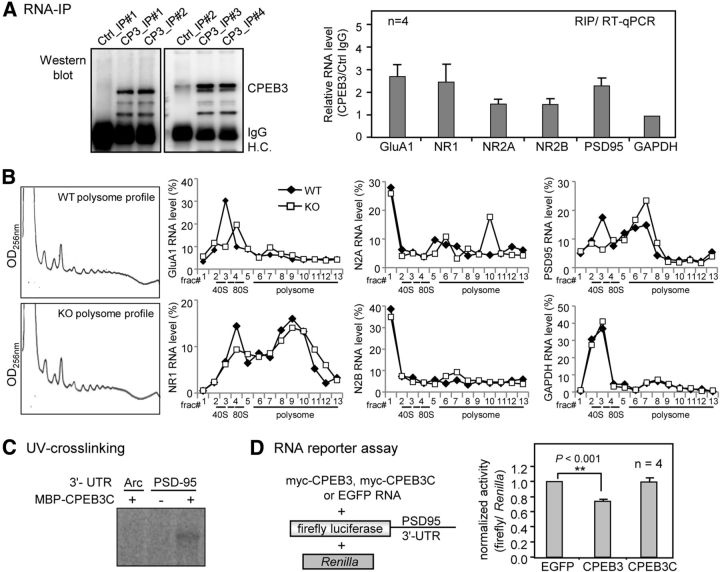
Long-term memory requires activity-dependent synthesis of plasticity-related proteins (PRPs) to strengthen synaptic efficacy and consequently consolidate memory. Cytoplasmic polyadenylation element binding protein (CPEB)3 is a sequence-specific RNA-binding protein that regulates translation of several PRP RNAs in neurons. To understand whether CPEB3 plays a part in learning and memory, we generated CPEB3 knock-out (KO) mice and found that the null mice exhibited enhanced hippocampus-dependent, short-term fear memory in the contextual fear conditioning test and long-term spatial memory in the Morris water maze. The basal synaptic transmission of Schaffer collateral-CA1 neurons was normal but long-term depression evoked by paired-pulse low-frequency stimulation was modestly facilitated in the juvenile KO mice. Molecular and cellular characterizations revealed several molecules in regulating plasticity of glutamatergic synapses are translationally elevated in the CPEB3 KO neurons, including the scaffolding protein PSD95 and the NMDA receptors along with the known CPEB3 target, GluA1. Together, CPEB3 functions as a negative regulator to confine the strength of glutamatergic synapses by downregulating the expression of multiple PRPs and plays a role underlying certain forms of hippocampus-dependent memories.


Figures

Figure 1.
Figure 1.
Generation and characterization of CPEB3-null mice. A, B, Schematic illustration of the targeting strategy. The cpeb3 gene consists of 11 exons (numbered boxes) and spans a region of 185 kb. The targeting vector containing the flip recombinase target (FRT)-flanked phosphoglycerate kinase (PGK) promoter-driven neomycin-resistance gene (Neo) and loxP-flanked exon 2 cassette was inserted into the cpeb3 gene by homologous recombination. After the excision of the PGK-Neo cassette by crossing with a C57BL/6 mouse line expressing Flp recombinase driven by a ubiquitous β-actin promoter (actin-flp), the resulting female progenies carrying the floxed CPEB3 allele CPEB3 (fCPEB3) were mated with C57BL/6 males containing a Cre recombinase transgene under the control of protamine promoter (protamine-cre) to excise exon 2 in sperms to produce the KO allele. Male offspring carrying WT (+/+), heterozygous (+/−) or KO (−/−) alleles from heterozygous matings were selected for (B) Northern blot analysis using a probe against exon 3–6 of CPEB3 RNA or HIF-1α RNA (loading control). The arrows denote two CPEB3 transcripts derived from alternative usage of the polyadenylation signals in the 3′-UTR. The arrowheads denote the truncated CPEB3 transcripts without the exon 2 sequence. C, RT-PCR analysis using RNAs isolated from the brain and testes of WT and KO littermates confirmed the presence of exon 2-deleted CPEB3 transcript in the KO tissues. D, E, Western blotting (D) and immunohistochemistry (E) of coronal brain slices using the affinity-purified polyclonal CPEB3 antibody revealed no immunostained signal in the KO tissue. Scale bar, 0.25 mm unless specified.
Figure 2.
Figure 2.
Behavioral characterization. Anxiety level and exploratory behavior of WT and KO mice were assessed using open field and EPM tasks. A, Representative moving traces in the open arena are shown. The entry times, staying duration, and traveling distance in the center during the first 10 min and the total 1 h moving distance in the arena were presented as bar graphs. B, The center entry times were normalized against the moving distance in the first 10 min. C, The percentage of entry and staying duration into the open arms versus the total arms in the EPM was analyzed. D, Rotarod. The rotating speed that caused the mouse to fall and the latency in which the mouse could stay on the rotating rod were analyzed. E, Contextual fear conditioning. The freezing response during habituation (hab) and acquisition was analyzed for 2 min per trial. A foot shock was given at the end of habituation and the first three conditioning trials. During extinction, the mouse was placed in the chamber for 30 min without reinforcing the shock. The freezing level was analyzed every 6 min for five segments. Consolidated extinction memory was recalled a week later by monitoring the freezing behavior for 6 min in the original chamber. F, Shock reactivity. The current intensities required to evoke various responses in the mice were recorded. The data were expressed as mean ± SEM; *p < 0.05 and **p < 0.01, Student's t test.
Figure 3.
Figure 3.
CPEB3 KO mice showed enhanced consolidated spatial memory in the MWZ test. A, The WT and KO mice normally learned in the hidden platform version of MWZ within four trials per day for 4 consecutive days. B, In the probe trial, the platform was removed, and the percentage of time that the mouse spent navigating in each quadrant was analyzed. Both of the groups of mice searched closer to the target quadrant where the platform had been previously placed. C, Reversal learning. On day 9, the mice were trained for four trials to locate the hidden platform in a new position. The reversal probe test was conducted 24 h later on day 10. The reversal learning and probe test were repeated two more times with an altered platform position. D, The motor ability and visual acuity of the mice were assessed by the swimming speed in the cued version of MWZ, in which the platform was indicated by a visible flag. All of the data were expressed as the mean ± SEM; *p < 0.05 (Student's t test).
Figure 4.
Figure 4.
Genetic ablation of CPEB3-facilitated PP-LFS-induced LTD in the SC pathway of juvenile (3- to 4-week-old) hippocampal slices. Basal synaptic transmission. A, B, Input–output (I–O) curve and (B) paired-pulse (PP) facilitation did not show a significant difference between the WT and KO mice (p = 0.66 and 0.97, respectively, two-way ANOVA). C, D, Normal LFS-induced LTD (WT: 76.82 ± 2.84%; KO: 75.37 ± 3.94%, p = 0.96, Student's t test, at 50–70 min after stimulation) and (D) increased PP-LFS-elicited LTD in the KO hippocampal slices (WT: 70.34 ± 3.70%; KO: 59.81 ± 5.48%, p < 0.01, Student's t test, at 50–70 min after stimulation). PP-LFS-evoked LTD was blocked by the NMDAR antagonist, 50 μm AP5. Numbers in parentheses represent the number of slices isolated from 4 to 5 male mice that were used for recordings. All of the data were expressed as the mean ± SEM. Statistics from C to D were analyzed using Student's t test. Traces represent baseline (black line, 1) and 50–70 min after stimulation (gray line, 2). Calibration, 0.5 mV, 20 ms.
Figure 5.
Figure 5.
Normal LTP and LTD in the SC pathway of adult (9- to 12-week-old) KO hippocampal slices. Basal synaptic transmission. A, B, Input–output (I–O) curve and (B) paired-pulse (PP) facilitation were normal in the KO slices (p = 0.09 and 0.72, respectively, two-way ANOVA). C–H, LTD induced by PP-LFS showed no significant difference (WT: 83.61 ± 3.71%, KO: 81.64 ± 4.74%, p = 0.12 at 50–70 min after stimulation) between the WT and KO groups. No significant difference was observed between the WT and KO slices in LTP evoked by (D) one train (1X) of HFS (WT: 136.67 ± 12.78%, KO: 128.77 ± 10.8%, p = 0.10 at 50–60 min), (E) two trains (2X) of HFS (WT: 128.6 ± 5.05%, KO: 126.39 ± 4.26%, p = 0.43 at 50–60 min), (F) four trains (4X) of HFS (WT: 165.84 ± 9.01%, KO: 162.8 ± 16.08%, p = 0.43 at 100–120 min after stimulation), (G) 1X TBS (WT: 126.07 ± 7.35%; KO, 126.32 ± 14.42%, p = 0.96 at 50–60 min), and (H) 4X TBS (WT: 145.42 ± 10.02%, KO: 151.42 ± 13.13%, p = 0.08 at 100–120 min after stimulation). Numbers in parentheses represent the number of recorded slices isolated from 4 to 5 male mice. All of the data were expressed as the mean ± SEM. Statistics from C to H were analyzed using Student's t test. Traces represent baseline (black line, 1) and the indicated time after stimulation (gray line, 2). Calibration: 0.5 mV, 20 ms.
Figure 6.
Figure 6.
Enlarged dendritic spine heads in cultured CPEB3 KO neurons. A, The body weight of E18 embryos isolated from heterozygous CPEB3 matings. B, The WT and KO neurons were transfected with the GFP plasmid on 14 DIV and fixed on 18 DIV for GFP immunostaining. Representative images of the whole neurons and dendritic spine area are shown. Scale bars: 10 μm unless denoted. C, Quantification analysis of dendritic spine morphology. Approximately 30 pyramidal neurons in each group (WT, green; KO, red) were collected from three independent cultures and analyzed using the MetaMorph software. The cumulative probability curves of density, length, and width of dendritic spines in each group (∼3000 spines) were plotted and analyzed for the statistical difference between groups using Student's t test.
Figure 7.
Figure 7.
Elevated NMDAR-induced calcium influx in CPEB3 KO neurons. A, Developmental expression of various synaptic proteins in WT and KO neurons. CPEB3 WT and KO neurons obtained at different DIV were harvested for Western blotting. The protein levels of NR1, GluA1, PSD95, CPEB3, and leucine-rich protein (LRP)130 were normalized against β-actin and plotted against DIV. The results from three independent cultures were quantified and displayed as the mean ± SEM. B, WT and KO neurons at 16–17 DIV were subjected to calcium imaging. Several of the KO neurons were infected with the lentivirus expressing myc-CPEB3 on 12–13 DIV for the rescue experiment (KO + myc-CPEB3). The Fura2-AM-loaded neurons were treated as indicated. Representative calcium images before or after NMDA treatment are shown on the left. The change in [Ca2+] influx was monitored by the fluorescence ratio at 340/380 nm (F/F0) and plotted against time. The data obtained from three independent cultures with ∼250–300 neurons in each group were expressed as the mean ± SEM. The statistical difference in [Ca2+] influx induced by NMDA between groups was analyzed using Student's t test. Scale bars: 100 mm.
Figure 8.
Figure 8.
Deletion of CPEB3 resulted in increased total and synaptic protein levels of PSD95 and NMDAR. A, The total homogenates and synaptosomal fractions (synaptic density and synaptic cytosol) were isolated from 3-month-old WT and KO mouse brains (n = 6 in each group) and used for Western blotting analysis. The protein levels of NR1, NR2A, NR2B, GluA1, and PSD95 were normalized against β-actin. Synaptophysin (SVP38) and leucine-rich protein (LRP)130 served as nontarget controls. The quantified data were expressed as the mean ± SEM in the bar graphs. Significant differences between the WT and KO groups are denoted as *p < 0.05 or **p < 0.01, Student's t test. B, The relative expression levels of various RNAs in WT and KO brains were similar. The cortices and hippocampi isolated from the 3-month-old WT and KO mice (4 animals in each genotype) were extracted for RNAs. The total RNAs were then reverse-transcribed and processed for RT-qPCR.
Figure 9.
Figure 9.
CPEB3 binds to the PSD95 RNA and represses its translation. A, RIP. The mouse brain lysate was immunoprecipitated with control or CPEB3 IgG. The precipitated RNAs were reverse transcribed followed by RT-qPCR to determine the relative RNA levels between control and CPEB3 immunoprecipitates. B, The polysomal profiles of WT and CPEB3 KO neurons are shown on the left. The polysomal distribution of GluA1, NR1, NR2A, NR2B, PSD95, and the control GAPDH RNAs in WT and KO neurons was determined by RT-qPCR using RNAs isolated from each fraction and expressed as the percentage of total RNAs summed from all fractions. C, CPEB3 bound to PSD95 3′-UTR. The recombinant maltose binding protein (MBP) fused to the C terminus of CPEB3 RBD (MBP-CPEB3C) was UV-cross-linked with 32P-labeled 3′-UTRs of Arc and PSD95 RNAs, RNase treated, and then analyzed by SDS-PAGE. D, RNA reporter assay. The cultured neurons were transfected with RNAs encoding myc-CPEB3, myc-CPEB3C, or EGFP, in combination with the firefly luciferase appended to the PSD95 3′-UTR and Renilla luciferase. The normalized luciferase activity (firefly/Renilla) was calculated. Four independent results were analyzed and expressed as the mean ± SEM. Asterisks mark the significant difference (Student's t test).
Figure 10.
Figure 10.
Sequence comparison of CPEB family proteins. All CPEB proteins have an N-terminal region (black box) and a C-terminal region (gray box) containing two RNA recognition motifs (RRM) and two zinc fingers (Zif). Among the RBDs, there is considerable identity ranging from 40 to 96%. Mouse CPEBs 2–4 are nearly identical in the RBDs. Mouse CPEB1 (mCPEB1) is closer to Aplysia CPEB (ApCPEB) and Drosophila CPEB (Orb) than it is to mCPEB2; in addition, Drosophila Orb2 is more similar to mCPEBs 2–4 than it is to Orb. Except for CPEBs 2–4, there is little identity (NS, not significant) among the N-terminal regions of the CPEB proteins. Moreover, the Q-rich sequence of variable length (white box) is present in some CPEB proteins.

Similar articles

Cited by

References

    1. Alarcon JM, Hodgman R, Theis M, Huang YS, Kandel ER, Richter JD. Selective modulation of some forms of schaffer collateral-CA1 synaptic plasticity in mice with a disruption of the CPEB-1 gene. Learn Mem. 2004;11:318–327. doi: 10.1101/lm.72704. - DOI - PMC - PubMed
    1. Béïque JC, Lin DT, Kang MG, Aizawa H, Takamiya K, Huganir RL. Synapse-specific regulation of AMPA receptor function by PSD-95. Proc Natl Acad Sci U S A. 2006;103:19535–19540. doi: 10.1073/pnas.0608492103. - DOI - PMC - PubMed
    1. Berger-Sweeney J, Zearfoss NR, Richter JD. Reduced extinction of hippocampal-dependent memories in CPEB knock-out mice. Learn Mem. 2006;13:4–7. doi: 10.1101/lm.73706. - DOI - PubMed
    1. Brigman JL, Wright T, Talani G, Prasad-Mulcare S, Jinde S, Seabold GK, Mathur P, Davis MI, Bock R, Gustin RM, Colbran RJ, Alvarez VA, Nakazawa K, Delpire E, Lovinger DM, Holmes A. Loss of GluN2B-containing NMDA receptors in CA1 hippocampus and cortex impairs long-term depression, reduces dendritic spine density, and disrupts learning. J Neurosci. 2010;30:4590–4600. doi: 10.1523/JNEUROSCI.0640-10.2010. - DOI - PMC - PubMed
    1. Chao HW, Hong CJ, Huang TN, Lin YL, Hsueh YP. SUMOylation of the MAGUK protein CASK regulates dendritic spinogenesis. J Cell Biol. 2008;182:141–155. doi: 10.1083/jcb.200712094. - DOI - PMC - PubMed

Publication types

MeSH terms