. 2013 Oct 23;33(43):17095-107.
doi: 10.1523/JNEUROSCI.0890-13.2013.

Dopamine-dependent compensation maintains motor behavior in mice with developmental ablation of dopaminergic neurons

Affiliations

Dopamine-dependent compensation maintains motor behavior in mice with developmental ablation of dopaminergic neurons

Judith P Golden et al. J Neurosci. .

Abstract

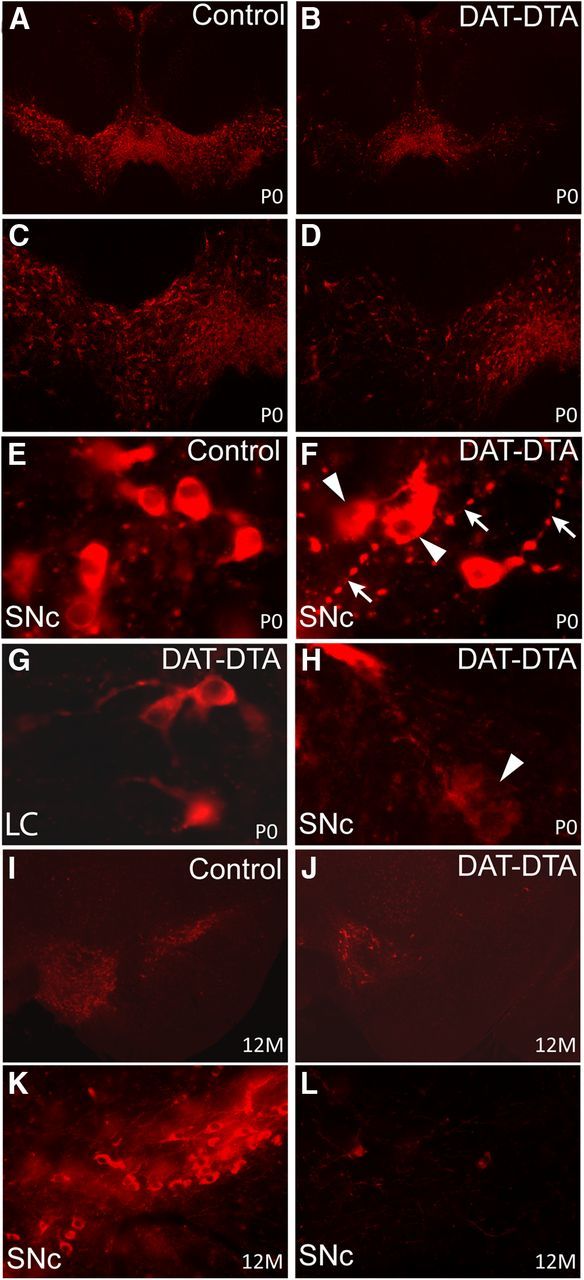
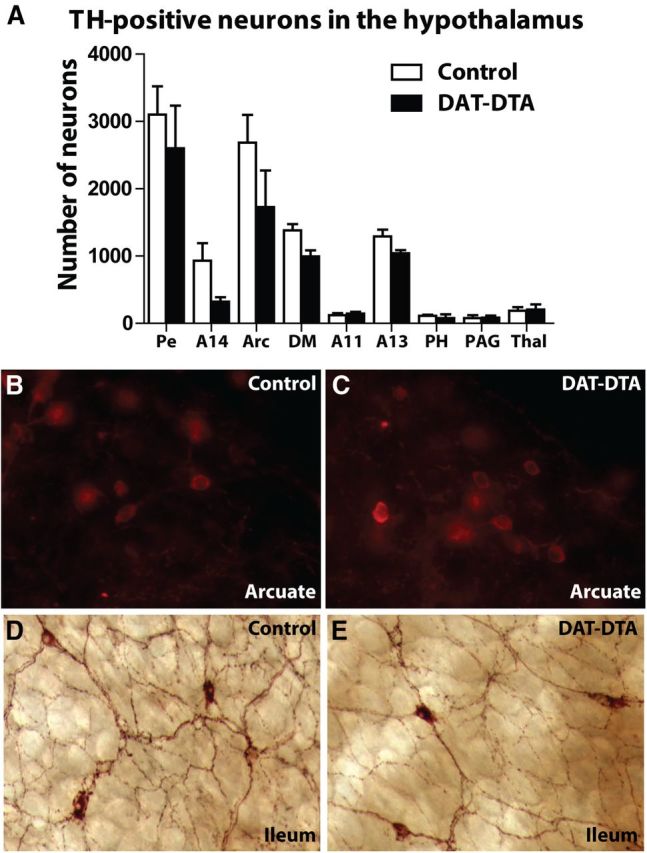
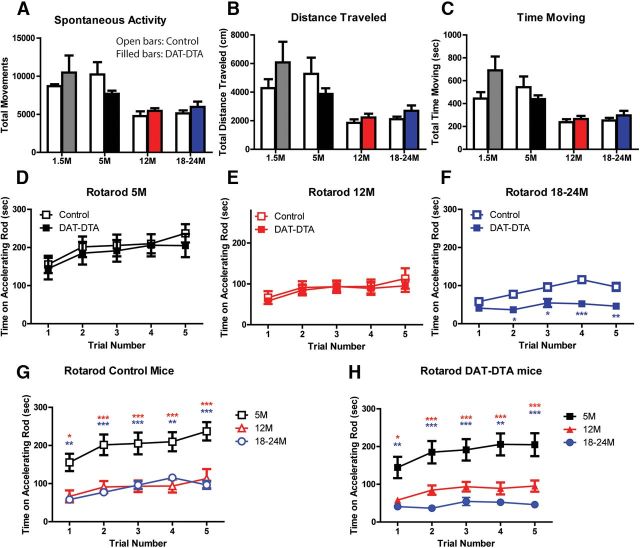
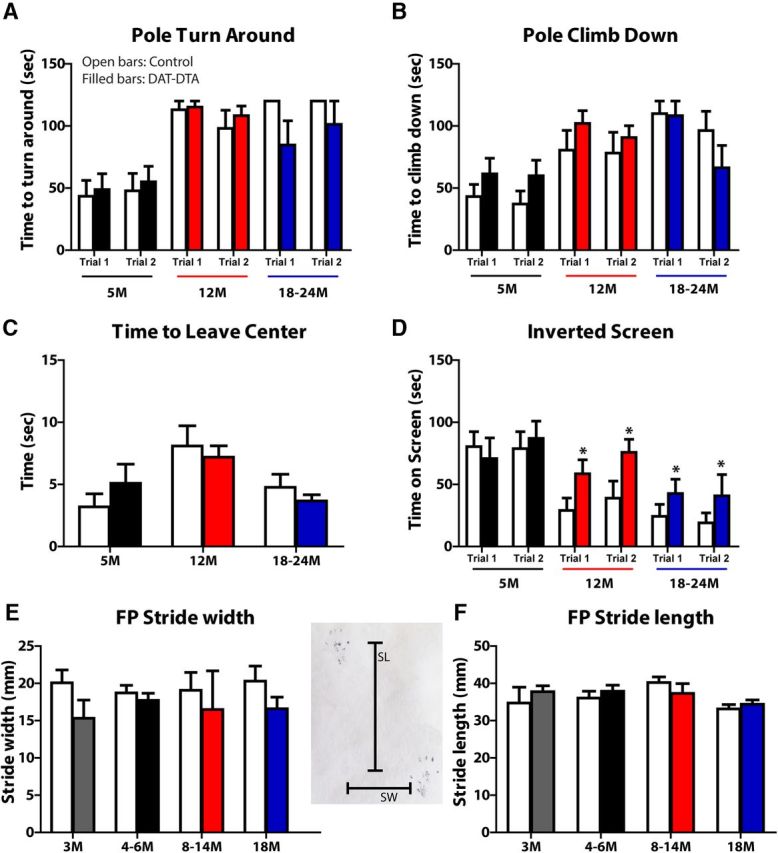
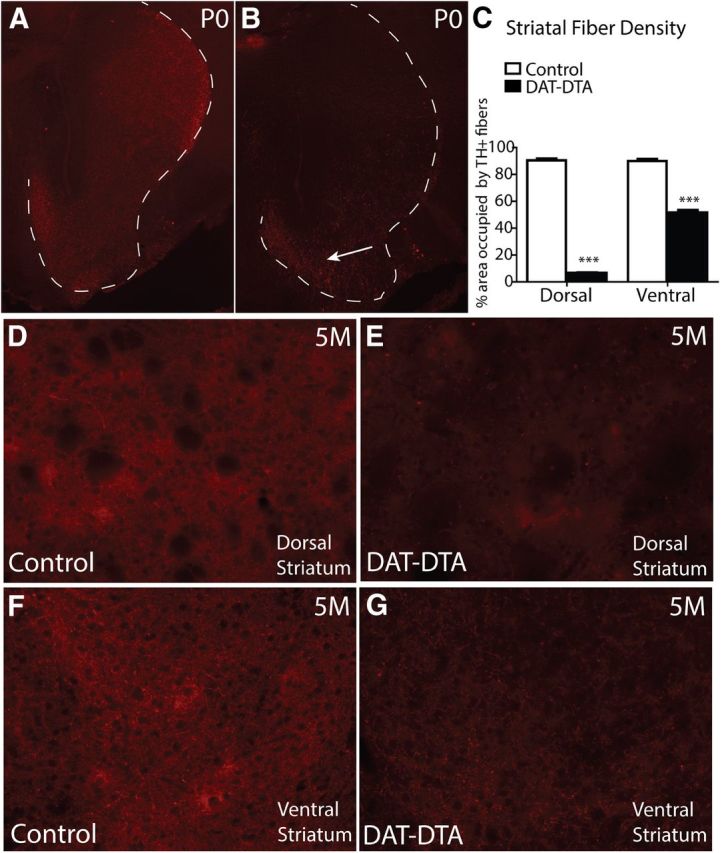
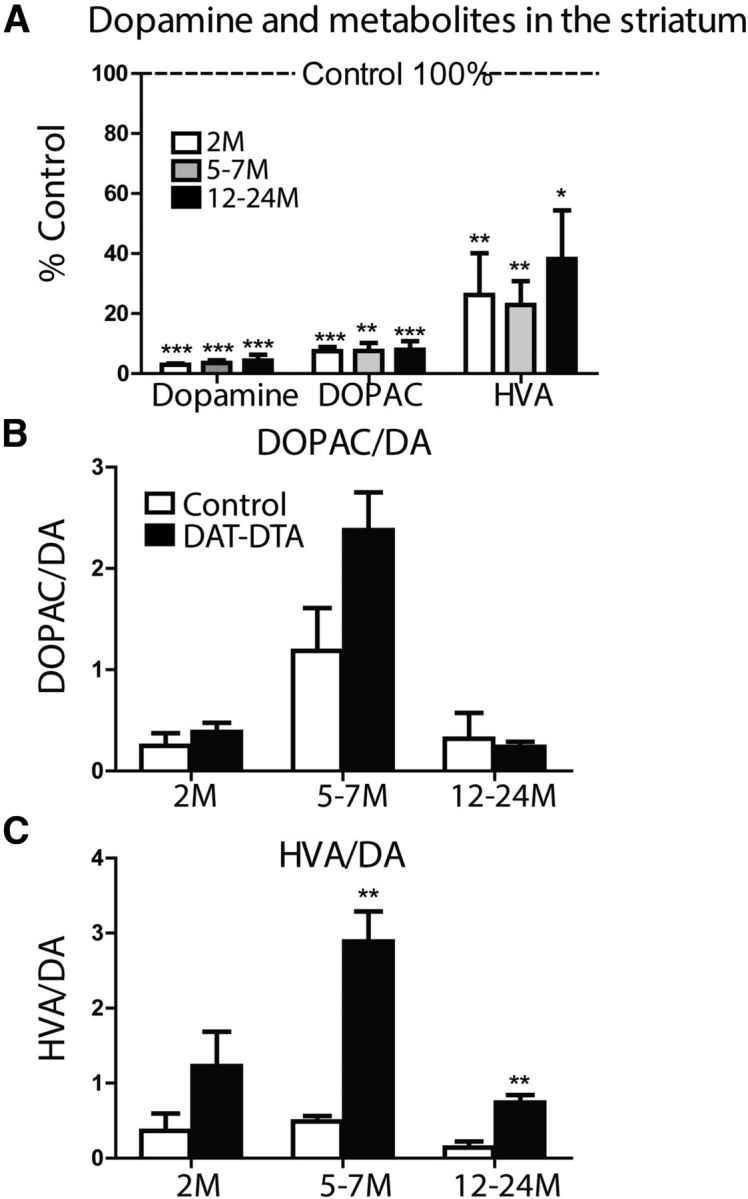
The loss of dopaminergic neurons in the substantia nigra pars compacta (SNc) and consequent depletion of striatal dopamine are known to underlie the motor deficits observed in Parkinson's disease (PD). Adaptive changes in dopaminergic terminals and in postsynaptic striatal neurons can compensate for significant losses of striatal dopamine, resulting in preservation of motor behavior. In addition, compensatory changes independent of striatal dopamine have been proposed based on PD therapies that modulate nondopaminergic circuits within the basal ganglia. We used a genetic strategy to selectively destroy dopaminergic neurons in mice during development to determine the necessity of these neurons for the maintenance of normal motor behavior in adult and aged mice. We find that loss of 90% of SNc dopaminergic neurons and consequent depletion of >95% of striatal dopamine does not result in changes in motor behavior in young-adult or aged mice as evaluated by an extensive array of motor behavior tests. Treatment of aged mutant mice with the dopamine receptor antagonist haloperidol precipitated motor behavior deficits in aged mutant mice, indicating that <5% of striatal dopamine is sufficient to maintain motor function in these mice. We also found that mutant mice exhibit an exaggerated response to l-DOPA compared with control mice, suggesting that preservation of motor function involves sensitization of striatal dopamine receptors. Our results indicate that congenital loss of dopaminergic neurons induces remarkable adaptions in the nigrostriatal system where limited amounts of dopamine in the dorsal striatum can maintain normal motor function.


Figures

Figure 1.
Figure 1.
Dramatic loss of SNc and VTA neurons in DAT-DTA mice. A, Schematic illustrating breeding strategy to produce DAT-DTA mice. B, C, Weight of male and female DAT-DTA and control mice. Female DAT-DTA mice weigh significantly less than control mice at 3–5 and 10–21 months. Male DAT-DTA mice weigh significantly less than control mice at 10–21 months (mean ± SEM, Student's t test, control vs DAT-DTA at each time point; *p < 0.05, **p < 0.01, ***p < 0.001). D, Loss of TH-positive neurons in the ventral midbrain of DAT-DTA mice. The number of TH-positive neurons is significantly decreased in the SNc and VTA of DAT-DTA mice compared with control mice at all ages studied (mean ± SEM, Student's t test, control vs DAT-DTA at each time point; *p < 0.05, **p < 0.01, ***p < 0.001). P0, N = 3 of each genotype; 1.5 months, N = 2 of each genotype; 5 months, N = 4 of each genotype; 12 months, N = 3 of each genotype. E, F, Nissl-labeled coronal brain sections from 5-month-old mice showing large neurons in the SNc of control mice (E, arrows). These large neurons are absent in the SNc of DAT-DTA mice (F, arrows).
Figure 2.
Figure 2.
Loss of TH-positive neurons in the ventral midbrain of DAT-DTA mice. A–D, Fewer TH-positive neurons are observed in the SNc and VTA of DAT-DTA mice at P0 compared with control mice. TH-positive neuron loss is less severe in the VTA at this age. E, F, H, At P0, TH-positive neurons in the SNc of DAT-DTA mice (F, H) appear abnormal compared with neurons in the SNc of control mice (E). TH-positive neurons in the SNc of DAT-DTA mice (F, H) appear to be actively degenerating (arrowheads) and have neurites with large varicose swellings (F, arrows). G, TH-positive neurons in the locus ceruleus (LC) of DAT-DTA mice have a normal appearance. I–L, At 12 months of age, fewer TH-positive neurons are observed in the SNc and VTA of DAT-DTA mice compared with control mice. TH-positive neuron loss appears to be more severe at 12 months compared with P0 in both the SNc and VTA of DAT-DTA mice.
Figure 3.
Figure 3.
Dopaminergic neurons are normal in the hypothalamus and ileum of DAT-DTA mice. A, Counts of TH-positive neurons in the nuclei of the hypothalamus reveal no significant differences in neuron number between 5-month-old control mice and DAT-DTA mice. Pe, Periventricular and paraventricular nucleus; Arc, arcuate nucleus; DM, dorsomedial nucleus; PH, posterior hypothalamus; PAG, periaqueductal gray; Thal, dorsal thalamus (mean ± SEM, Student's t test, p > 0.05; N = 3 control mice, N = 3 DAT-DTA mice). B, C, TH-positive neurons in the arcuate nucleus of 5-month-old control mice (B) and DAT-DTA mice (C) appear similar. D, E, TH-positive neurons in the ileum of control mice (D) and DAT-DTA mice (E) appear similar in morphology and density. Representative images are from one of three control and one of three DAT-DTA mice examined.
Figure 4.
Figure 4.
DAT-DTA mice do not show motor behavior deficits compared with control mice. A–C, Open-field test: DAT-DTA mice are not significantly different from control mice at any age studied (mean ± SEM, 2-Way ANOVA, Bonferroni post-test, p > 0.05). Control mice at 1.5 months exhibit significantly greater locomotor activity compared with 12-month-old control mice (distance, time, activity, p < 0.05). DAT-DTA mice an 1.5 months exhibit significantly greater locomotor activity compared with 12-month-old DAT-DTA mice (distance, time, p < 0.001; activity, p < 0.01). Control mice at 1.5 months exhibit significantly greater locomotor activity compared with 18–24-month-old control mice (activity, p < 0.05). DAT-DTA mice at 1.5 months exhibit significantly greater locomotor activity compared with 18–24-month-old DAT-DTA mice (distance, p < 0.01; time, p < 0.001; activity, p < 0.05). Control mice at 5 months exhibit significantly greater locomotor activity compared with 12-month-old control mice (distance, time, activity, p < 0.001). DAT-DTA mice at 5 months exhibit significantly greater locomotor activity compared with 12-month-old DAT-DTA mice (time, p < 0.05). Control mice at 5 months exhibit significantly greater locomotor activity compared with 18–24-month-old control mice (distance, time, activity, p < 0.001). Two-way ANOVA, Bonferroni post-test was used for all the above comparisons. Five months, N = 9 control mice, 8 DAT-DTA mice; 12 months: N = 9 control mice, 12 DAT-DTA mice; 18–24 months: N = 8 control mice, 6 DAT-DTA mice. D–H, Rotarod test: two-way ANOVA, Bonferroni post-test was used for all the following comparisons. Performance on the Rotarod is not different for DAT-DTA mice compared with control mice at 5 or 12 months (D, E, p > 0.05). At 18–24 months, the performance of DAT-DTA mice is significantly less than control mice in Trials 2–5 (F, *p < 0.05, **p < 0.01, ***p < 0.001). At 18–24 months, the performance of control mice is significantly better in Trials 3–5 compared with Trial 1 (F, Trial 1 vs 3, p < 0.01; Trial 1 vs 4, p < 0.001; Trial 1 vs 5, p < 0.01). The performance of 18–24-month-old DAT-DTA mice is not significantly different between any of the five trials (F, p > 0.05). Five-month-old control mice perform significantly better than 12 or 18–24 month control mice. Five month DAT-DTA mice perform significantly better than 12 or 18–24 month DAT-DTA mice (G, H, *p < 0.05, **p < 0.01, ***p < 0.001). Five months: N = 13 control mice, 12 DAT-DTA mice; 12 months: N = 9 control mice, 12 DAT-DTA mice; 18–24 months: N = 11 control mice, 6 DAT-DTA mice.
Figure 5.
Figure 5.
Motor behavior and gait are not impaired in DAT-DTA mice compared with control mice. A, B, Pole test: performance in the pole test is not different in DAT-DTA mice compared with control mice at any age studied (mean ± SEM. Student's t test). There is an age-dependent decrease in performance on the pole test in both DAT-DTA and control mice (2-Way ANOVA, Bonferroni post-test). Pole turn around (A): control mice: 5 vs 12 months, Trial 1: p < 0.001; Trial 2: p < 0.05; 5 vs 18–24 months, Trial 1: p < 0.001; Trial 2: p < 0.001. DAT-DTA mice: 5 vs 12 months, Trial 1: p < 0.001; Trial 2: p < 0.01; 5 vs 18–24 months, Trial 1: p > 0.05; Trial 2: p < 0.05. Pole climb down (B): control mice: 5 vs 12 months, Trial 1: p > 0.05; Trial 2: p > 0.05; 5 vs 18–24 months, Trial 1: p < 0.001; Trial 2: p < 0.01. DAT-DTA mice: 5 vs 12 months, Trial 1: p < 0.05; Trial 2: p > 0.05; 5 vs 18–24 months, Trial 1: p < 0.05; Trial 2: p > 0.05. Five months: N = 13 control mice, N = 12 DAT-DTA mice; 12 months: N = 9 control mice, N = 12 DAT-DTA mice; 18–24 months: N = 8 control mice, N = 6 DAT-DTA mice. C, Movement-initiation test: movement initiation is not significantly different in DAT-DTA mice compared with control mice at any age studied (mean ± SEM, Student's t test, p > 0.05). Five months: N = 9 control mice, N = 7 DAT-DTA mice; 12 months: N = 9 control mice, N = 12 DAT-DTA mice; 18–24 months: N = 8 control mice, N = 6 DAT-DTA mice. D, Inverted screen test: at 5 months, time on an inverted screen is not different in DAT-DTA mice compared with control mice (mean ± SEM, Student's t test, p > 0.05). At 12 and 18–24 months DAT-DTA mice remain on an inverted screen significantly longer than control mice (mean ± SEM, Student's t test, *p < 0.05). There is an age-dependent decrease in performance on the inverted screen test in control mice: Trial 1: 5 vs 12 months, p < 0.01; 5 vs 18–24 months, p < 0.01; Trial 2: 5 vs 12 months, p > 0.05; 5 vs 18–24 months, p < 0.01 (mean ± SEM, 2-Way ANOVA, Bonferroni post-test). Five months: N = 9 control mice, N = 7 DAT-DTA mice; 12 months: N = 9 control mice, N = 12 DAT-DTA mice; 18–24 months, N = 7 control mice, N = 6 DAT-DTA mice. E, F, Footprint test: there is no difference in SW or SL between DAT-DTA mice and control mice at any age studied (mean ± SEM, Student's t test, p > 0.05). Three months: N = 5 control mice, N = 4 DAT-DTA mice; 4–6 months: N = 8 control mice, N = 8 DAT-DTA mice; 8–14 months: N = 4 control mice, N = 3 DAT-DTA mice; 18 months: N = 6 control mice, N = 3 DAT-DTA mice.
Figure 6.
Figure 6.
Loss of TH-positive fibers in the dorsal and ventral striatum of DAT-DTA mice. A, B, At P0, TH-positive fibers are decreased in the dorsal striatum of DAT-DTA mice compared with control mice. TH-positive fiber density is less affected in the ventral striatum of DAT-DTA mice (B, arrow). The white dotted line in A and B outlines the area of the dorsal and ventral striatum. C, Quantification of TH-positive fiber density in the striatum of 5-month-old mice reveals a significant decrease in fiber density in both the dorsal and ventral striatum of DAT-DTA mice compared with control mice (mean ± SEM, Student's t test, ***p < 0.001). N = 3 control mice, N = 3 DAT-DTA mice. D–G, Representative images used for quantifying fiber density showing decreased TH-positive fiber density in both the dorsal and ventral striatum of DAT-DTA mice compared with control mice.
Figure 7.
Figure 7.
Dopamine, DOPAC, and HVA are depleted in the dorsal striatum of DAT-DTA mice. A, Dopamine, DOPAC, and HVA are decreased in the dorsal striatum of DAT-DTA mice compared with control mice at all ages studied (mean ± SEM, Student's t test, control vs DAT-DTA at each time point; *p < 0.05, **p < 0.01, ***p < 0.001). B, The ratio of DOPAC to dopamine is not significantly different between DAT-DTA mice and control mice at any age studied (mean ± SEM, Student's t test, p > 0.05). C, The ratio of HVA to dopamine is significantly increased in DAT-DTA mice compared with control mice at 5–7 and 12–24 months of age (mean ± SEM, Student's t test, **p < 0.01). Two months: N = 5 of each genotype; 5–7 months: N = 3 of each genotype; 12–24 months: N = 5 control mice, 4 DAT-DTA mice.
Figure 8.
Figure 8.
DAT-DTA mice are sensitive to haloperidol and hypersensitive to l-DOPA. A, Haloperidol (1 mg/kg) significantly decreases locomotor activity in both DAT-DTA mice and control mice at 12 months of age. Locomotor activity is not significantly different in haloperidol-treated DAT-DTA mice compared with haloperidol-treated control mice. The time required to exit an 18 × 18 cm square is significantly increased in haloperidol-treated DAT-DTA mice and haloperidol-treated control mice compared with vehicle-treated control mice. Exit time is not significantly different in haloperidol-treated DAT-DTA mice compared with haloperidol-treated control mice. Mean ± SEM, Student's t test, control vs DAT-DTA, *p < 0.05, **p < 0.01, ***p < 0.001. Control mice/DMSO, N = 2; control mice/haloperidol, N = 7; DAT-DTA mice/haloperidol, N = 7. B, The locomotor activity of l-DOPA-treated control mice is not significantly different from vehicle-treated control mice. The locomotor activity of l-DOPA-treated DAT-DTA mice is significantly increased compared with l-DOPA-treated control mice. The time required to exit an 18 × 18 cm square is not significantly different in l-DOPA-treated DAT-DTA mice compared with l-DOPA-treated control mice. Mean ± SEM, Student's t test, control vs DAT-DTA, *p ≤ 0.05, **p < 0.01, ***p < 0.001. Control mice/vehicle, N = 4; control mice/l-DOPA, N = 5; DAT-DTA mice/l-DOPA, N = 7.

References

    1. Archer T, Danysz W, Fredriksson A, Jonsson G, Luthman J, Sundström E, Teiling A. Neonatal 6-hydroxydopamine-induced dopamine depletions: motor activity and performance in maze learning. Pharmacology, biochemistry, and behavior. 1988;31:357–364. doi: 10.1016/0091-3057(88)90358-9. - DOI - PubMed
    1. Bakos J, Duncko R, Makatsori A, Pirnik Z, Kiss A, Jezova D. Prenatal immune challenge affects growth, behavior, and brain dopamine in offspring. Ann N Y Acad Sci. 2004;1018:281–287. doi: 10.1196/annals.1296.033. - DOI - PubMed
    1. Barlow BK, Cory-Slechta DA, Richfield EK, Thiruchelvam M. The gestational environment and Parkinson's disease: evidence for neurodevelopmental origins of a neurodegenerative disorder. Reprod Toxicol. 2007;23:457–470. doi: 10.1016/j.reprotox.2007.01.007. - DOI - PubMed
    1. Blandini F, Armentero MT. Animal models of Parkinson's disease. FEBS J. 2012;279:1156–1166. doi: 10.1111/j.1742-4658.2012.08491.x. - DOI - PubMed
    1. Bové J, Perier C. Neurotoxin-based models of Parkinson's disease. Neuroscience. 2012;211:51–76. doi: 10.1016/j.neuroscience.2011.10.057. - DOI - PubMed

Publication types

MeSH terms