. 2014 Jan 1;127(Pt 1):240-9.
doi: 10.1242/jcs.140038. Epub 2013 Oct 23.

Actin network disassembly powers dissemination of Listeria monocytogenes

Affiliations

Actin network disassembly powers dissemination of Listeria monocytogenes

Arthur M Talman et al. J Cell Sci. .

Abstract

Several bacterial pathogens hijack the actin assembly machinery and display intracellular motility in the cytosol of infected cells. At the cell cortex, intracellular motility leads to bacterial dissemination through formation of plasma membrane protrusions that resolve into vacuoles in adjacent cells. Here, we uncover a crucial role for actin network disassembly in dissemination of Listeria monocytogenes. We found that defects in the disassembly machinery decreased the rate of actin tail turnover but did not affect the velocity of the bacteria in the cytosol. By contrast, defects in the disassembly machinery had a dramatic impact on bacterial dissemination. Our results suggest a model of L. monocytogenes dissemination in which the disassembly machinery, through local recycling of the actin network in protrusions, fuels continuous actin assembly at the bacterial pole and concurrently exhausts cytoskeleton components from the network distal to the bacterium, which enables membrane apposition and resolution of protrusions into vacuoles.

Keywords: AIP1; ARP2/3; Actin assembly; Actin network disassembly; CFL1; GMFB; Listeria; WDR1.


Figures

Fig. 1.
Fig. 1.
Computer-assisted image analysis of L. monocytogenes spread from cell to cell. (A) Representative examples of infection foci for mock-treated and Cytochalasin D (Cyto D) treatments (250 and 500 nM) 8 hours after infection, inhibitors were added 1 hour post-infection. (B) Titration experiments with two inhibitors of actin assembly (cytochalasin D or Latrunculin B) showing the effect of inhibitor concentration and spreading index.
Fig. 2.
Fig. 2.
RNAi screen for host factors involved in L. monocytogenes dissemination. (A) Images of infection foci in mock-treated (MOCK), and ARPC4-, CAPZB- and AIP1-depleted cells, after 8 hours of infection with GFP-expressing L. monocytogenes (green) and stained with DAPI (red). (B) Quantification of spreading index in cells transfected with four independent siRNA duplexes (labeled A, B, C and D) targeting ARPC4, CAPZB or AIP1. Data are presented as mean±s.e.m. of three independent experiments. The dashed line indicates the threshold corresponding to 2 s.d. units. (C,D) Length of actin tails (C), and proportion of actin-associated bacteria (D) (supplementary material Fig. S2) in the cytosol of cells in which the disassembly components, cofilin-1 (CFL1) and AIP1 have been depleted alone or in combination (Tail length: MOCK vs AIP1, P = 0.0043; MOCK vs CFL1, P = 0.0033; AIP1 versus AIP1+ CFL1, P = 0.00298; CFL1 versus AIP1+CFL1, P = 0.0356; Mann–Whitney U test). (E) Cytosolic velocity of bacteria (MOCK versus AIP1, P = 0.7431; MOCK versus CFL1, P = 0.7791; AIP1 versus AIP1+CFL1, P = 0.2131; CFL1 versus AIP1+CFL1, P = 0.4731; Mann–Whitney U test) (F) Cells were co-transfected with constructs expressing GFP–AIP1 or CFL1–GFP, and infected with CFP-expressing L. monocytogenes. AIP1 and CFL1 are enriched in the cytosolic tail. *P≤0.05; **P≤0.01; ***P≤0.001.
Fig. 3.
Fig. 3.
Function and localization of AIP1 and CFL1 in protrusions. (A) Velocity of elongating protrusions in mock-treated (MOCK), and ARPC4-, CAPZB- and AIP1-depleted cells (MOCK versus AIP1, P = 0.0202. MOCK versus CFL1, P = 0.2985. AIP1 versus AIP1+CFL1, P = 0.0309. CFL1 versus AIP1+CFL1, P<0.0001; Mann–Whitney U test). (B) Proportion of bacteria found in protrusions, vacuoles or free in the cytosol of neighboring cells as shown in supplementary material Fig. S3B. Cells were either mock-treated or AIP1+CFL1-depleted, in addition AIP1-depleted cells were transfected with siRNA-resistant rescue constructs expressing wild type (AIP1 +AIPWT) or depolymerization-deficient AIP1 (AIP1+AIPmut). Data are representative of three independent experiments. Proportion of protrusions: MOCK versus AIP1, P = 0.0001; MOCK versus CFL1, P = 0.2380; AIP1 versus AIP1+CFL1, P = 0.0001; AIP1 versus AIP1+AIPWT, P = 0.0001; AIP1+AIPWT versus AIP1+AIPmut, P = 0.0004. Proportion of free bacteria in secondary cell: MOCK versus AIP1, P<0.0001; MOCK versus CFL1, P = 0.2270; AIP1 versus AIP1+CFL1, P<0.0001; AIP1 versus AIP1+AIPWT, P = 0.0032; AIP1+AIPWT versus AIP1+AIPmut, P = 0.0064. All P-values are calculated using the Mann–Whitney U test. (C) Schematic representation of the AIP-1 protein. Red boxes represent WD40 domains. The position of amino acids that were mutagenized in the depolymerization-deficient mutant form of AIP1 are marked by a yellow star. (D,E) Cells were co-transfected with constructs expressing (D) membrane-targeted CFP and GFP–AIP1 or (E) membrane-targeted CFP and CFL1–GFP, and infected with CFP-expressing L. monocytogenes. AIP1 and CFL1 are enriched in the protrusion when the sending cells is transfected (white arrows). AIP1 and CFL1 are not enriched on the protrusion when the receiving cell is transfected (red arrows). Scale bars: 2 µm. *P≤0.05; **P≤0.01; ***P≤0.001.
Fig. 4.
Fig. 4.
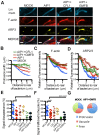
Structural and dynamic organization of the actin network in cytosolic tails and protrusions. (A) Representative images of the actin tail and protrusion formed in cells transfected with a membrane-targeted CFP-expressing construct and infected for 4 hours with CFP-expressing L. monocytogenes. Cells were stained for F-actin (red) and ARP3 (yellow). Scale bars: 2 µm. (B,C) Distribution of ARP3–GFP or YFP–actin independently assessed in cytosolic tails (B) or in elongating protrusions (>0.01 µm/second) (C), as determined by time-lapse microscopy. Data are mean±s.e.m. (D) Dynamics of ARP3–GFP in cells transfected with membrane-targeted CFP constructs and infected for 4 hours with CFP-expressing L. monocytogenes. Gray and white arrowheads mark a reference point on the stationary (left) and elongating (right) protrusions, respectively. Scale bar: 2 µm. (E) Replica electron micrograph of a L. monocytogenes (Lm)-induced protrusion; insets display the filament organization in the proximal (blue) and distal (red) networks. Scale bars: 200 nm (main), 50 nm (insets).
Fig. 5.
Fig. 5.
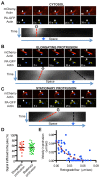
Disassembly of the distal network in L. monocytogenes protrusions fuels actin assembly at the bacterial pole. (A–C) Time-lapse imaging of photo-activation of β-actin fused to mCherry and photo-activatable GFP in a cytosolic tail (A), an elongating protrusion (B) and a stationary protrusion (C). White arrows indicate the site of photo-activation and blue arrows indicate the initial position of the bacterial pole. Scale bar: 2 µm. Kymographs represent the evolution of the photo-activated signal over space (x-axis) and time (y-axis). Red dashed lines indicate the progression of the signal from the initial site of photo-activation and black dashed lines indicate the signal evolution at the bacterial pole. (D) Percentage of the initial photo-activated signal trafficked to the bacterial pole after 35 seconds in elongating and stationary protrusions (<0.01 µm/s) (stationary versus elongating, P = 0.6097, Mann–Whitney U test). (E) Negative correlation of elongation rate and retrograde flow in protrusions (R = −0.7375, P<0.0001, Spearman's rank correlation).
Fig. 6.
Fig. 6.
Role of AIP1, CFL1 and GMFB in L. monocytogenes protrusions. (A) Representative images of protrusions formed in mock-treated (MOCK), and AIP1-, AIP1+CFL1- or AIP1+GMFB-depleted cells transfected with a membrane-targeted CFP-expressing construct and infected for 4 hours with CFP-expressing L. monocytogenes. Scale bars: 2 µm. (B–D) Width of protrusions (B), distribution of F-actin (C) and ARP2/3 (D) in protrusions as shown in A. Data are mean±s.e.m. (E) Percentage of signal disappearance of initial photo-activated signal after 35 seconds in mock-treated, AIP1-, AIP1+CFL1- or AIP1+GMFB-depleted cells (MOCK versus AIP1, P = 0.0016; AIP1 versus AIP1+CFL1, P = 0.0077; AIP1 versus AIP1+GMFB, P = 0.0365; Mann–Whitney U test). (F) Percentage of the initial photo-activated signal trafficked to the bacterial pole after 35 seconds in Mock-treated, AIP1-, AIP1+CFL1- or AIP1+GMFB-depleted cells (AIP1 versus MOCK, P<0.0001; AIP1 versus AIP1+CFL1, P<0.0001; AIP1 versus AIP1+GMFB, P = 0.0005; Mann–Whitney U test). (G) Proportion of bacteria found in protrusions, vacuoles or free in the cytosol of neighboring cells. Proportion of protrusions: AIP1 versus AIP1+GMFB, P = 0.0016. Proportion of free bacteria in secondary cell: AIP1 versus AIP1+GMFB, P<0.0001. All P-values are calculated using the Mann–Whitney U test. *P≤0.05; **P≤0.01; ***P≤0.001.
Fig. 7.
Fig. 7.
Model of local recycling of the actin network in L. monocytogenes protrusions. (A) Components of the AIP1-dependent disassembly machinery (CFL1, GMFB, TWF2 and CAP1) whose depletion enhances the spreading defect phenotype displayed by AIP1-depleted cells. (B) The bacterial factor ActA (green dots) promotes the nucleation activity of the ARP2/3 complex (red dots), which leads to the assembly of a branched network at the bacterial pole (blue lines and red dots). As protrusions elongate, the AIP1-dependent disassembly machinery recycles G-actin and ARP2/3 from the distal network, which fuels continuous F-actin assembly at the bacterial pole (red arrow). (C) The life cycle of protrusions can be divided in four phases: (1) Emerging protrusions, actin assembly propels the cytosolic bacterium against the plasma membrane, which protrudes into the adjacent cell; (2) elongating protrusions, as protrusions elongate, the disassembly machinery recycles the distal network thereby fuelling further assembly at the bacterial pole in this confined system; (3) stationary protrusions, as the recycling process exhausts the cytoskeleton components from the distal region of protrusions, protrusions become stationary, and continuous actin assembly results in retrograde flow; and (4) protrusion-to-vacuole transition, complete exhaustion of the cytoskeleton components from the distal network allows for membrane apposition in the distal region of protrusions. Continuous generation of forces due to actin assembly and retrograde flow leads to membrane disruption and resolution of the protrusion into a double-membrane vacuole.

References

    1. Andersen J. B., Roldgaard B. B., Lindner A. B., Christensen B. B., Licht T. R. (2006). Construction of a multiple fluorescence labelling system for use in co-invasion studies of Listeria monocytogenes. BMC Microbiol. 6, 86 10.1186/1471-2180-6-86 - DOI - PMC - PubMed
    1. Brieher W. M., Kueh H. Y., Ballif B. A., Mitchison T. J. (2006). Rapid actin monomer-insensitive depolymerization of Listeria actin comet tails by cofilin, coronin, and Aip1. J. Cell Biol. 175, 315–324 10.1083/jcb.200603149 - DOI - PMC - PubMed
    1. Chaudhry F., Breitsprecher D., Little K., Sharov G., Sokolova O., Goode B. L. (2013). Srv2/cyclase-associated protein forms hexameric shurikens that directly catalyze actin filament severing by cofilin. Mol. Biol. Cell 24, 31–41 10.1091/mbc.E12-08-0589 - DOI - PMC - PubMed
    1. Chong R., Squires R., Swiss R., Agaisse H. (2011). RNAi screen reveals host cell kinases specifically involved in Listeria monocytogenes spread from cell to cell. PLoS ONE 6, e23399 10.1371/journal.pone.0023399 - DOI - PMC - PubMed
    1. Domann E., Wehland J., Rohde M., Pistor S., Hartl M., Goebel W., Leimeister-Wächter M., Wuenscher M., Chakraborty T. (1992). A novel bacterial virulence gene in Listeria monocytogenes required for host cell microfilament interaction with homology to the proline-rich region of vinculin. EMBO J. 11, 1981–1990 - PMC - PubMed

Publication types

MeSH terms