Resistance to infection, early and persistent suppression of simian immunodeficiency virus SIVmac251 viremia, and significant reduction of tissue viral burden after mucosal vaccination in female rhesus macaques
- PMID: 24155376
- PMCID: PMC3911749
- DOI: 10.1128/JVI.02523-13
Resistance to infection, early and persistent suppression of simian immunodeficiency virus SIVmac251 viremia, and significant reduction of tissue viral burden after mucosal vaccination in female rhesus macaques
Abstract
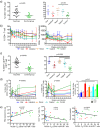
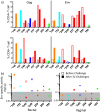
The efficacy of oral, intestinal, nasal, and vaginal vaccinations with DNA simian immunodeficiency virus (SIV)/interleukin-2 (IL-2)/IL-15, SIV Gag/Pol/Env recombinant modified vaccinia virus Ankara (rMVA), and AT-2 SIVmac239 inactivated particles was compared in rhesus macaques after low-dose vaginal challenge with SIVmac251. Intestinal immunization provided better protection from infection, as a significantly greater median number of challenges was necessary in this group than in the others. Oral and nasal vaccinations provided the most significant control of disease progression. Fifty percent of the orally and nasally vaccinated animals suppressed viremia to undetectable levels, while this occurred to a significantly lower degree in intestinally and vaginally vaccinated animals and in controls. Viremia remained undetectable after CD8(+) T-cell depletion in seven vaccinated animals that had suppressed viremia after infection, and tissue analysis for SIV DNA and RNA was negative, a result consistent with a significant reduction of viral activity. Regardless of the route of vaccination, mucosal vaccinations prevented loss of CD4(+) central memory and CD4(+)/α4β7(+) T-cell populations and reduced immune activation to different degrees. None of the orally vaccinated animals and only one of the nasally vaccinated animals developed AIDS after 72 to 84 weeks of infection, when the trial was closed. The levels of anti-SIV gamma interferon-positive, CD4(+), and CD8(+) T cells at the time of first challenge inversely correlated with viremia and directly correlated with protection from infection and longer survival.
Figures


Similar articles
-
Long-term control of simian immunodeficiency virus mac251 viremia to undetectable levels in half of infected female rhesus macaques nasally vaccinated with simian immunodeficiency virus DNA/recombinant modified vaccinia virus Ankara.J Immunol. 2011 Mar 15;186(6):3581-93. doi: 10.4049/jimmunol.1002594. Epub 2011 Feb 11. J Immunol. 2011. PMID: 21317390
-
ALVAC-SIV-gag-pol-env-based vaccination and macaque major histocompatibility complex class I (A*01) delay simian immunodeficiency virus SIVmac-induced immunodeficiency.J Virol. 2002 Jan;76(1):292-302. doi: 10.1128/jvi.76.1.292-302.2002. J Virol. 2002. PMID: 11739694 Free PMC article.
-
Control of simian/human immunodeficiency virus viremia and disease progression after IL-2-augmented DNA-modified vaccinia virus Ankara nasal vaccination in nonhuman primates.J Immunol. 2004 Mar 15;172(6):3745-57. doi: 10.4049/jimmunol.172.6.3745. J Immunol. 2004. PMID: 15004179
-
Immunogenicity of a vaccine regimen composed of simian immunodeficiency virus DNA, rMVA, and viral particles administered to female rhesus macaques via four different mucosal routes.J Virol. 2013 Apr;87(8):4738-50. doi: 10.1128/JVI.03531-12. Epub 2013 Feb 13. J Virol. 2013. PMID: 23408627 Free PMC article.
-
CD8 T Cells Show Protection against Highly Pathogenic Simian Immunodeficiency Virus (SIV) after Vaccination with SIV Gene-Expressing BCG Prime and Vaccinia Virus/Sendai Virus Vector Boosts.J Virol. 2021 Jan 28;95(4):e01718-20. doi: 10.1128/JVI.01718-20. Print 2021 Jan 28. J Virol. 2021. PMID: 33087465 Free PMC article.
Cited by
-
Direct intranodal tonsil vaccination with modified vaccinia Ankara vaccine protects macaques from highly pathogenic SIVmac251.Nat Commun. 2023 Mar 7;14(1):1264. doi: 10.1038/s41467-023-36907-0. Nat Commun. 2023. PMID: 36882405 Free PMC article.
-
Mucosal Vaccine Approaches for Prevention of HIV and SIV Transmission.Curr Immunol Rev. 2019;15(1):102-122. doi: 10.2174/1573395514666180605092054. Curr Immunol Rev. 2019. PMID: 31452652 Free PMC article.
-
A simultaneous oral and intramuscular prime/sublingual boost with a DNA/Modified Vaccinia Ankara viral vector-based vaccine induces simian immunodeficiency virus-specific systemic and mucosal immune responses in juvenile rhesus macaques.J Med Primatol. 2018 Oct;47(5):288-297. doi: 10.1111/jmp.12372. Epub 2018 Sep 11. J Med Primatol. 2018. PMID: 30204253 Free PMC article.
-
Oral Coadministration of an Intramuscular DNA/Modified Vaccinia Ankara Vaccine for Simian Immunodeficiency Virus Is Associated with Better Control of Infection in Orally Exposed Infant Macaques.AIDS Res Hum Retroviruses. 2019 Mar;35(3):310-325. doi: 10.1089/AID.2018.0180. Epub 2018 Nov 27. AIDS Res Hum Retroviruses. 2019. PMID: 30303405 Free PMC article.
-
Vector Order Determines Protection against Pathogenic Simian Immunodeficiency Virus Infection in a Triple-Component Vaccine by Balancing CD4+ and CD8+ T-Cell Responses.J Virol. 2017 Nov 14;91(23):e01120-17. doi: 10.1128/JVI.01120-17. Print 2017 Dec 1. J Virol. 2017. PMID: 28904195 Free PMC article.
References
-
- Rerks-Ngarm S, Pitisuttithum P, Nitayaphan S, Kaewkungwal J, Chiu J, Paris R, Premsri N, Namwat C, de Souza M, Adams E, Benenson M, Gurunathan S, Tartaglia J, McNeil JG, Francis DP, Stablein D, Birx DL, Chunsuttiwat S, Khamboonruang C, Thongcharoen P, Robb ML, Michael NL, Kunasol P, Kim JH. 2009. Vaccination with ALVAC and AIDSVAX to prevent HIV-1 infection in Thailand. N. Engl. J. Med. 361:2209–2220. 10.1056/NEJMoa0908492 - DOI - PubMed
-
- de Souza MS, Ratto-Kim S, Chuenarom W, Schuetz A, Chantakulkij S, Nuntapinit B, Valencia-Micolta A, Thelian D, Nitayaphan S, Pitisuttithum P, Paris RM, Kaewkungwal J, Michael NL, Rerks-Ngarm S, Mathieson B, Marovich M, Currier JR, Kim JH. 2012. The Thai phase III trial (RV144) vaccine regimen induces T cell responses that preferentially target epitopes within the V2 region of HIV-1 envelope. J. Immunol. 188:5166–5176. 10.4049/jimmunol.1102756 - DOI - PMC - PubMed
-
- Haynes BF, Gilbert PB, McElrath MJ, Zolla-Pazner S, Tomaras GD, Alam SM, Evans DT, Montefiori DC, Karnasuta C, Sutthent R, Liao HX, DeVico AL, Lewis GK, Williams C, Pinter A, Fong Y, Janes H, DeCamp A, Huang Y, Rao M, Billings E, Karasavvas N, Robb ML, Ngauy V, de Souza MS, Paris R, Ferrari G, Bailer RT, Soderberg KA, Andrews C, Berman PW, Frahm N, De Rosa SC, Alpert MD, Yates NL, Shen X, Koup RA, Pitisuttithum P, Kaewkungwal J, Nitayaphan S, Rerks-Ngarm S, Michael NL, Kim JH. 2012. Immune-correlates analysis of an HIV-1 vaccine efficacy trial. N. Engl. J. Med. 366:1275–1286. 10.1056/NEJMoa1113425 - DOI - PMC - PubMed
-
- Letvin NL, Rao SS, Montefiori DC, Seaman MS, Sun Y, Lim SY, Yeh WW, Asmal M, Gelman RS, Shen L, Whitney JB, Seoighe C, Lacerda M, Keating S, Norris PJ, Hudgens MG, Gilbert PB, Buzby AP, Mach LV, Zhang J, Balachandran H, Shaw GM, Schmidt SD, Todd JP, Dodson A, Mascola JR, Nabel GJ. 2011. Immune and genetic correlates of vaccine protection against mucosal infection by SIV in monkeys. Sci. Transl. Med. 3:81ra36. 10.1126/scitranslmed.3002351 - DOI - PMC - PubMed
Publication types
MeSH terms
Substances
Grants and funding
LinkOut - more resources
Full Text Sources
Other Literature Sources
Research Materials

