. 2014 Jan;88(1):325-38.
doi: 10.1128/JVI.01141-13. Epub 2013 Oct 23.

A novel subnucleocapsid nanoplatform for mucosal vaccination against influenza virus that targets the ectodomain of matrix protein 2

Affiliations

A novel subnucleocapsid nanoplatform for mucosal vaccination against influenza virus that targets the ectodomain of matrix protein 2

Pierre-Louis Hervé et al. J Virol. 2014 Jan.

Abstract

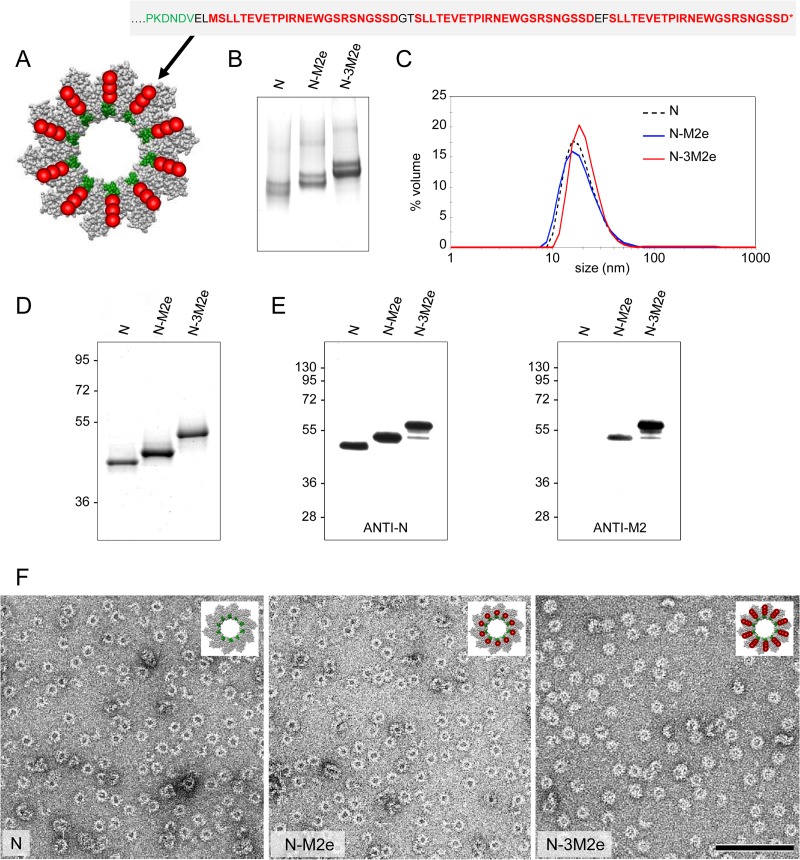
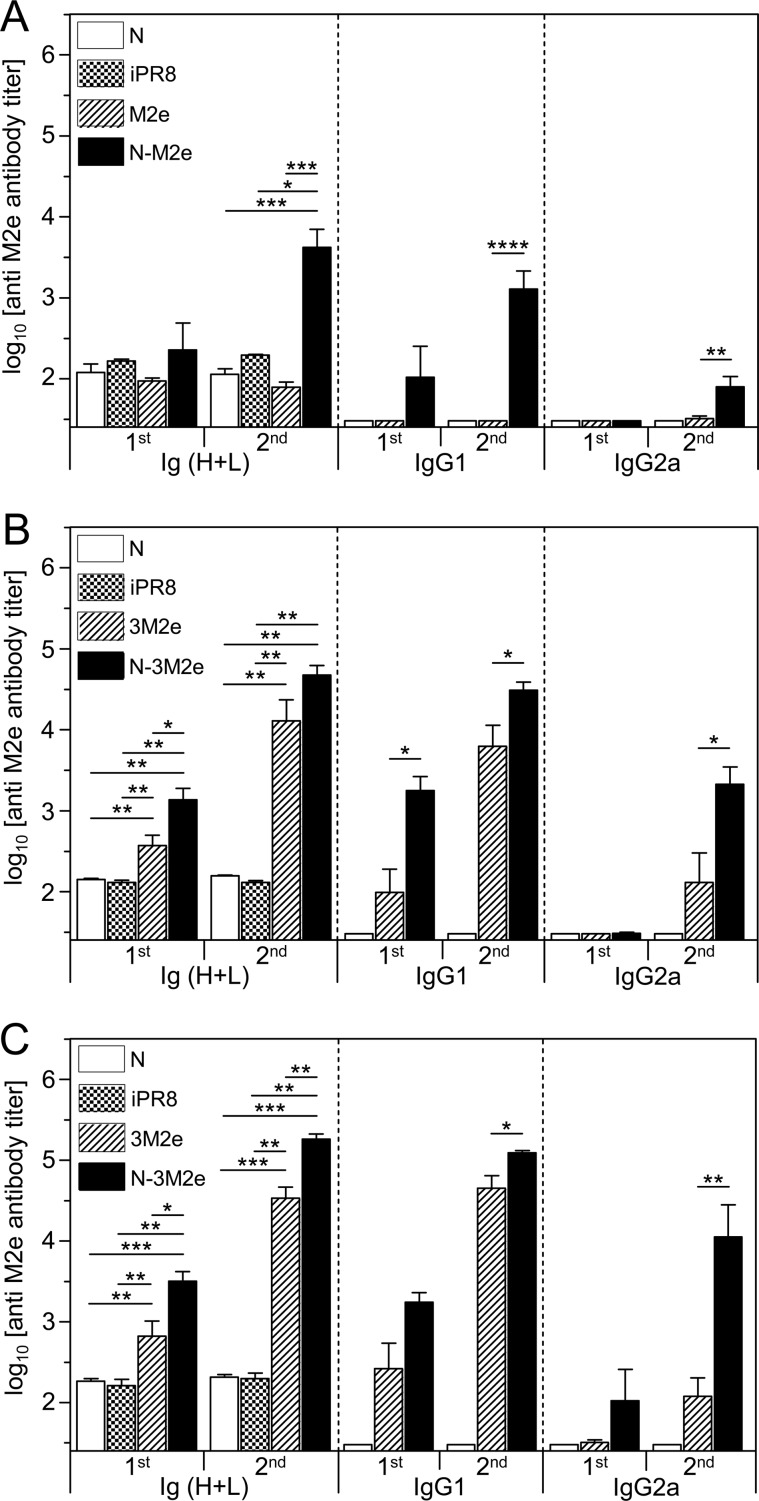
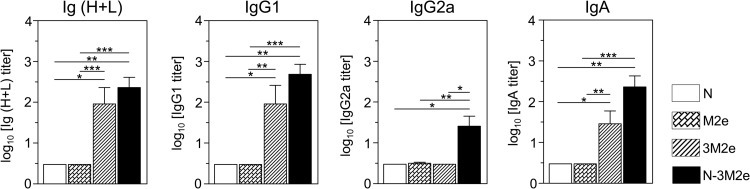
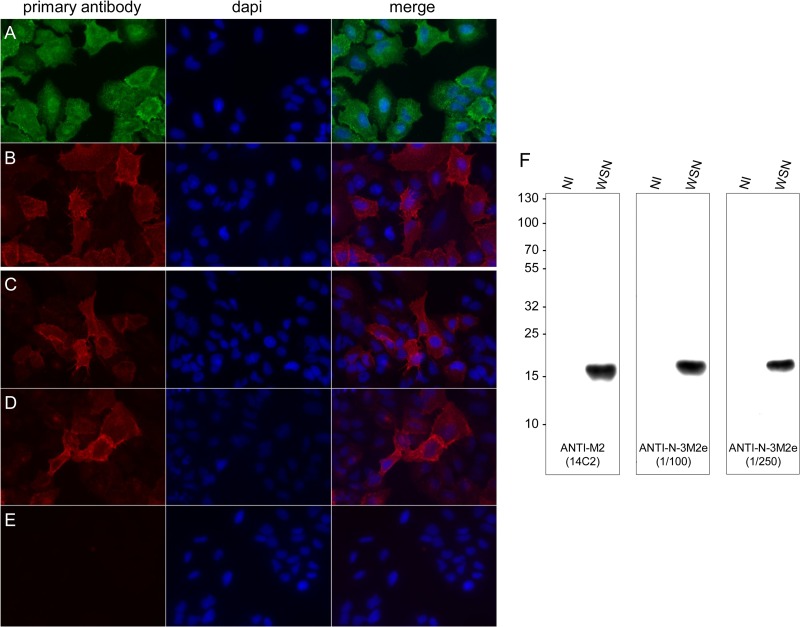
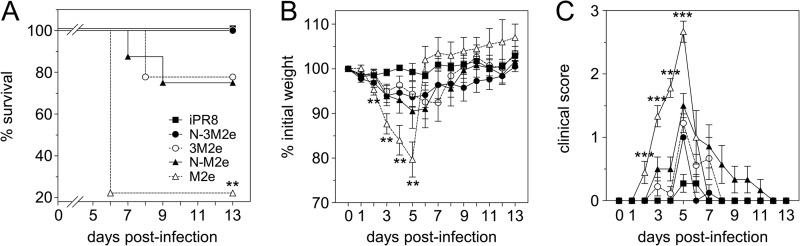
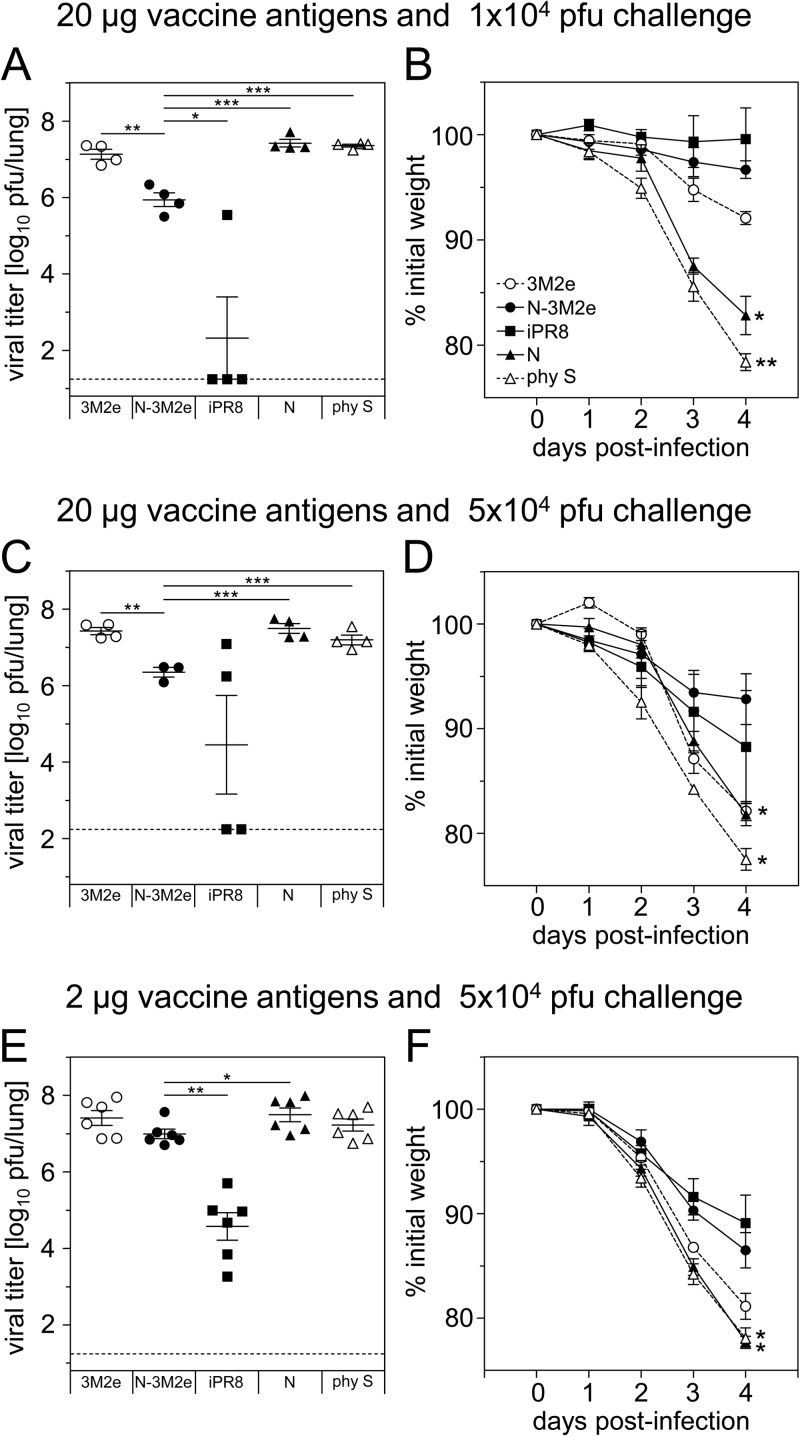
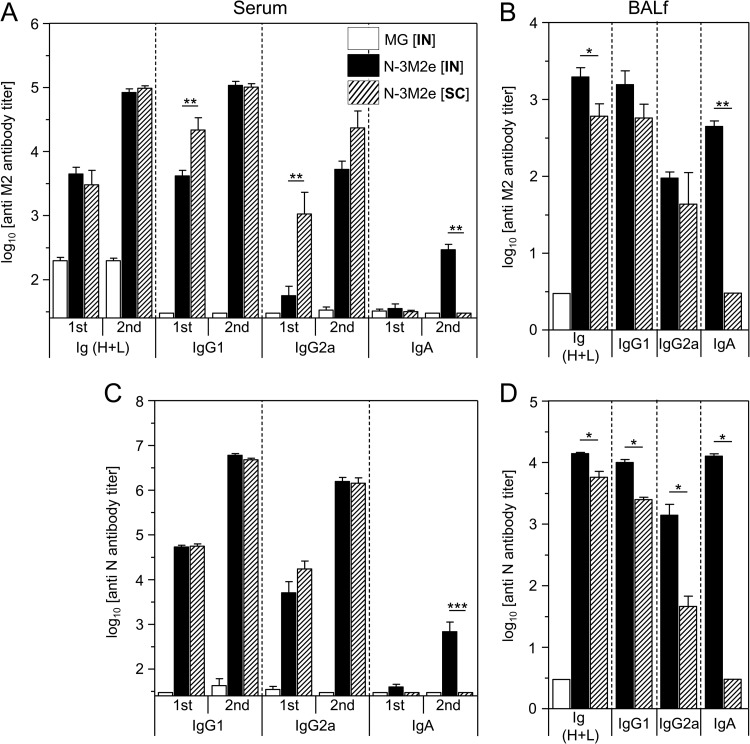
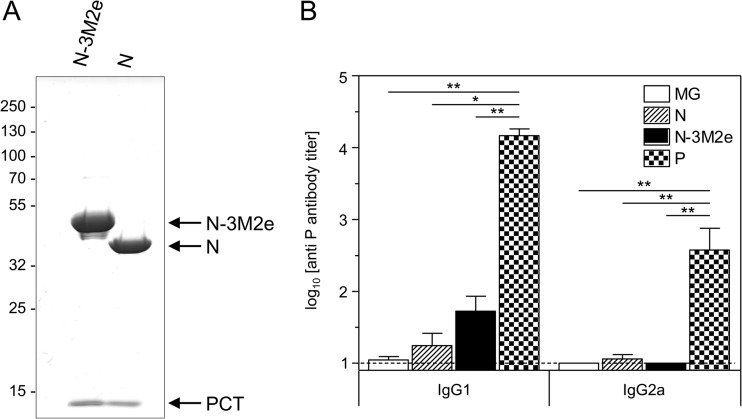
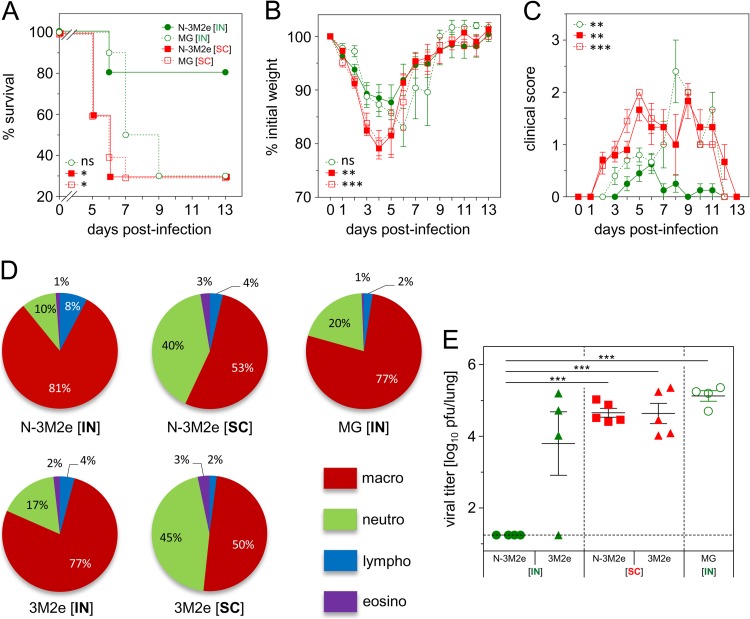
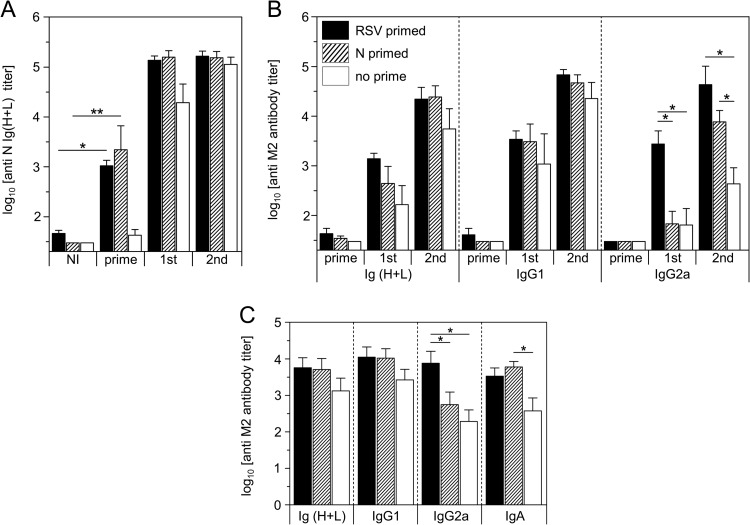
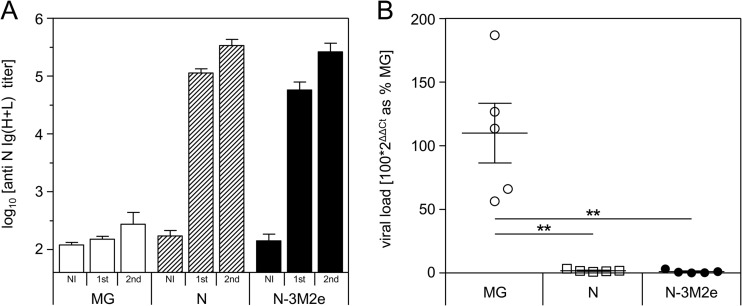
In this study, subnucleocapsid nanorings formed by the recombinant nucleoprotein (N) of the respiratory syncytial virus were evaluated as a platform to anchor heterologous antigens. The ectodomain of the influenza virus A matrix protein 2 (M2e) is highly conserved and elicits protective antibodies when it is linked to an immunogenic carrier, making it a promising target to develop universal influenza vaccines. In this context, one or three M2e copies were genetically linked to the C terminus of N to produce N-M2e and N-3M2e chimeric recombinant nanorings. Mice were immunized intranasally with N-M2e or N-3M2e or with M2e or 3M2e control peptides. N-3M2e-vaccinated mice showed the strongest mucosal and systemic antibody responses. These mice presented a reduced viral load and minor weight loss, and all survived upon challenge with influenza virus A/PR8/34 (H1N1) (PR8). We compared the intranasal route to the subcutaneous route of N-3M2e immunization. Only the intranasal route induced a strong local IgA response and led to the protection of mice upon challenge. Finally, we demonstrated that the induction of anti-M2e antibodies by N-3M2e is not impaired by preexisting anti-N immunity. Overall, these results show that the N nanoring is a potent carrier for mucosal delivery of vaccinal antigens.


Figures

FIG 1
FIG 1
Design of chimeric N SRS fused to M2e epitopes and biochemical and biophysical characterization. N protein was fused at its C-terminal end (Cter) to either one (N-M2e) or three (N-3M2e) M2e peptides from A/PuertoRico/8/34 (H1N1). (A) Schematic representation of one N-3M2e ring based on the known 3D structure of N SRS seen from the top (8). The sequence of the C terminus of N protein is in green, M2e epitopes are in red, and the 2-amino-acid (aa) linkers are in black. N SRS (empty carrier) and chimeric N SRS (N-M2e, N-3M2e) were produced and purified as described in Materials and Methods and then analyzed by native PAGE (B), SDS-PAGE (D), and Coomassie blue staining. The hydrodynamic radius of chimeric N rings was also estimated by dynamic light scattering (DLS) (C). Western blotting (E) with anti-N (left panel) or 14C2 anti-M2 (right panel) antibodies confirmed the presence of M2e epitopes on N SRS. The relative molecular mass (kDa) is indicated on the left. (F) Purified chimeric rings were negatively stained and observed by transmission electronic microscopy (TEM). The structure integrity of chimeric rings was preserved upon the addition of 1 (middle panel) or 3 (right panel) M2e peptides. For comparison, a photograph of native N rings is shown in the left panel.
FIG 2
FIG 2
Linking M2e in one or three repeats onto N SRS strongly increased the antigen-specific serum antibody response. BALB/c mice were immunized i.n. twice at a 2-week interval with 20 μg of M2e synthetic peptide or 2 μg of N-M2e SRS (A), or with 2 μg of 3M2e synthetic peptide or N-3M2e SRS (B), or with 20 μg of 3M2e synthetic peptide or N-3M2e SRS (C). As a control, mice were immunized i.n. with 20 μg of N or s.c. with 2 μg of inactivated PR8 virus (iPR8). All immunogens were adjuvanted with 5% Montanide gel. Sera of vaccinated mice were collected 2 weeks after the prime immunization (1st) or 2 weeks after the boost immunization (2nd). M2e-specific Ig (H+L), IgG1, and IgG2a titers were determined individually in sera by indirect ELISA using M2e synthetic peptide as the capture antigen. Data are means + SEM of antibody titers for each group (n = 5 to 33 per experimental group; 1 to 5 independent experiments). P values were determined according to the Mann-Whitney test (*, P < 0.05; **, P < 0.01; ***, P < 0.001).
FIG 3
FIG 3
Linking M2e in one or three repeats onto N SRS strongly increased the antigen-specific mucosal IgA antibody response. BALB/c mice were immunized i.n. with 20 μg of M2e or 3M2e synthetic peptides or 20 μg of N-3M2e chimeric rings. As a negative control, mice were immunized i.n. with 20 μg of N. All immunogens were adjuvanted with 5% Montanide gel. Bronchoalveolar lavage fluids (BALf) of vaccinated mice were collected 2 weeks after the boost immunization. M2e-specific Ig (H+L), IgG1, IgG2a, and IgA titers were determined individually by indirect ELISA using M2e synthetic peptide as the capture antigen. Data are means + SEM of antibody titers for each group (n = 4 to 10 per experimental group, 1 to 2 independent experiments). P values were determined according to the Mann-Whitney test (*, P < 0.05; **, P < 0.01; ***, P < 0.001).
FIG 4
FIG 4
Anti-M2e antibodies induced in mice by N-3M2e immunization bind to the M2 protein expressed by influenza virus-infected cells. Subconfluent monolayer A549 cells were infected with influenza virus WSN at a multiplicity of infection of 10. At 12 h p.i., cells were fixed in PBS–4% PFA and stained as described in Materials and Methods with anti-NP monoclonal antibody (A), 14C2 anti-M2 antibody (B), or sera collected from i.n. N-3M2e immunized mice (C, D, E) at a dilution of 1:200 (C, E) or 1:500 (D). (E) Negative control for staining of noninfected cells. Samples were observed by fluorescence microscopy using a 40× objective. Alternatively, infected (WSN) or noninfected (NI) cell extracts were analyzed by Western blotting using 14C2 antibody or sera collected from i.n. N-3M2e-immunized mice at a dilution of 1:100 or 1:250 (F).
FIG 5
FIG 5
Nasal immunization with N-3M2e SRS protected against a homologous virus challenge. BALB/c mice were immunized twice i.n. at a 2-week interval with 20 μg of M2e or 3M2e synthetic peptides or 2 μg of N-M2e or N-3M2e SRS. The positive-control group received s.c. 2 μg of iPR8. All antigens were adjuvanted with 5% Montanide gel. Two weeks after the boost immunization, mice were lightly anesthetized and inoculated i.n. with 5 × 10⁴ PFU of PR8 virus. (A) Survival curves of infected mice are expressed as the percentages of surviving mice. (B) Weight curves of infected mice. Values represent the mean weights of mice expressed as a percentage of initial weight at day of inoculation (100%). (C) Clinical scores of infected mice were rated from 0 to 3 as described in Materials and Methods. Plotted data are means ± SEM (B, C). Curves are identified in panel A. The significance of the differences observed between N-3M2e curves and each of the other curves was evaluated according to the one-way ANOVA Tukey's multiple-comparison test (*, P < 0.05; **, P < 0.01; ***, P < 0.001) (statistical test was performed between day 2 and day 5 p.i. for weight and clinical score curves). The log rank Mantel-Cox test was used to compare survival curves (n = 8 to 11 per experimental group).
FIG 6
FIG 6
Reduction of pulmonary viral load in BALB/c mice immunized with N-3M2e SRS after homologous challenge. BALB/c mice were immunized twice i.n. at a 2-week interval with either 2 μg (E and F) or 20 μg (A, B, C, D) of 3M2e synthetic peptide or N-3M2e SRS or s.c. with 2 μg of iPR8 as a positive control for protection. The negative-control groups received i.n. either 2 μg (E and F) or 20 μg (A, B, C, D) of N SRS or the adjuvant alone in 0.9% NaCl (phy S). All immunogens were adjuvanted with 5% Montanide gel. Two weeks after the boost immunization, mice were lightly anesthetized and inoculated with either 1 × 10⁴ (A, B) or 5 × 10⁴ (C, D, E, F) PFU of PR8 virus. (A, C, E) Four days after challenge, mice were sacrificed and their lungs were collected. Titers of infectious virus in lung homogenates were measured by plaque assay on MDCK cells. Individual values are represented for each experimental group. The mean value is represented by a horizontal bar, SEM by a vertical bar, and the limit of detection by a dotted line (n = 3 to 6 per experimental group, 1 or 2 independent experiments). The doses of vaccine antigens and challenge virus are indicated above each panel. P values were determined according to the unpaired t test (*, P < 0.05; **, P < 0.01; ***, P < 0.001). (B, D, F) Weight curves of infected mice. Values represent the mean weights of mice expressed as a percentage of initial weight at day of inoculation (100%). Plotted data are means ± SEM (n = 3 to 6 per experimental group, 1 or 2 independent experiments). Curves are identified in panel B. The significance of the differences observed between N-3M2e curves and each of the other curves was evaluated according to the one-way ANOVA Tukey's multiple-comparison test (*, P < 0.05; **, P < 0.01; ***, P < 0.001) (statistical test was performed between day 3 and day 4 p.i.).
FIG 7
FIG 7
Only the i.n. delivery route of N-3M2e SRS gave rise to specific IgA. BALB/c mice were immunized twice i.n. or s.c. at a 2-week interval with 20 μg of N-3M2e SRS adjuvanted with 5% Montanide gel. As a negative control, mice received i.n. adjuvant alone (MG [i.n.]). Sera of vaccinated mice were collected 2 weeks after the prime immunization (1st) and 2 weeks after the boost immunization (2nd), and BALf were collected 2 weeks after the boost immunization. M2e-specific (A, B) or N-specific (C, D) Ig (H+L), IgG1, IgG2a, and IgA titers were determined individually in sera (A, C) or BALf (B, D) from each group by indirect ELISA using M2e synthetic peptide or N rings as the capture antigen. Data are means + SEM of antibody titers for each group (n = 4 to 10 per experimental group). Bars are identified at the top right of the panel A. P values were determined according to the Mann-Whitney test (*, P < 0.05; **, P < 0.01; ***, P < 0.001).
FIG 8
FIG 8
N and N-3M2e SRS are copurified with a small fragment of P (PCT) that induced marginal anti-P antibody response. (A) N-3M2e and N SRS were analyzed by SDS-PAGE and Coomassie blue staining. The identity of each band is indicated on the right. (B) BALB/c mice were immunized twice i.n. at a 2-week interval with 8 μg of N or N-3M2e SRS or 8 μg of P. All antigens were adjuvanted with 5% Montanide gel. The negative-control group received i.n. adjuvant alone (MG). Sera were collected 2 weeks after the boost immunization. P-specific IgG1 and IgG2a were determined individually in sera from each group by indirect ELISA using purified P protein as the capture antigen. The mean (+ SEM) titers for each group are plotted as histograms (n = 5 per experimental group). P values were determined according to the Mann-Whitney test (*, P < 0.05; **, P < 0.01; ***, P < 0.001).
FIG 9
FIG 9
The efficacy of the N-3M2e vaccine against virus challenge depended upon the immunization route. (A, B, C) BALB/c mice were immunized twice i.n. or s.c. at a 2-week interval with 2 μg of N-3M2e SRS adjuvanted with 5% Montanide gel. As a negative control, mice received i.n. or s.c. adjuvant alone (MG [IN] or MG [SC], respectively). Two weeks after the boost immunization, mice were lightly anesthetized and inoculated with 5 × 10⁴ PFU of PR8 virus. (A) Survival curves of infected mice are expressed as the percentages of surviving mice. (B) Weight curves of infected mice. Values represent the mean weights of surviving mice expressed as a percentage of initial weight at day of infection (100%). (C) Clinical status of infected mice was rated from 0 to 3 as described in Materials and Methods. Values represent the mean scores, and SEM is represented by vertical bars. Keys to curve identification are in panel A. The significance of the differences observed between N-3M2e [IN] curves and each one of the other curves was evaluated according to the one-way ANOVA Tukey's multiple-comparison test (*, P < 0.05; **, P < 0.01; ***, P < 0.001) (statistical test was performed between day 2 and day 5 p.i. for weight curves and between day 2 and day 9 p.i. for clinical score curves). The log rank Mantel-Cox test was used to compare survival curves (n = 10 or 11 per experimental group). (D, E) BALB/c mice were immunized twice i.n. or s.c. at a 2-week interval with 20 μg of N-3M2e or 3M2e adjuvanted with 5% Montanide gel. The negative-control group received i.n. adjuvant alone (MG). Two weeks after the boost immunization, mice were lightly anesthetized and inoculated with 5 × 10⁴ PFU of PR8 virus. Eight days after the infection, surviving mice were sacrificed and BALf and lung were collected. (D) BAL fluid cells from individual mice were spread on slides and labeled by May-Grünwald-Giemsa, and leukocytes were counted (neutro, neutrophils; macro, macrophages; lympho, lymphocytes; eosino, eosinophils). The percentage of each subset is represented in a pie chart for each immunized group. Percentages are indicated on the chart, and color keys are shown. (E) Titers of infectious virus in lung homogenate were measured by plaque assay on MDCK cells. The values obtained for each individual mouse are represented by a dot. Mean value is represented by a horizontal bar, SEM by a vertical bar, and the limit of detection by a dotted line. P values were determined according to the unpaired t test (*, P < 0.05; **, P < 0.01; ***, P < 0.001) (n = 4 or 5 per experimental group).
FIG 10
FIG 10
Preexisting anti-N immunity induced by RSV infection or vaccination with N SRS did not interfere with the induction of anti-M2e antibody response upon N-3M2e immunization. BALB/c mice were primed i.n. with 1.2 × 10⁷ PFU of HRSV-A2 virus (RSV primed) or 20 μg of N SRS adjuvanted with 5% Montanide gel (N primed). A nonprimed group was also added as a control (no prime). Two weeks after, the 3 groups were immunized twice i.n. at a 2-week interval with 2 μg of N-3M2e adjuvanted with 5% Montanide gel. Sera of the vaccinated mice were collected before (NI, not immunized) and 2 weeks after (prime) the prime and 2 weeks after the first (1st) and the second (2nd) immunizations with N-3M2e. BALf were collected 2 weeks after the second immunization. N-specific Ig (H+L) (A) or M2e-specific Ig (H+L), IgG1, IgG2a, or IgA (B, C) were determined individually in sera (A, B) or BALf (C) from each group by indirect ELISA using N rings or M2e synthetic peptide as the capture antigen. The means + SEM of titers for each group are plotted as histograms (n = 5 per experimental group). Bar identifications are indicated at the top left of panel B. P values were determined according to the Mann-Whitney test (*, P < 0.05; **, P < 0.01; ***, P < 0.001).
FIG 11
FIG 11
Nasal immunization with N-3M2e SRS protected mice against viral replication in the lung after an RSV challenge. BALB/c mice were immunized twice i.n. at a 2-week interval with 8 μg of N or N-3M2e SRS. The negative-control group received i.n. adjuvant alone (MG). All antigens were adjuvanted with 5% Montanide gel. (A) Sera were collected before (NI, not immunized) and 2 weeks after (1st) the prime immunization and 2 weeks after the boost immunization (2nd), and N-specific Ig (H+L) levels were determined individually in sera from each group by ELISA. (B) Two weeks after the boost immunization, mice were lightly anesthetized and inoculated i.n. with 1.2 × 10⁷ PFU of HRSV-A2 virus. Five days after challenge, mice were sacrificed and their lungs were collected. Individual viral loads were measured from lung homogenate by qRT-PCR. The relative quantity of N transcripts, normalized to HPRT, is expressed as the percentage of the negative-control group (MG). P values were determined according to the Mann-Whitney test (*, P < 0.05; **, P < 0.01; ***, P < 0.001) (n = 5 per experimental group).

Similar articles

Cited by

References

    1. Belyakov IM, Ahlers JD. 2009. What role does the route of immunization play in the generation of protective immunity against mucosal pathogens? J. Immunol. 183:6883–6892. 10.4049/jimmunol.0901466 - DOI - PubMed
    1. Lycke N. 2012. Recent progress in mucosal vaccine development: potential and limitations. Nat. Rev. Immunol. 12:592–605. 10.1038/nri3251 - DOI - PubMed
    1. Schneider-Ohrum K, Ross TM. 2012. Virus-like particles for antigen delivery at mucosal surfaces. Curr. Top. Microbiol. Immunol. 354:53–73. 10.1007/82_2011_135 - DOI - PubMed
    1. Scheerlinck J-PY, Greenwood DLV. 2008. Virus-sized vaccine delivery systems. Drug Discov. Today 13:882–887. 10.1016/j.drudis.2008.06.016 - DOI - PubMed
    1. Bachmann MF, Jennings GT. 2010. Vaccine delivery: a matter of size, geometry, kinetics and molecular patterns. Nat. Rev. Immunol. 10:787–796. 10.1038/nri2868 - DOI - PubMed

Publication types

MeSH terms