. 2014 Jan;88(1):752-7.
doi: 10.1128/JVI.01714-13. Epub 2013 Oct 23.

Human plasmacytoid dendritic cells sense lymphocytic choriomeningitis virus-infected cells in vitro

Affiliations

Human plasmacytoid dendritic cells sense lymphocytic choriomeningitis virus-infected cells in vitro

S F Wieland et al. J Virol. 2014 Jan.

Abstract

We previously reported that exosomal transfer of hepatitis C virus (HCV) positive-strand RNA from human Huh-7 hepatoma cells to human plasmacytoid dendritic cells (pDCs) triggers pDC alpha/beta interferon (IFN-α/β) production in a Toll-like receptor 7 (TLR7)-dependent, virus-independent manner. Here we show that human pDCs are also activated by a TLR7-dependent, virus-independent, exosomal RNA transfer mechanism by human and mouse hepatoma and nonhepatoma cells that replicate the negative-strand lymphocytic choriomeningitis virus (LCMV).


Figures
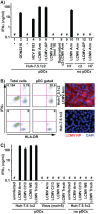
FIG 1
FIG 1
LCMV-infected Huh-7-derived cells trigger IFN-α production in cocultured human peripheral pDCs. (A) Huh-7.5.1c2 or Huh-7 cells (2 × 10⁵) infected with LCMV or HCV D183 (18) at MOI = 0.1 3 days earlier were cocultured with 2 × 10⁴ freshly purified human peripheral pDCs in wells of a 96-well round-bottom plate for 24 h before IFN-α was quantified in the coculture supernatant by enzyme-linked immunosorbent assay (ELISA) as described previously (9). c2, Huh-7.5.1c2 cells; H7, Huh-7 parental cells. (B) Cocultures grown as described for panel A were fixed and analyzed by FACS as described previously (9). All cells are shown in the left panels, and cells gated for HLA-DR and CD123 (pDCs) are shown in the right panels. Huh-7.5.1c2 cells infected with LCMV as described for panel A were analyzed by immunofluorescence as described previously (9) using an anti-NP MAb (1.1.3 [34]) and a secondary Alexa 555-conjugated goat anti-mouse antibody (Invitrogen). (C) IFN-α was quantified in the supernatant of cocultures of Huh-7.5.1c2 cells infected with different LCMV strains (39, 40) with pDCs as described for panel A. #, below the limit of detection of the IFN-α ELISA (36 pg/ml). Error bars represent means ± standard deviations (SD) (n = 3).
FIG 2
FIG 2
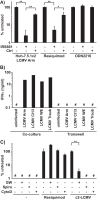
Mechanism of activation of pDCs by LCMV-infected Huh-7.5.1c2 cells. (A) Human peripheral pDCs were cocultured with LCMV Armstrong-infected Huh-7.5.1c2 cells or incubated with a TLR7 (Resiquimod) or TLR9 (ODN2216) ligand and left untreated or treated with a TLR7 antagonist or a control oligonucleotide (Ctrl) exactly as described previously (9). IFN-α production is shown as a percentage of the untreated control level in each group. (B) IFN-α production was quantified by ELISA in the supernatant of cocultures of LCMV-infected Huh-7.5.1c2 cells and pDCs set up exactly as described in the legend to Fig. 1A but either seeded together on top of the membrane of transwell chambers (Coculture) or separated by the membrane (Transwell). Data of individual wells are shown. (C) Human peripheral pDCs (2 × 10⁴) were cocultured with 6.7 × 10³ LCMV Armstrong-infected Huh-7.5.1c2 cells or incubated with a TLR7 agonist (Resiquimod) and left untreated or treated with the exosome release inhibitors GW4869 (GW, 10 μM) and spiroepoxide (Spiro, 20 μM) or the endocytosis inhibitor cytochalasin D (CytoD, 0.1 μg/ml) as described previously (8). IFN-α production is shown as a percentage of the untreated control group level. #, below the limit of detection of the IFN-α ELISA (150 pg/ml). Error bars represent means ± SD (n = 3). *, P < 0.05; **, P < 0.01 (paired Student's t test).
FIG 3
FIG 3
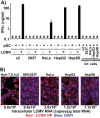
LCMV-infected human cell lines other than Huh-7 trigger IFN-α production in cocultured pDCs. (A) Quantification of IFN-α production in cell culture supernatants of uninfected or LCMV Armstrong-infected cells (LCMV +/−) cocultured or not with human peripheral pDCs (pDC +/−) set up as described for Fig. 1A. Alternatively, 2 × 10⁴ pDCs were incubated with the supernatant of LCMV-infected cells collected 3 days after LCMV inoculation. #, below the limit of detection of the IFN-α ELISA (36 pg/ml); inf, infected. Error bars represent means ± SD (n = 3). (B) Analysis of LCMV infection 3 days after LCMV Armstrong inoculation (MOI = 0.1). LCMV-infected cells were visualized by LCMV NP-specific immunofluorescence. Intracellular LCMV RNA levels were determined by LCMV-specific RT-qPCR and normalized to GAPDH (glyceraldehyde-3-phosphate dehydrogenase) mRNA levels as described previously (9).
FIG 4
FIG 4
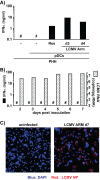
LCMV-infected primary human hepatocytes (PHHs) trigger IFN-α production in cocultured pDCs. (A) Quantification of IFN-α production in cell culture supernatants of uninfected PHHs cocultured (20 h) or not with human peripheral pDCs and cocultures of human pDCs with PHHs infected with LCMV (MOI = 0.1) for 3 days (d3) or 4 days (d4). #, below the limit of detection of the IFN-α ELISA (36 pg/ml); Res, resiquimod. Single wells were analyzed. (B) Analysis of LCMV infection and IFN-α production of PHHs at different time points after LCMV Armstrong inoculation (MOI = 0.1). Intracellular LCMV RNA levels were determined by LCMV-specific RT-qPCR and normalized to GAPDH mRNA levels as described previously (9). #, below the limit of detection of the IFN-α ELISA (36 pg/ml). (C) LCMV-infected PHHs were visualized by LCMV NP-specific immunofluorescence 7 days postinoculation.
FIG 5
FIG 5
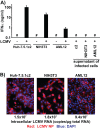
LCMV-infected murine cell lines trigger IFN-α production in cocultured human peripheral pDCs. (A) IFN-α production in cell culture supernatants of uninfected or LCMV Armstrong-infected cells (LCMV +/−) cocultured with human peripheral pDCs (pDC +/−) set up exactly as described for Fig. 1A. Alternatively, pDCs were incubated with the supernatants of LCMV-infected cells collected 3 days after LCMV inoculation and set up exactly as described for Fig. 1A. #, below the limit of detection of the IFN-α ELISA (36 pg/ml). Error bars represent means ± SD (n = 3). (B) Analysis of LCMV infection 3 days after LCMV Armstrong inoculation (MOI = 0.1). LCMV-infected cells were visualized by LCMV NP-specific immunofluorescence. Intracellular LCMV RNA levels were determined by LCMV-specific RT-qPCR and normalized to GAPDH mRNA levels as described previously (9).

Similar articles

Cited by

References

    1. Heim MH. 2013. Innate immunity and HCV. J. Hepatol. 58:564–574. 10.1002/hep.26227, 10.1016/j.jhep.2012.10.005 - DOI - DOI - PubMed
    1. Borrow P, Martínez-Sobrido L, de la Torre JC. 2010. Inhibition of the type I interferon antiviral response during arenavirus infection. Viruses 2:2443–2480. 10.3390/v2112443 - DOI - PMC - PubMed
    1. Bigger CB, Guerra B, Brasky KM, Hubbard G, Beard MR, Luxon BA, Lemon SM, Lanford RE. 2004. Intrahepatic gene expression during chronic hepatitis C virus infection in chimpanzees. J. Virol. 78:13779–13792. 10.1128/JVI.78.24.13779-13792.2004 - DOI - PMC - PubMed
    1. Bigger CB, Brasky KM, Lanford RE. 2001. DNA microarray analysis of chimpanzee liver during acute resolving hepatitis C virus infection. J. Virol. 75:7059–7066. 10.1128/JVI.75.15.7059-7066.2001 - DOI - PMC - PubMed
    1. Su AI, Pezacki JP, Wodicka L, Brideau AD, Supekova L, Thimme R, Wieland S, Bukh J, Purcell RH, Schultz PG, Chisari FV. 2002. Genomic analysis of the host response to hepatitis C virus infection. Proc. Natl. Acad. Sci. U. S. A. 99:15669–15674. 10.1073/pnas.202608199 - DOI - PMC - PubMed

Publication types

MeSH terms

LinkOut - more resources