. 2014 Jan;88(1):393-402.
doi: 10.1128/JVI.01788-13. Epub 2013 Oct 23.

Human T-cell leukemia/lymphoma virus type 1 p30, but not p12/p8, counteracts toll-like receptor 3 (TLR3) and TLR4 signaling in human monocytes and dendritic cells

Affiliations

Human T-cell leukemia/lymphoma virus type 1 p30, but not p12/p8, counteracts toll-like receptor 3 (TLR3) and TLR4 signaling in human monocytes and dendritic cells

Claudio Fenizia et al. J Virol. 2014 Jan.

Abstract

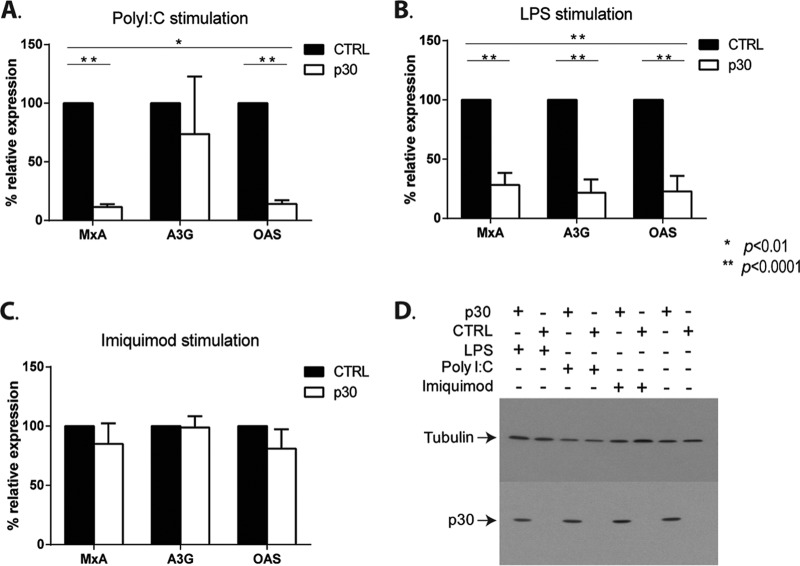
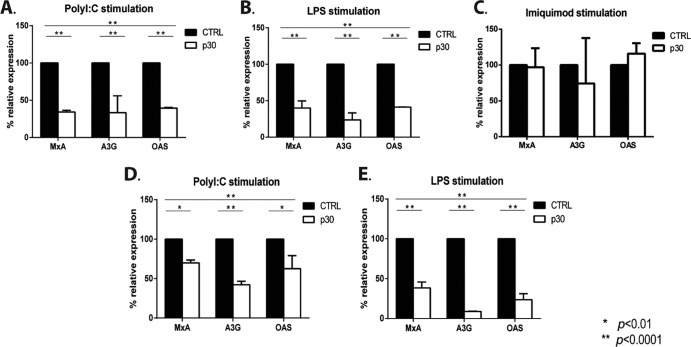
The human T-cell leukemia/lymphoma virus type 1 (HTLV-1) p30 protein, essential for virus infectivity in vivo, is required for efficient infection of human dendritic cells (DCs) but not B and T cells in vitro. We used a human monocytic cell line, THP-1, and dendritic cells to study the mechanism of p30 and p12/p8 requirements in these cell types. p30 inhibited the expression of interferon (IFN)-responsive genes (ISG) following stimulation by lipopolysaccharide (LPS) of Toll-like receptor 4 (TLR4) and by poly(I·C) of TLR3 but not of TLR7/8 with imiquimod. Results with THP-1 mirrored those for ex vivo human primary monocytes and monocyte-derived dendritic cells (Mo-mDC). The effect of p30 on TLR signaling was also demonstrated by ablating its expression within a molecular clone of HTLV-1. HTLV-1 infection of monocytes inhibited TLR3- and TLR4-induced ISG expression by 50 to 90% depending on the genes, whereas the isogenic clone p30 knockout virus was less effective at inhibiting TLR3 and TRL4 signaling and displayed lower infectivity. Viral expression and inhibition of ISG transcription was, however, rescued by restoration of p30 expression. A chromatin immunoprecipitation assay demonstrated that p30 inhibits initiation and elongation of PU.1-dependent transcription of IFN-α1, IFN-β, and TLR4 genes upon TLR stimulation. In contrast, experiments conducted with p12/p8 did not demonstrate an effect on ISG expression. These results provide a mechanistic explanation of the requirement of p30 for HTLV-1 infectivity in vivo, suggest that dampening interferon responses in monocytes and DCs is specific for p30, and represent an essential early step for permissive HTLV-1 infection and persistence.


Figures

FIG 1
FIG 1
p30 affects TLR4 signaling in THP-1 cells. (A) Flow-cytometric analysis of THP-1 cells transduced with p30 (black line) or control (dotted line) lentivirus. TLR4 expression on the cell surface was assessed following 3 h of stimulation with PMA (+PMA) or after no stimulation (−PMA). The CD14 surface marker was used as a control (right). (B) Real-time PCR was performed on the TLR4 mRNA in THP-1 cells transduced with p30 or the control with or without PMA stimulation. The results are shown as a percentage of relative expression of the PMA-stimulated mock-transduced cell. The statistically significant differences are marked with an asterisk, which indicates a P value of less than 0.0001. Statistics were determined from three independent experiments (n = 3). (C) Flow-cytometric analysis of THP-1 cells transduced with p30 (black line) or mock transduced (dotted line). Twelve hours following LPS stimulation, cells were collected and analyzed for intracellular production of IL-12 and TNF-α.
FIG 2
FIG 2
p30 decreases TRL3 and TRL4 but not TLR7/8 signaling. (A to C) Real-time quantitative PCR analysis of type 1 ISGs. THP-1 cells were transduced with p30 or control lentivirus, kept in culture for 72 h, and stimulated for 6 h with poly(I·C) (A), LPS (B), or imiquimod (C). The results are presented as the percentage of inhibition of the expression of the MxA, A3G, and OAS mRNAs versus the mock-transfected control. The statistically significant differences are marked with one or two asterisks, which indicate a P value of less than 0.01 or 0.0001, respectively. Statistics were determined from four independent experiments. (D) Immunoblot analysis of tubulin and p30 expression of the experiments presented in panels A to C.
FIG 3
FIG 3
p30 decreases TLR3 and TLR4 signaling in primary human monocytes and primary human monocyte-derived dendritic cells. Real-time PCR quantitative analysis of the expression of ISGs on primary monocytes and Mo-mDC was performed. Primary monocytes were transduced with p30 or control lentivirus. Seventy-two h later, the cells were stimulated with poly(I·C) (A), LPS (B), or imiquimod (C). The results are shown as the percentage of relative expression of ISG mRNAs, such as MxA, A3G, and OAS, following 6 h of TLR stimulation. Primary elutriated monocytes were differentiated into Mo-mDC and transduced with p30 or control lentivirus. Seventy-two h later, the cells were stimulated with poly(I·C) (D) or LPS (E). Immunoblot analysis of tubulin and p30 was performed, and no differences were found in p30 expression (data not shown). The statistically significant differences are marked with one or two asterisks, which indicate a P value of less than 0.01 or 0.0001, respectively. Statistics were determined from two and four independent donors for primary monocytes and Mo-mDC, respectively.
FIG 4
FIG 4
Chronically infected monocyte responses to TLR signaling. (A) THP-1 cells were infected with WT (dashed line) or p30-KO HTLV-1 (solid line) virus. Productive infection was monitored by p19 Gag ELISA in the cell supernatant. Uninfected controls were negative for p19 Gag and are not represented in the graph. (B) At week 18 postinfection, the phenotypes of the THP-1 cells infected with WT or p30-KO HTLV-1 or left uninfected were analyzed for activation markers, such as HLA-DR, CD80/83, CD86, and the CCR7 homing marker. (C and D) ISGs were measured at week 10 postinfection by real-time PCR on the RNA from the WT or p30-KO HTLV-1 chronically infected or uninfected THP-1 cells following stimulation with poly(I·C) (C) or LPS (D) for 6 h. The statistically significant differences are marked with one or two asterisks, which indicate a P value of less than 0.05 or 0.01, respectively. Statistics were determined from three independent experiments (n = 3).
FIG 5
FIG 5
p30 rescues viral production and IFN responses in THP-1 cell infected with the p30-KO mutant virus. (A) Level of p19 Gag in THP-1 cells chronically infected with WT or p30-KO HTLV-1 virus transduced with the lentivirus expressing p30 or the control lentivirus. (B) Real-time PCR for the MxA and A3G ISGs from the RNAs of the infected/transduced cells. (C) Western blot analysis for tubulin, p30, or GFP on transduced cells. The statistically significant differences are marked with one or two asterisks, which indicate a P value of less than 0.05 or 0.005, respectively. Statistics were determined from three independent experiments (n = 3).
FIG 6
FIG 6
p30 displaces PU.1 from the transcription and elongation complex. ChIP assay was performed on THP-1 cells transduced with p30 lentivirus (white bars) or mock transduced (black bars). Cells were stimulated for 1 h with LPS or poly(I·C) (I·C) before the ChIP assay or were left unstimulated. Depicted here is the relative amount of DNA precipitated with the different antibodies normalized to the amount found in the input of the promoters for IFN-α1, IFN-β, and TLR4 genes. The immunoprecipitations were performed with anti-HA and detected HA-tagged p30, anti-PU.1, anti-PolIItot, anti-PolIIS5, and anti-PolIIS2. The data are expressed in terms of fold change (the unstimulated result is 1) and represent the amount of promoter DNA for the various genes immunoprecipitated in cells stimulated in the presence or absence of p30. Statistically significant differences are marked with one or two asterisks, which indicate a P value of less than 0.01 or 0.0001, respectively. Statistics were determined from two independent experiments (n = 2).

Similar articles

Cited by

References

    1. Poiesz BJ, Ruscetti FW, Gazdar AF, Bunn PA, Minna JD, Gallo RC. 1980. Detection and isolation of type C retrovirus particles from fresh and cultured lymphocytes of a patient with cutaneous T-cell lymphoma. Proc. Natl. Acad. Sci. U. S. A. 77:7415–7419. 10.1073/pnas.77.12.7415 - DOI - PMC - PubMed
    1. Poiesz BJ, Ruscetti FW, Reitz MS, Kalyanaraman VS, Gallo RC. 1981. Isolation of a new type C retrovirus (HTLV) in primary uncultured cells of a patient with Sezary T-cell leukaemia. Nature 294:268–271. 10.1038/294268a0 - DOI - PubMed
    1. Edwards D, Fenizia C, Gold H, de Castro-Amarante MF, Buchmann C, Pise-Masison CA, Franchini G. 2011. Orf-I and orf-II-encoded proteins in HTLV-1 infection and persistence. Viruses 3:861–885. 10.3390/v3060861 - DOI - PMC - PubMed
    1. Hinuma Y, Nagata K, Hanaoka M, Nakai M, Matsumoto T, Kinoshita KI, Shirakawa S, Miyoshi I. 1981. Adult T-cell leukemia: antigen in an ATL cell line and detection of antibodies to the antigen in human sera. Proc. Natl. Acad. Sci. U. S. A. 78:6476–6480. 10.1073/pnas.78.10.6476 - DOI - PMC - PubMed
    1. Kaplan JE, Osame M, Kubota H, Igata A, Nishitani H, Maeda Y, Khabbaz RF, Janssen RS. 1990. The risk of development of HTLV-I-associated myelopathy/tropical spastic paraparesis among persons infected with HTLV-I. J. Acquir. Immune. Defic. Syndr. 3:1096–1101 - PubMed

LinkOut - more resources