. 2013 Oct 21:7:183.
doi: 10.3389/fncel.2013.00183. eCollection 2013.

Imaging neuron-glia interactions in the enteric nervous system

Affiliations

Imaging neuron-glia interactions in the enteric nervous system

Werend Boesmans et al. Front Cell Neurosci. .

Abstract

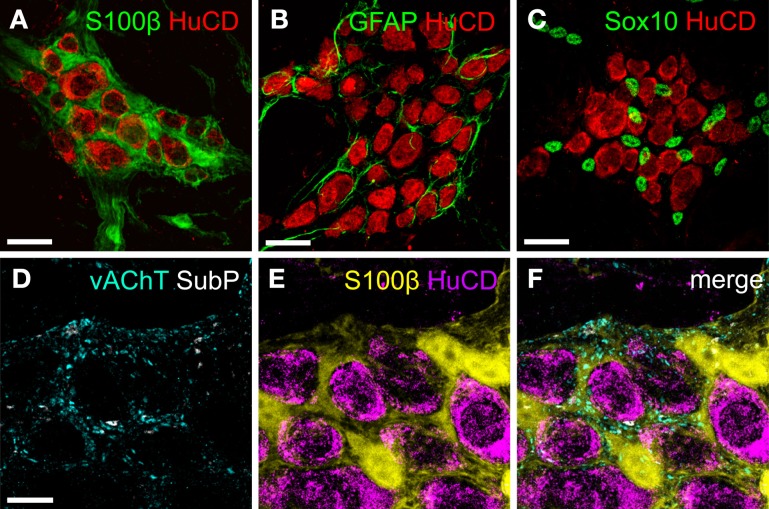
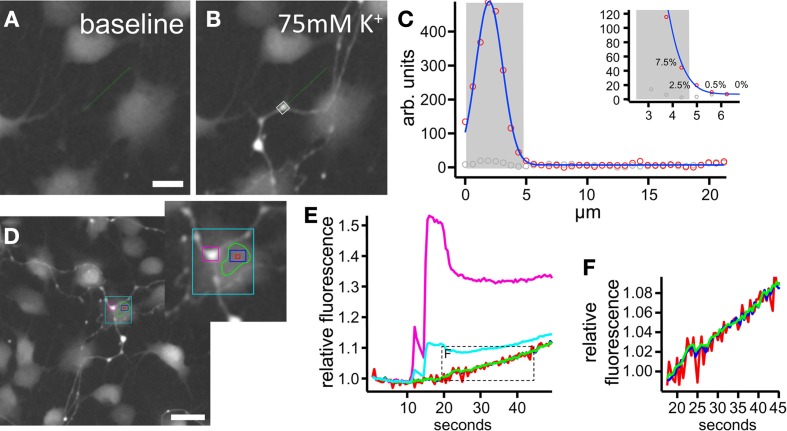
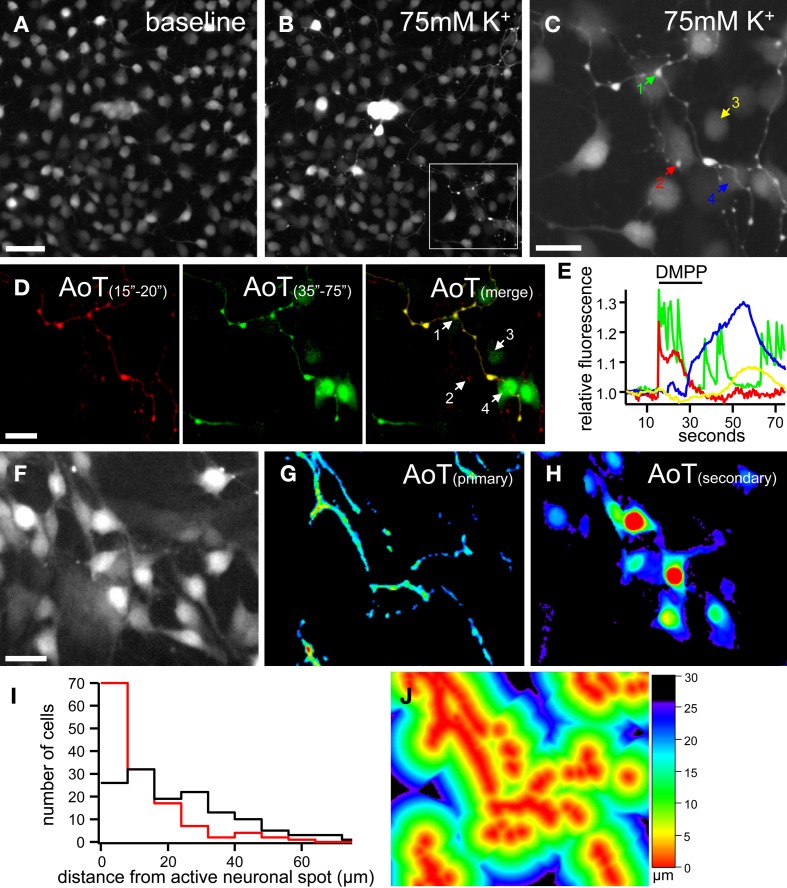
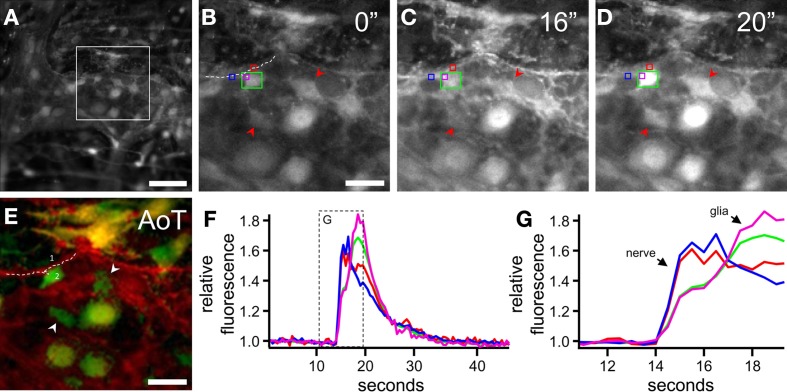
The enteric nervous system (ENS) is a network of neurons and glia within the wall of the gastrointestinal tract that is able to control many aspects of digestive function independently from the central nervous system. Enteric glial cells share several features with astrocytes and are closely associated with enteric neurons and their processes both within enteric ganglia, and along interconnecting fiber bundles. Similar to other parts of the nervous system, there is communication between enteric neurons and glia; enteric glial cells can detect neuronal activity and have the machinery to intermediate neurotransmission. However, due to the close contact between these two cell types and the particular characteristics of the gut wall, the recording of enteric glial cell activity in live imaging experiments, especially in the context of their interaction with neurons, is not straightforward. Most studies have used calcium imaging approaches to examine enteric glial cell activity but in many cases, it is difficult to distinguish whether observed transients arise from glial cells, or neuronal processes or varicosities in their vicinity. In this technical report, we describe a number of approaches to unravel the complex neuron-glia crosstalk in the ENS, focusing on the challenges and possibilities of live microscopic imaging in both animal models and human tissue samples.

Keywords: GCaMP; calcium; enteric glia; enteric neuron; synaptic.


Figures

Figure 1
Figure 1
The relation between enteric neurons and glia visualized by immunohistochemistry. (A,C) Maximum projection of colonic myenteric ganglia of mice stained for the pan-neuronal marker HuCD (red) and enteric glial cell markers (green) S100β (A), GFAP (B), and Sox10 (C). (D,E) Maximum projection composed of a stack of two confocal images of a mouse colonic myenteric ganglion labeled with antibodies for S100β (glia, yellow) and HuCD (neurons, magenta) and for vAChT (cyan) and substance P (grays) revealing the close apposition of neuronal fibers and varicosities with enteric glial cells (F). Scale bars: 25μm (A–C), 10μm (D).
Figure 2
Figure 2
Quantification of Fluo4 signals in regions of interest (ROI). (AC) Example of a neuronal fiber and bouton at rest (A) and depolarized with 75 mM K+ (B). In (C) the amplitude (at rest in gray, depolarized in red circles) along the line marked green in (A) and (B) is plotted. As seen, especially in the inset, the signal drops sharply outside the intuitively drawn ROI [gray shade bar in (C) and gray box in (B)]: the last pixel included contains 7.5% of the signal's maximal amplitude, while the first pixel outside the ROI only contains 2.5%. (D–F) Analysis of a situation in which a neuronal fiber crosses a glial cell. The cyan region of interest includes a mixture of both neuronal (purple) and glial (red, blue, green) information. Smaller regions of interest (rectangular or polygon shaped) away from the nerve fiber identify pure glial signals with improving signal to noise ratios (F) for larger areas included. Scale bars: 10μm (A,B), 20μm (D).
Figure 3
Figure 3
Ca2+ imaging of enteric neuron-glia interactions in primary enteric nervous system cultures. (A,B) Gray scale images of a patch of cultured mouse enteric neurons and glia loaded with Fluo4 at rest (A) and depolarized by 75 mM K+ application 5 s, (B). Note the large increase in fluorescence of the group of neuronal cell bodies in the center of the image. (C) Magnification of the frame indicated in (B) showing in detail the neuronal fibers and varicosities as depolarized by 75 mM K+. (D) Activity over time (AoT) images of the primary (red) and secondary (green) responses to nicotinic receptor stimulation (DMPP, 10μM, 20 s) of the same group of cells as indicated in (C). (E) Ca2+ responses of 2 neuronal boutons (1, green and 2, red) and 2 glial cells (3, yellow and 4, blue) upon DMPP application [color-coded numbers in (C) and numbers in (D)]. Note the fast upstroke and reverberating activity in neuronal varicosities and the delayed secondary Ca2+ transients in enteric glial cells. See also Supplementary movie 1. (F) Gray scale image of a patch of cultured mouse enteric neurons and glia loaded with Fluo4 at rest. (G,H) AoT images of the same patch of cells as in (F) in which neuronal fibers responding directly (G) and cells displaying a slow Ca2+ response (H) to electrical field stimulation (2 s, 20 Hz) are shown. (I) Histogram displaying the distances (μm) from an active neuronal component to cells with (red, n = 135) and without (black, n = 134) secondary responses to nerve stimulation (p < 0.05, Fisher's exact). (J) Image of the same cells as in (F) in which the distance from each pixel to an active neuronal component is color-coded. Scale bars: 50μm (A,F), 20μm (C,D).
Figure 4
Figure 4
Detection of neuronal vs. glial signals in ex vivo enteric nervous system preparations. (A) Gray scale image of a colonic myenteric plexus ganglion loaded with Fluo4 at rest. (B–D) Magnification of the square region marked in (A) before (B) and after (C,D) electrical stimulation (ETS, 2 s, 20 Hz) of an interganglionic connective. (E) Activity over time (AoT) image of the region in which pixels responding immediately (red) or with a delay (green) to ETS are false colored. Arrowheads point to enteric glial cells that display a Ca2+ transient secondary to neuronal stimulation. Dashed line (1) and (2) mark the neuronal fiber and glia cell used in (F) and (G). (F) Fluo4 traces of the regions of interest (color-coded in BD) showing responses upon ETS. (G) Magnification of the squared box in (F). Although the initial increase in the purple and green trace is due to a neuronal fiber (1) crossing the glial cell (2) it is still possible, because of the differences in upstroke speed to distinguish between neuronal and glial cell types. Scale bars: 50μm (A), 20μm (B,E).
Figure 5
Figure 5
Optogenetic Ca2+ imaging of enteric neuron-glia crosstalk. (A) Gray scale image of myenteric plexus ganglia dissected from a Wnt1-Cre;R26R-GCaMP3 mouse colon displaying baseline GCaMP3 fluorescence. (B) False-colored image of fluorescence response to 75 mM K+ depolarization (5 s) of the same ganglia as shown in (A). (C,D) Activity over time (AoT) images of the myenteric ganglion in the frame indicated in (A) in which only pixels responding to electrical stimulation (ETS, 2 s, 20 Hz) of an interganglionic connective (C, red, see also Supplementary movie 2) or local ATP (10μM, 20 s) stimulation (D, blue, see also Supplementary movie 3) are shown. (E) GCaMP3 fluorescence image of the same ganglion as in (C) and (D) immunostained for Sox10 (magenta). Arrows indicate enteric neurons displaying a Ca2+ transient upon electrical stimulation only. Arrowheads point to enteric glial cells responding to ATP stimulation. Asterisk indicates an enteric neuron that responds to both electrical and purinergic stimulation. (F) Gray scale images of a patch of cultured myenteric neurons and glia established from a Wnt1-Cre;R26R-GCaMP3 animal, before (0″), during (12″), and after (20″, 40″) stimulation with 75 mM K+ (5 s). (G) AoT image of the cells shown in (F) responding immediately (red) or with a delay (green) to 75 mM K+. See also Supplementary movie 4. (H) Recordings of the GCaMP3 responses to 75 mM K+ of one neuron and four surrounding enteric glial cells [color-coded numbers in (G)]. Neurons typically show an immediate Ca2+ transient to 75 mM K+ while enteric glial cells only respond with a delay, thus indicating neuron-to-glia communication. The slow downstroke of glial cell 4 (blue) could potentially be a sign of perturbed Ca2+ homeostasis or a general decline in cellular health. Note that post-hoc examination of cellular identity is redundant because of the genetically-imposed reporter expression. Scale bars: 50μm.
Figure 6
Figure 6
Interactions between enteric neurons and glia in the human enteric nervous system. (A) Individual confocal images of a human submucosal ganglion obtained from a duodenal biopsy in which enteric neurons are labeled with antibodies for HuCD (green) and NF-200 (red) and enteric glia are immunostained for S100β (blue). (B) Maximum projection of the same ganglion as in (A) with orthogonal X (bottom) and Y (right) views. Note how enteric neurons and glial cells are closely packed together within a dense ganglionic capsule. (C) Gray scale fluorescence image of a human submucosal ganglion loaded with the Ca2+ indicator Fluo4. (D) Image of the same ganglion as in (C), immunostained for HuCD (green) and S100β (magenta). (E) Ca2+ responses of a neuronal cell body and two glial cell processes [color-coded numbers in (C) and numbers in (D)] upon 75 mM K+ depolarization. Scale bars: 25μm (A,B), 50μm (C).

Similar articles

Cited by

References

    1. Bisschops R., Vanden Berghe P., Sarnelli G., Janssens J., Tack J. (2006). CRF-induced calcium signaling in guinea pig small intestine myenteric neurons involves CRF-1 receptors and activation of voltage-sensitive calcium channels. Am J Physiol. Gastrointest. Liver Physiol. 290, G1252–G1260 10.1152/ajpgi.00349.2004 - DOI - PubMed
    1. Boesmans W., Cirillo C., Van Den Abbeel V., Van Den Haute C., Depoortere I., Tack J., et al. (2013). Neurotransmitters involved in fast excitatory neurotransmission directly activate enteric glial cells. Neurogastroenterol. Motil. 25, e151–e160 10.1111/nmo.12065 - DOI - PubMed
    1. Bondurand N., Natarajan D., Thapar N., Atkins C., Pachnis V. (2003). Neuron and glia generating progenitors of the mammalian enteric nervous system isolated from foetal and postnatal gut cultures. Development 130, 6387–6400 10.1242/dev.00857 - DOI - PubMed
    1. Broadhead M. J., Bayguinov P. O., Okamoto T., Heredia D. J., Smith T. K. (2012). Ca2+ transients in myenteric glial cells during the colonic migrating motor complex in the isolated murine large intestine. J. Physiol. 590, 335–350 10.1113/jphysiol.2011.219519 - DOI - PMC - PubMed
    1. Cirillo C., Sarnelli G., Turco F., Mango A., Grosso M., Aprea G., et al. (2011). Proinflammatory stimuli activates human-derived enteroglial cells and induces autocrine nitric oxide production. Neurogastroenterol. Motil. 23, e372–e382 10.1111/j.1365-2982.2011.01748.x - DOI - PubMed